
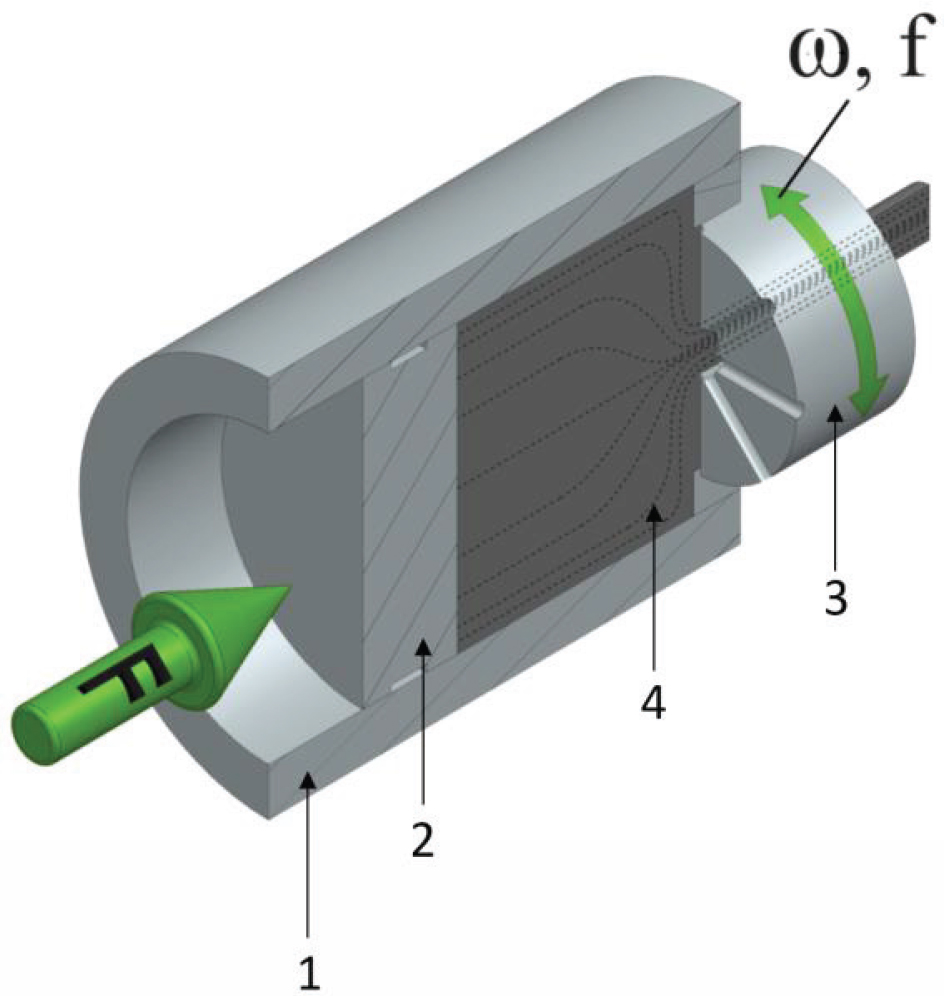
Fig. 1.
Schematic of KOBO extrusion process: 1- container sleeve, 2- butt, 3- die, 4- billet
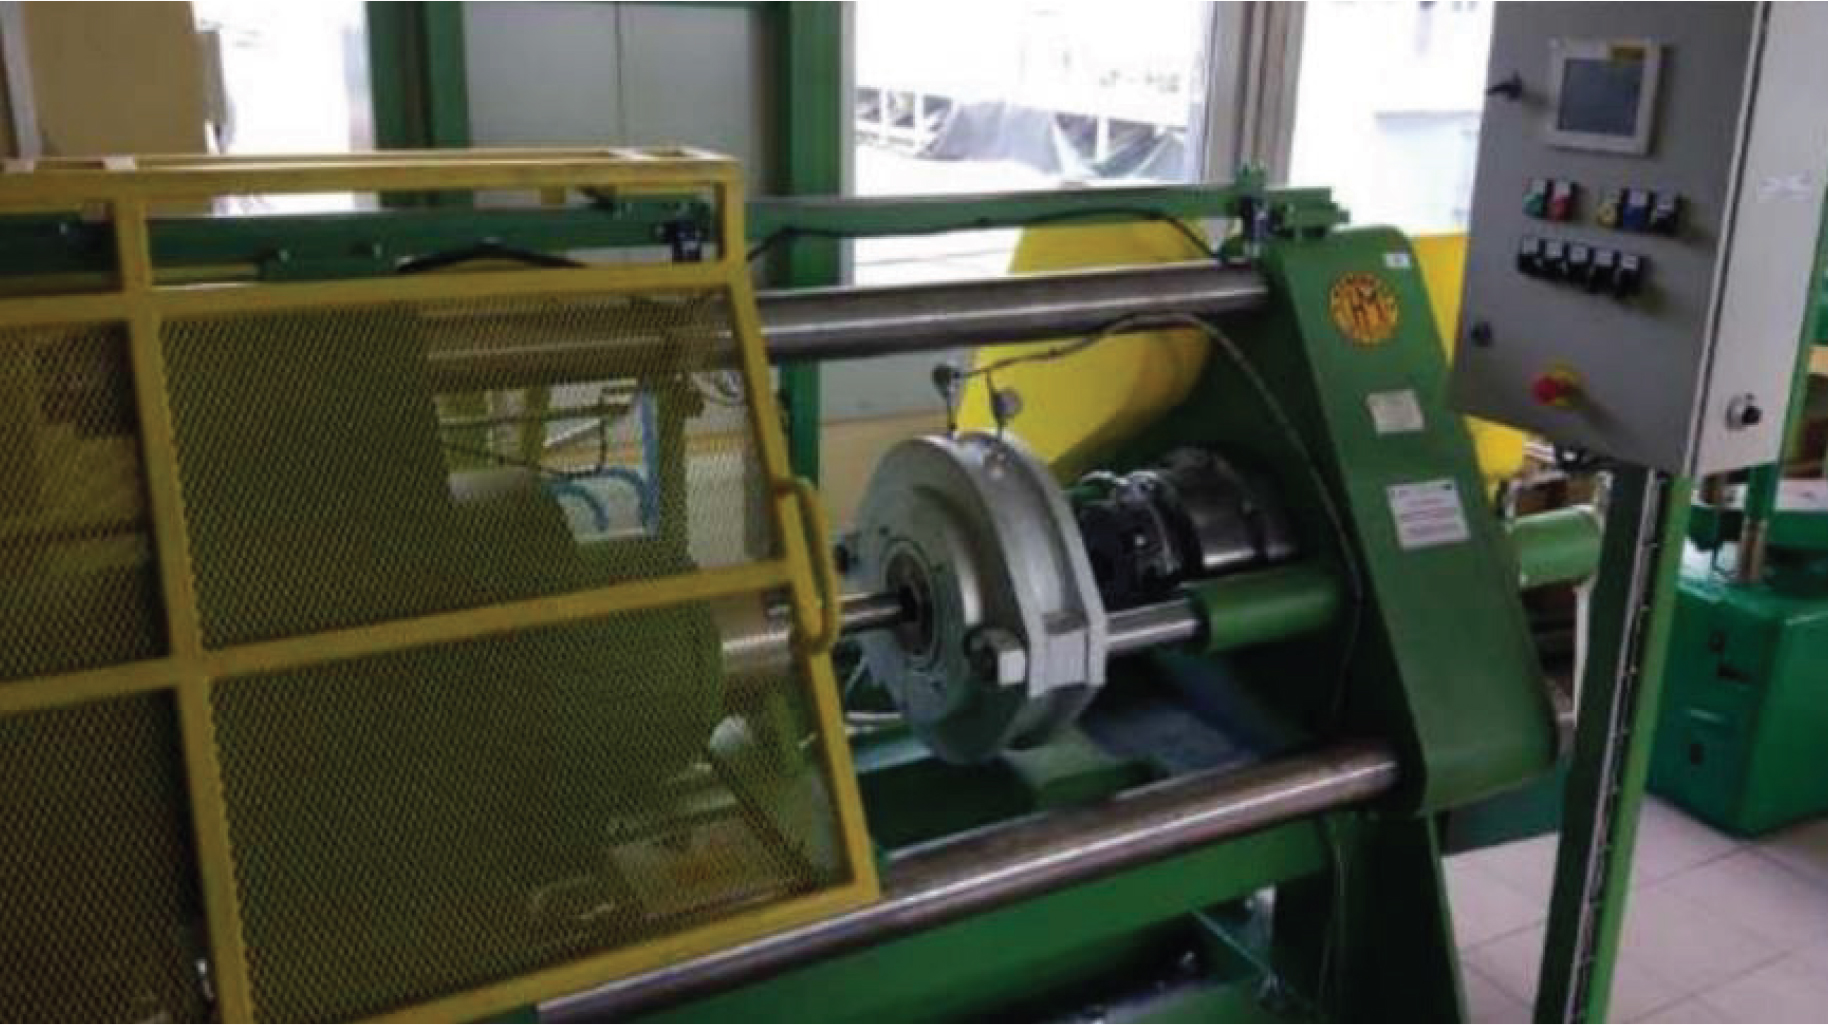
Fig. 2.
2500 kN KOBO extrusion press
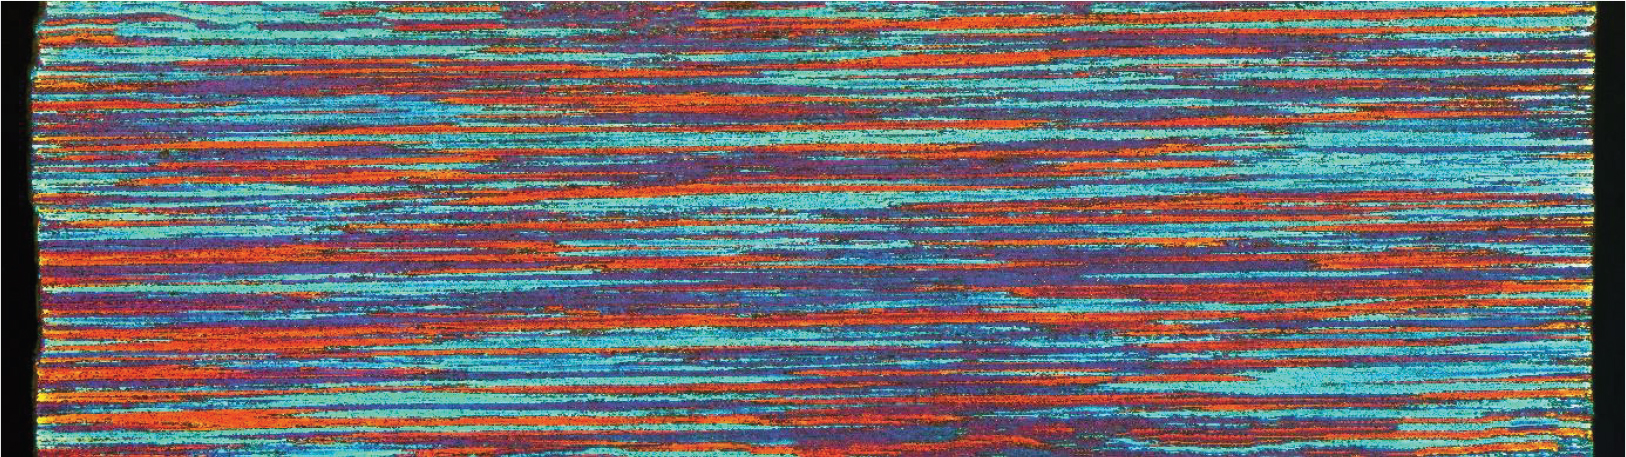
Fig. 3.
Macrostructure of the longitudinal section of the test material in the initial state (annealed 7075 aluminum alloy)
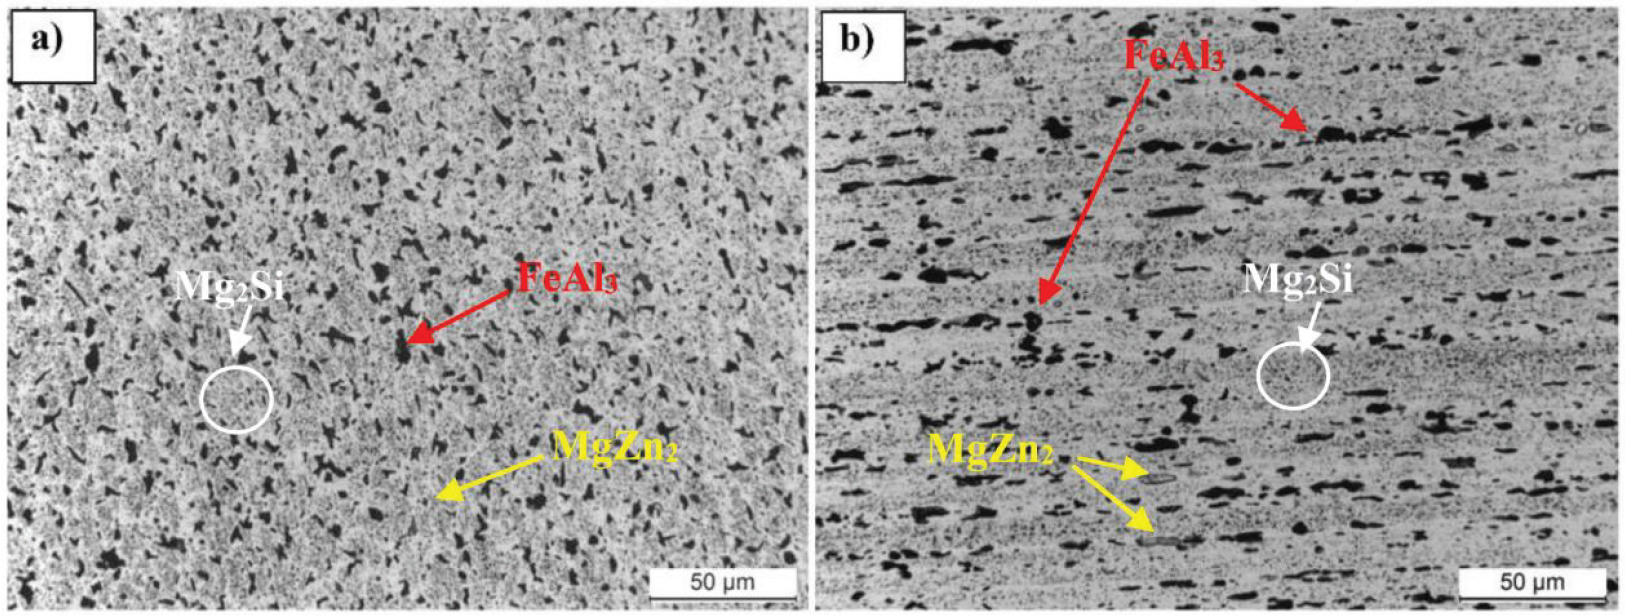
Fig. 4.
Microstructures of 7075 aluminum alloy initial condition, cross-section (a) and longitudinal section (b), 500x mag
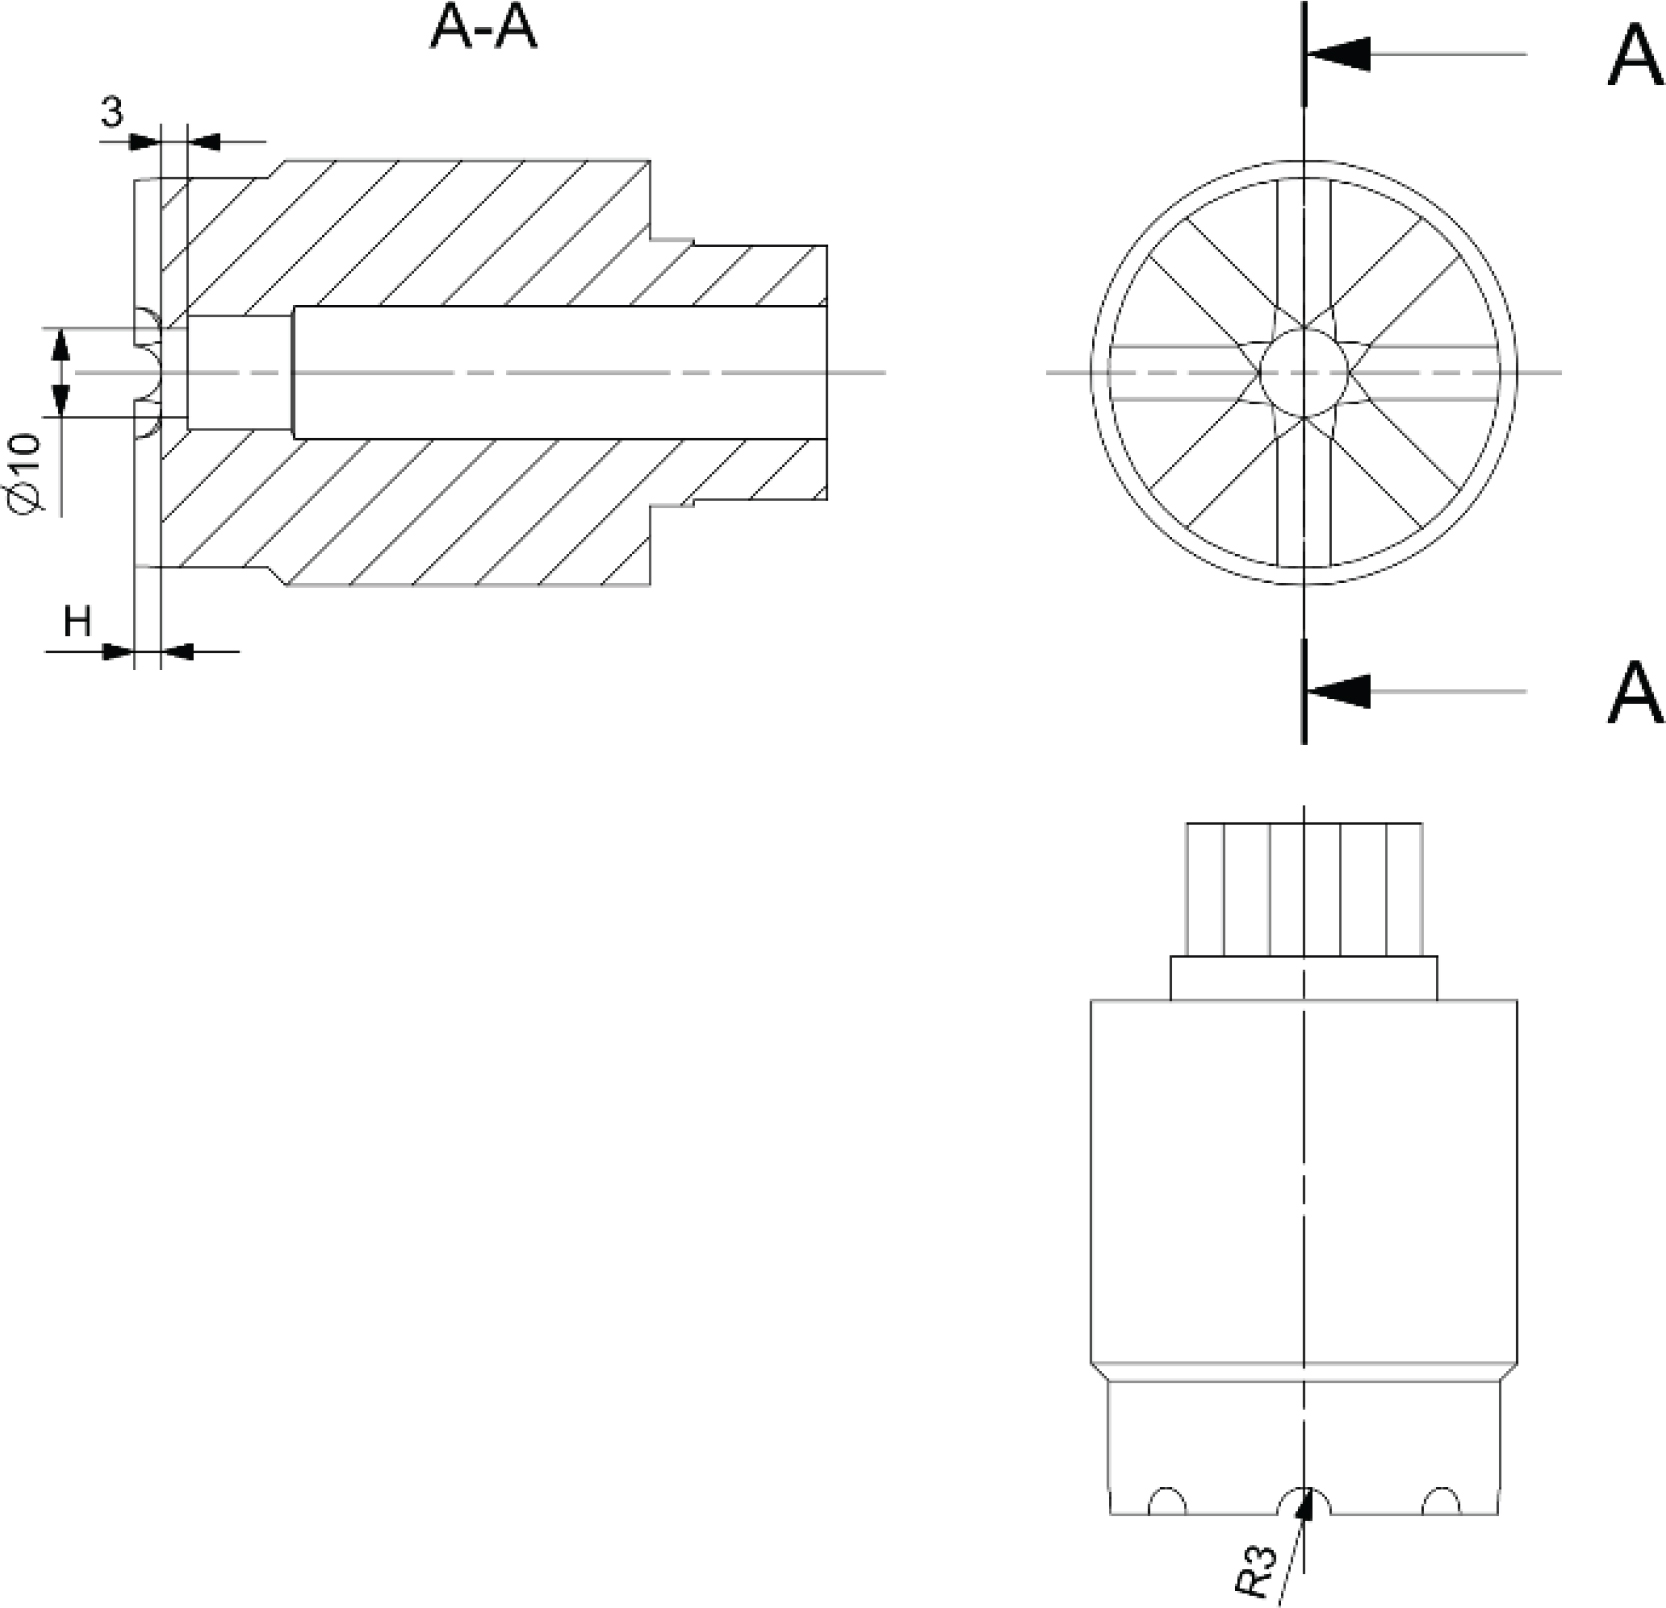
Fig. 5.
Sketch of characteristic features of dies for KOBO process
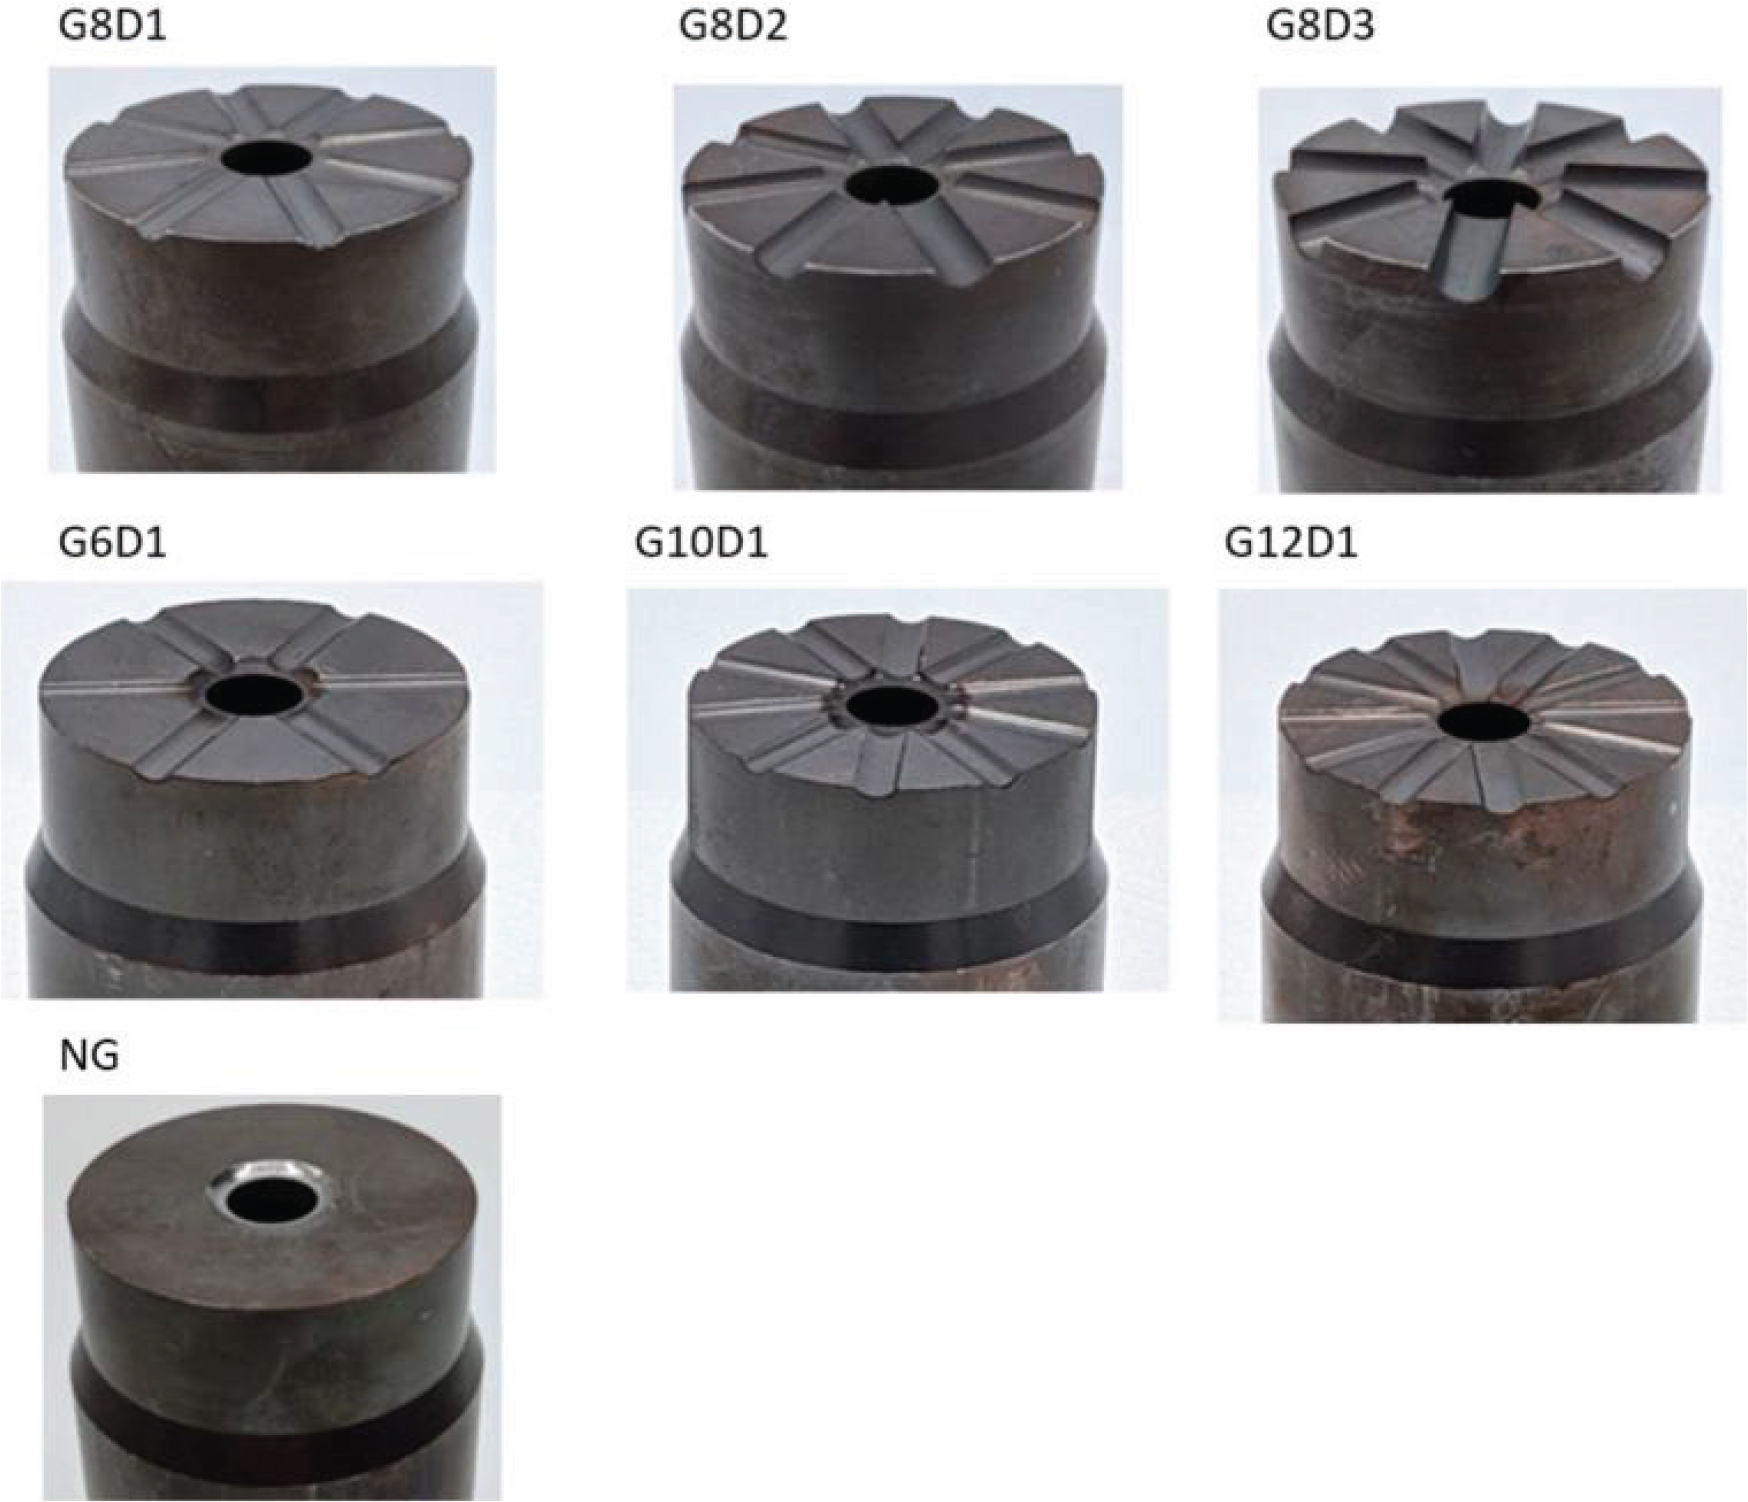
Fig. 6.
Dies used for experimental research
Table 1.
Dimensions of the characteristic features of the dies used for experimental research
| Code | Number of grooves | Grooves depth [mm] |
|---|---|---|
| G8D1 | 8 | 1 |
| G8D2 | 8 | 2 |
| G8D3 | 8 | 3 |
| G6D1 | 6 | 1 |
| G10D1 | 10 | 1 |
| G12D1 | 12 | 1 |
| NG | – | – |
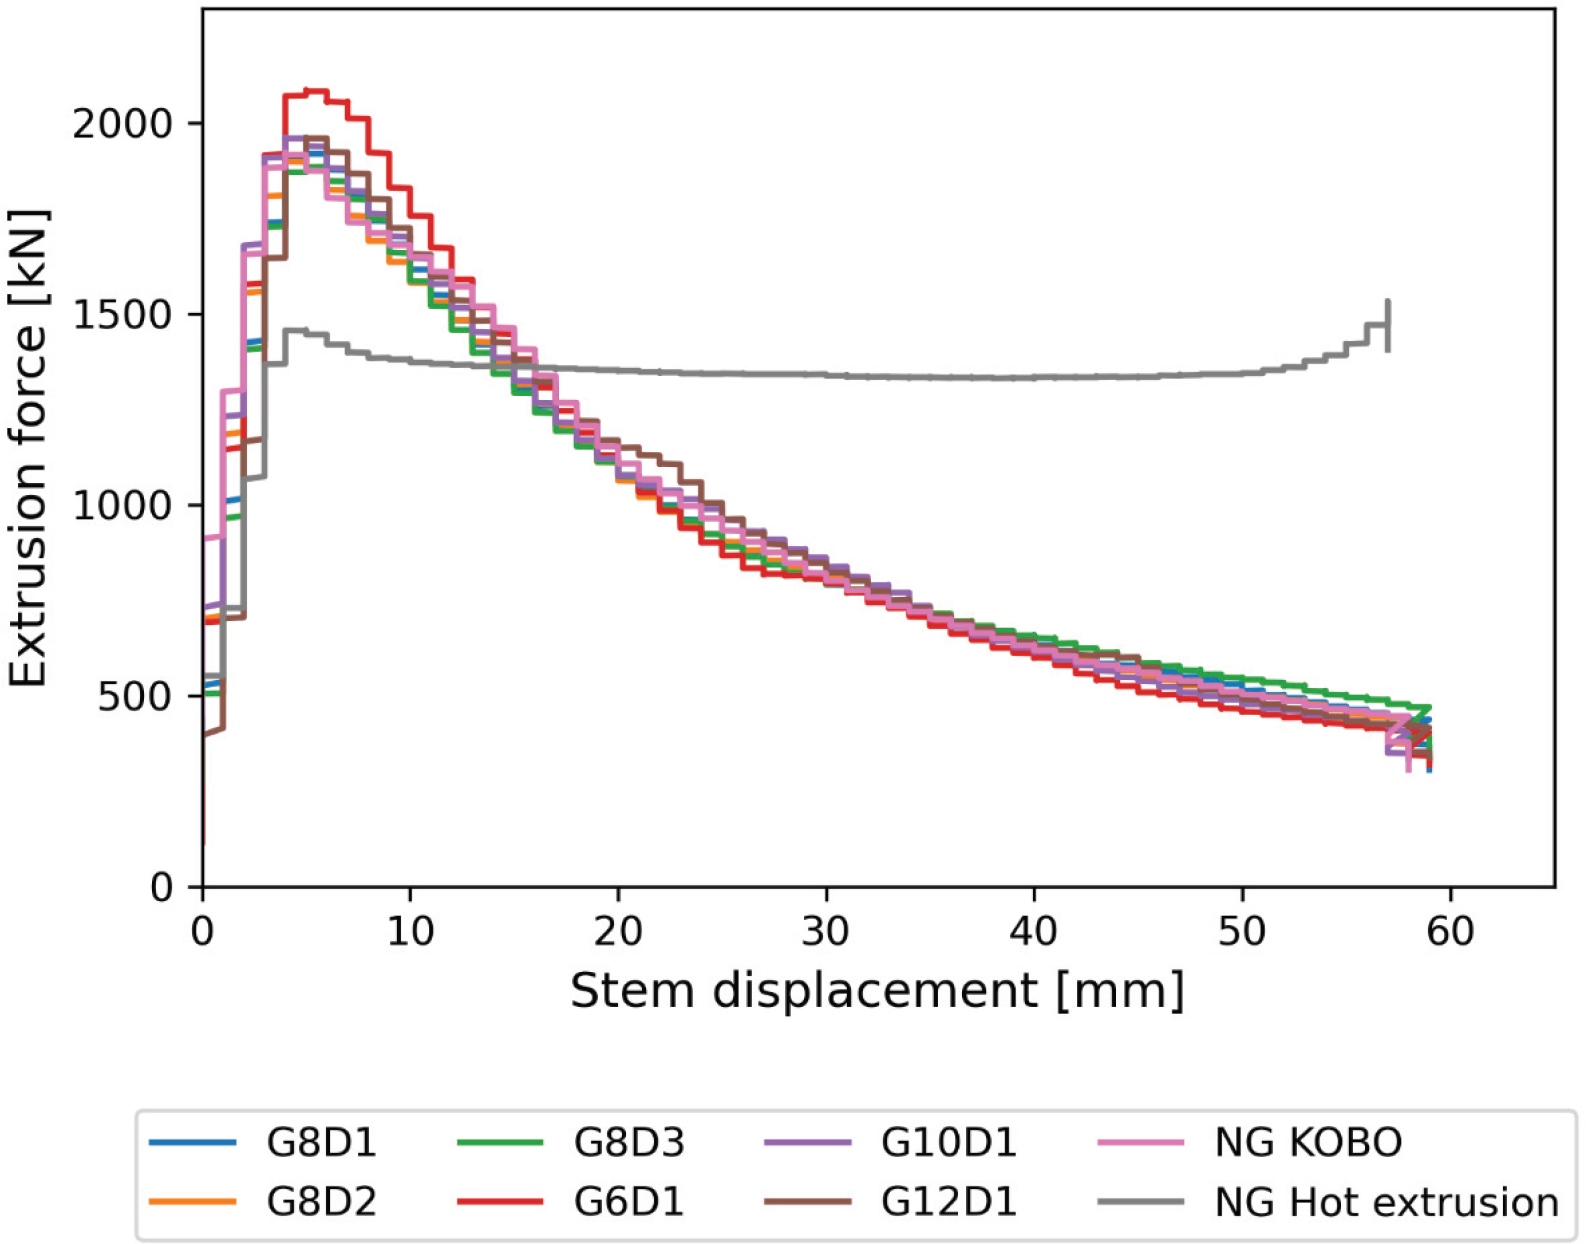
Fig. 7.
Graph of the extrusion force as a function of stem displacement
Table 2.
Maximum recorded extrusion forces in the KOBO process using different die types
| Test | Maximum extrusion force [kN] | Comment |
|---|---|---|
| G8D1 | 2086 | No container sleeve cleaning before test |
| G8D2 | 1962 | |
| G8D3 | 1962 | |
| G6D1 | 1924 | |
| G10D1 | 1906 | |
| G12D1 | 1890 | |
| NG KOBO | 1923 | Flat face die |
| NG | 1458 | Conventional extrusion at 450° C |
| Butt | 79 | Butt pushing force while cleaning container sleeve |
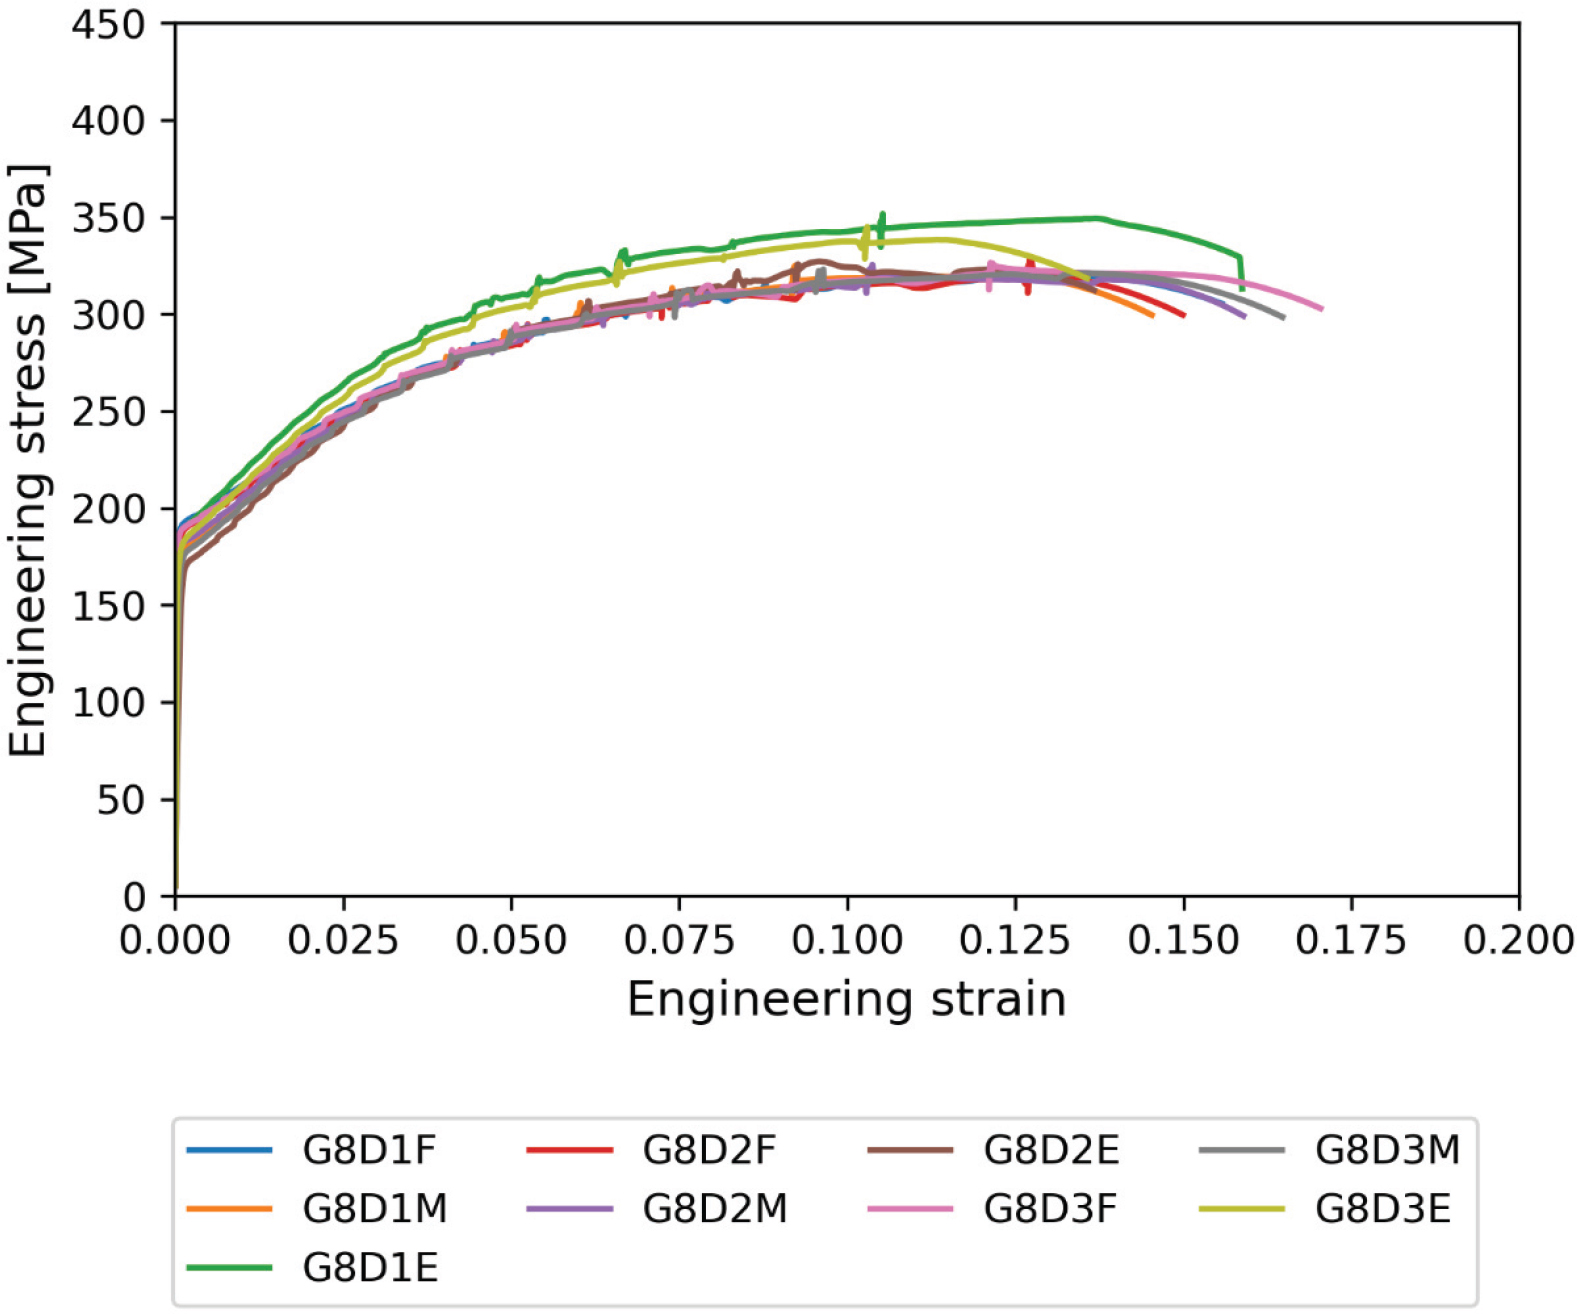
Fig. 8.
Graph of stress-strain relationships in static tensile test of extruded products – samples taken from three areas along the length of the extrudate – series 1
Table 3.
Mechanical properties of extrudate determined by static tensile test – series 1
| Rp0.2 | Rm | A50 | |
|---|---|---|---|
| MPa | MPa | % | |
| G8D1F | 194.3767 | 319.763 | 16.82835 |
| G8D1M | 182.0377 | 325.0069 | 15.53416 |
| G8D1E | 191.4832 | 351.6311 | 17.21147 |
| G8D2F | 191.682 | 329.3694 | 16.09939 |
| G8D2M | 184.0032 | 325.3811 | 17.21048 |
| G8D2E | 174.6589 | 327.0506 | 14.48359 |
| G8D3F | 191.8396 | 326.371 | 18.55923 |
| G8D3M | 179.7999 | 322.9885 | 17.81401 |
| G8D3E | 187.1591 | 344.8309 | 14.46475 |
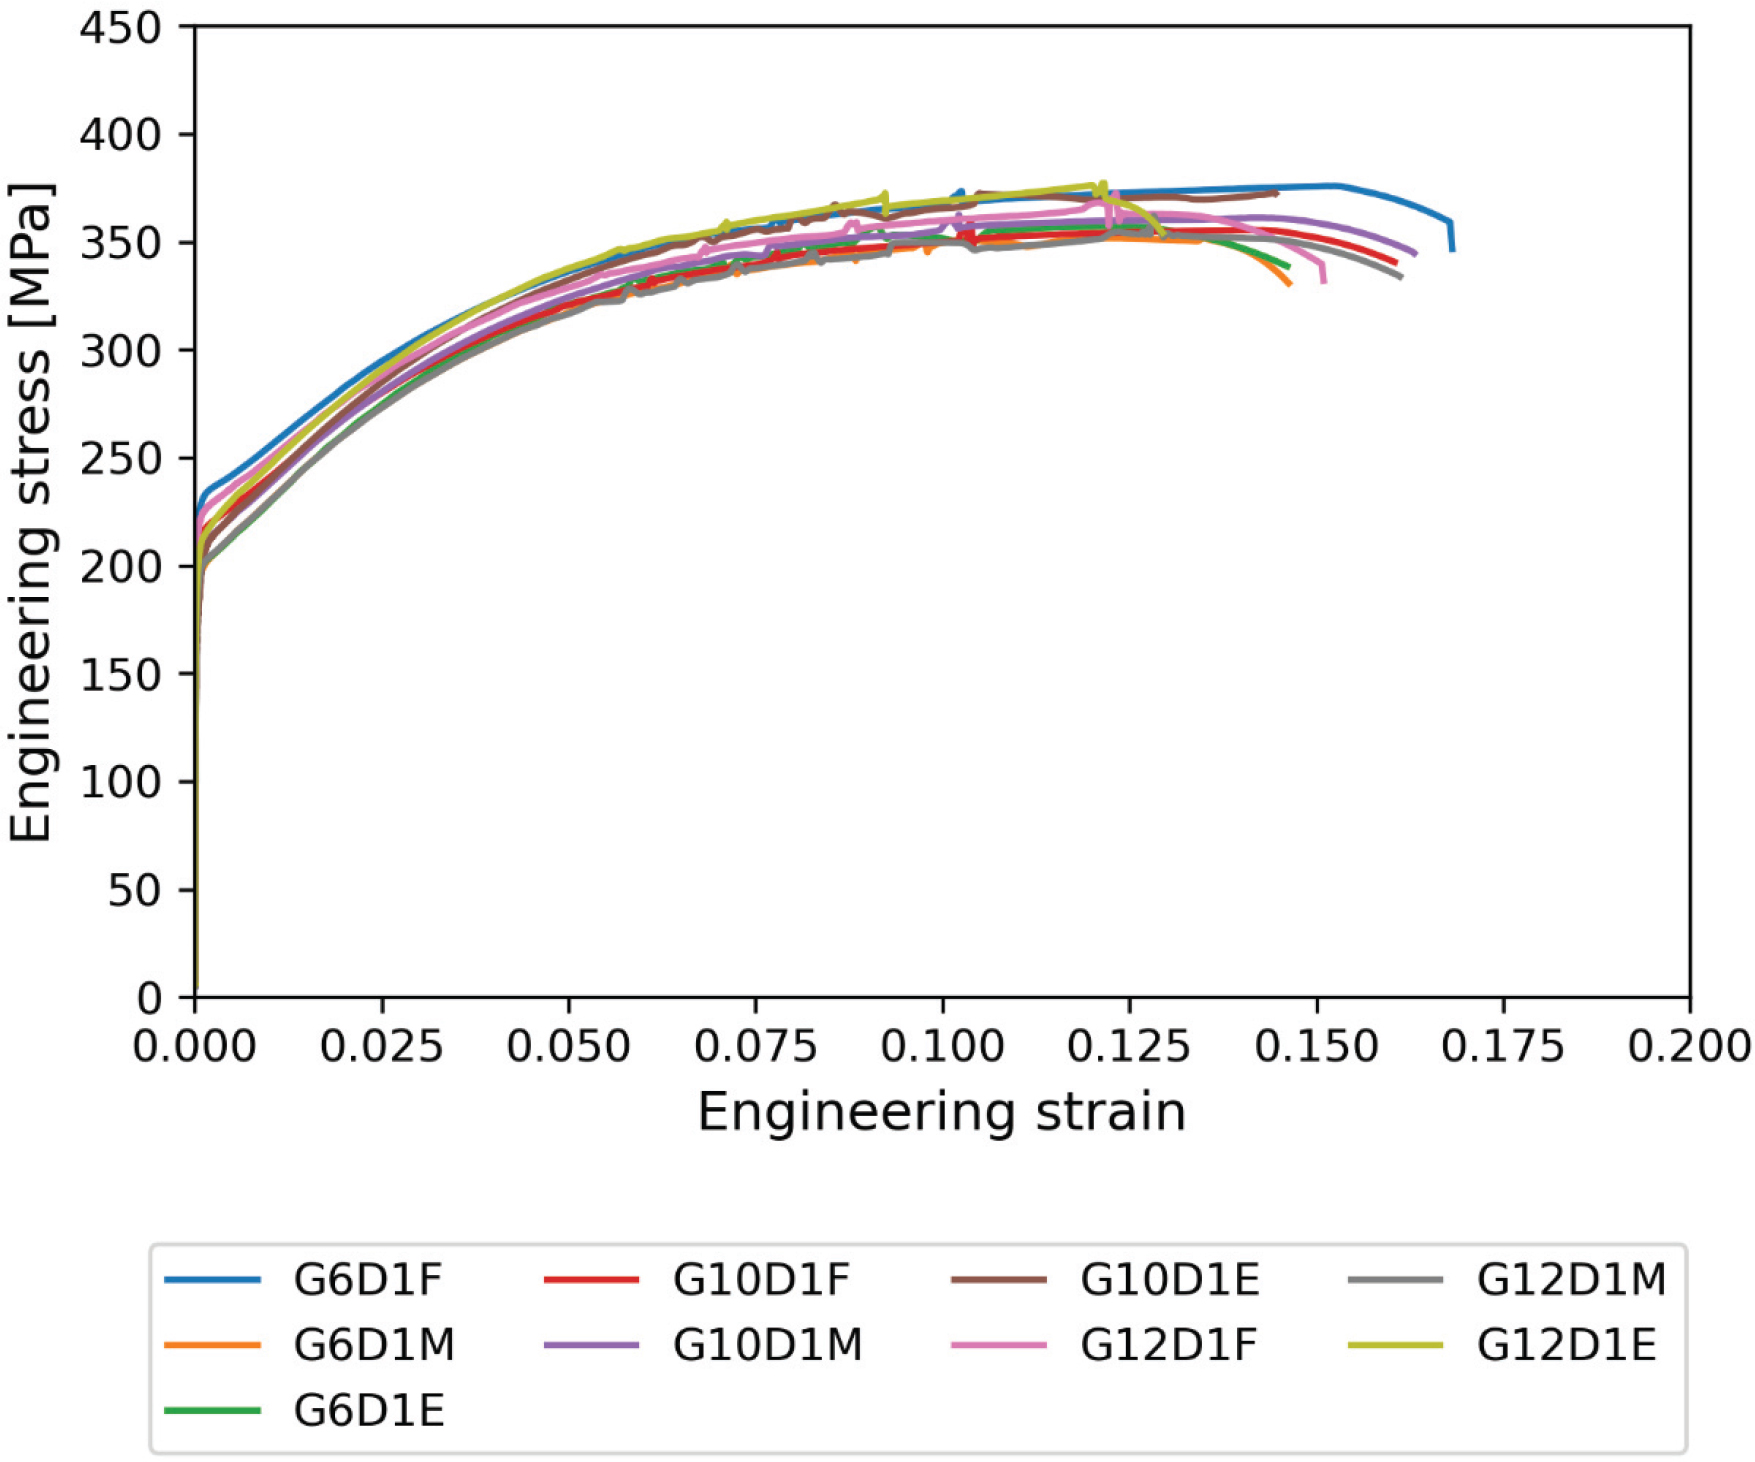
Fig. 9.
Graph of stress-strain relationships in static tensile test of extruded products – samples taken from three areas along the length of the extrudate – series 2
Table 4.
Mechanical properties of extrudate determined by static tensile test – series 2
| Rp0.2 | Rm | A50 | |
|---|---|---|---|
| MPa | MPa | % | |
| G6D1F | 139.9892 | 375.7772 | 18.3135 |
| G6D1M | 203.2703 | 351.6911 | 15.75259 |
| G6D1E | 203.6512 | 357.1238 | 15.73096 |
| G10D1F | 219.1892 | 359.8165 | 17.40554 |
| G10D1M | 213.132 | 362.4292 | 17.7133 |
| G10D1E | 211.7307 | 372.7265 | 15.55199 |
| G12D1F | 228.0526 | 372.5014 | 16.29631 |
| G12D1M | 204.0853 | 361.9522 | 17.48726 |
| G12D1E | 217.7237 | 377.1663 | 13.81927 |
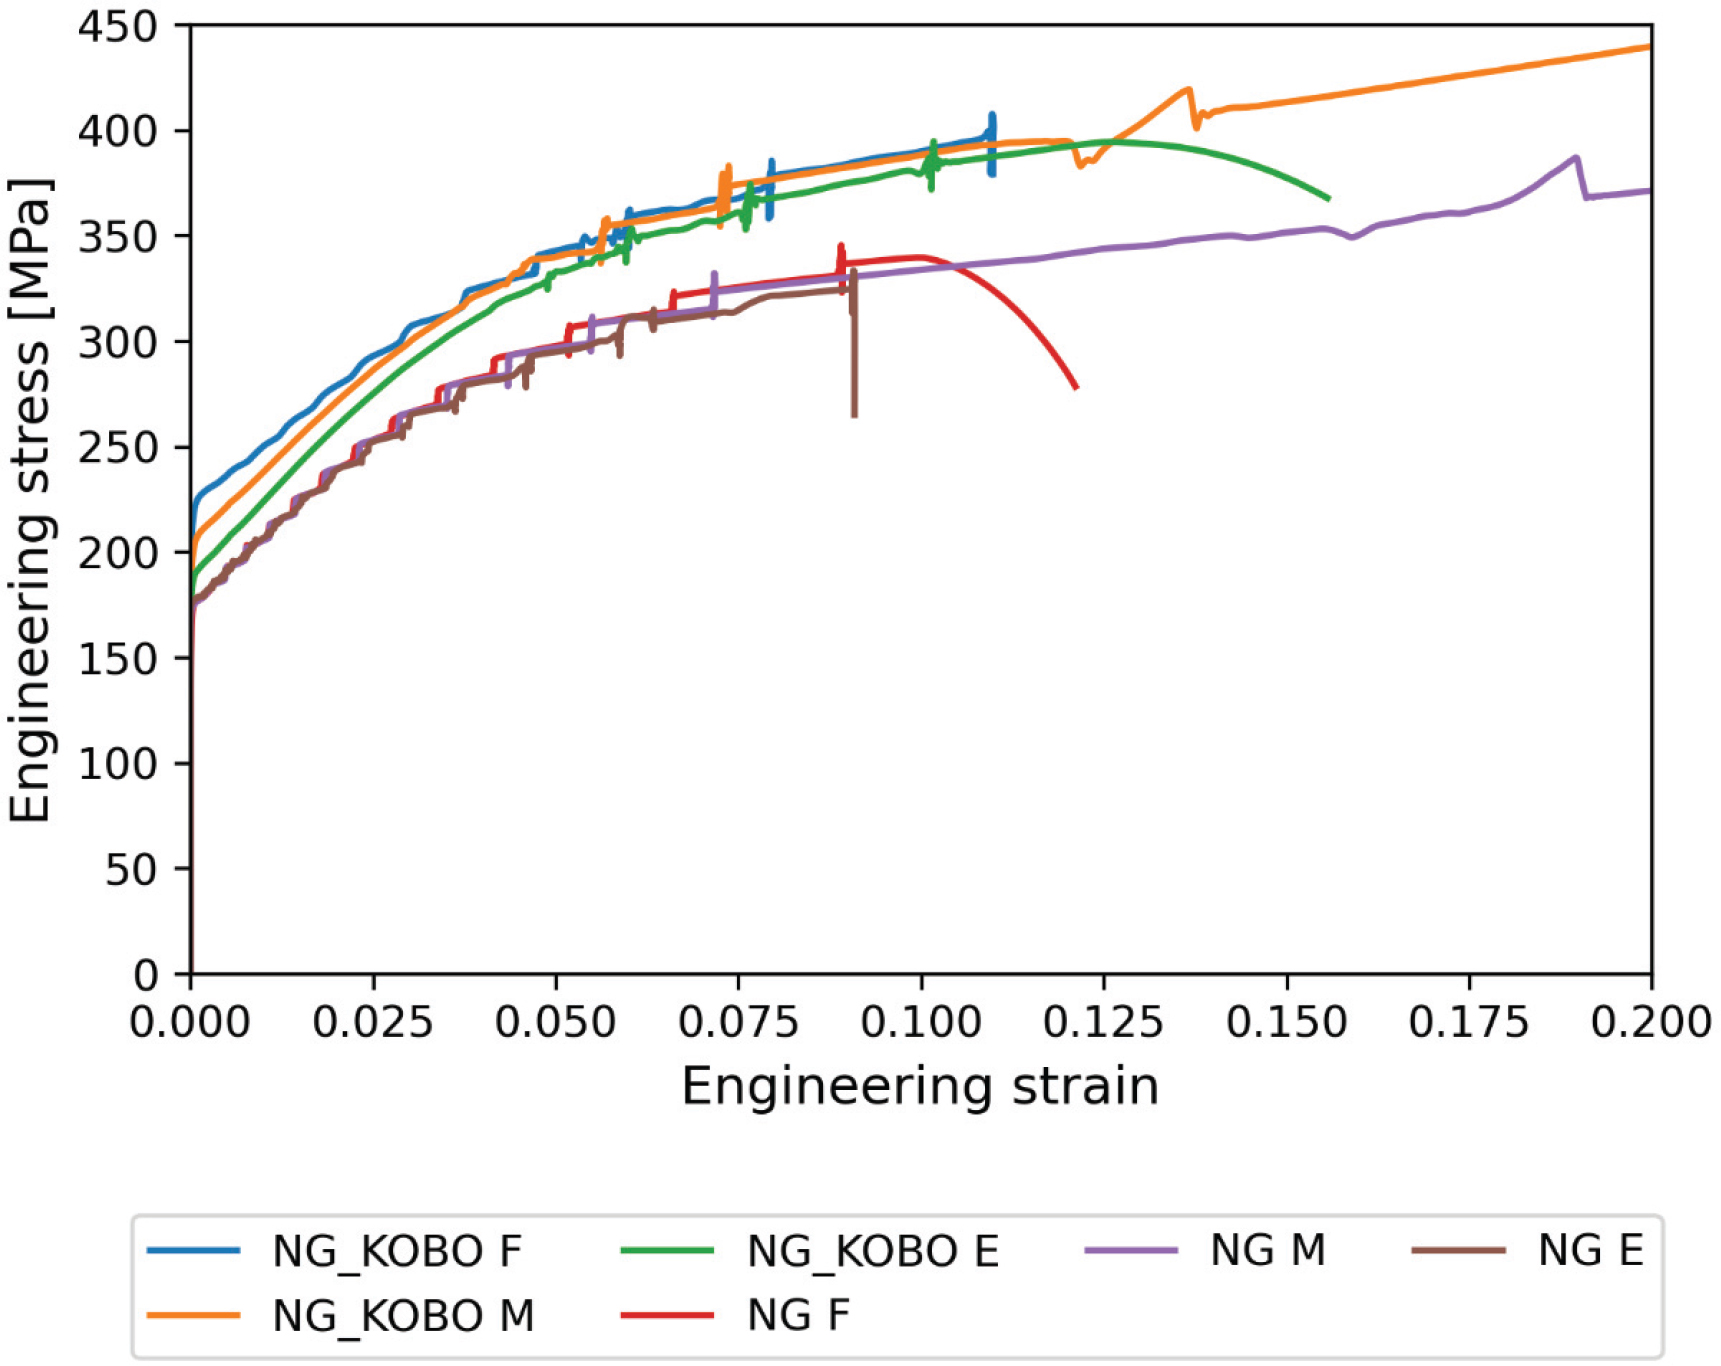
Fig. 10.
Graph of stress-strain relationships in static tensile test of extruded products – samples taken from three areas along the length of the extrudate – series 3
Table 5.
Mechanical properties of extrudate determined by static tensile test – series 3
| Rp0.2 | Rm | A50 | |
|---|---|---|---|
| NG_KOBO F | 227.5532 | 363.6127 | 11.61306 |
| NG_KOBO M | 210.6277 | 368.3837 | 37.3797 |
| NG_KOBO E | 194.2238 | 354.8399 | 16.83634 |
| NG F | 178.6093 | 314.8302 | 12.87594 |
| NG M | 178.4273 | 318.8969 | 27.68791 |
| NG E | 179.8115 | 303.1239 | 9.513819 |
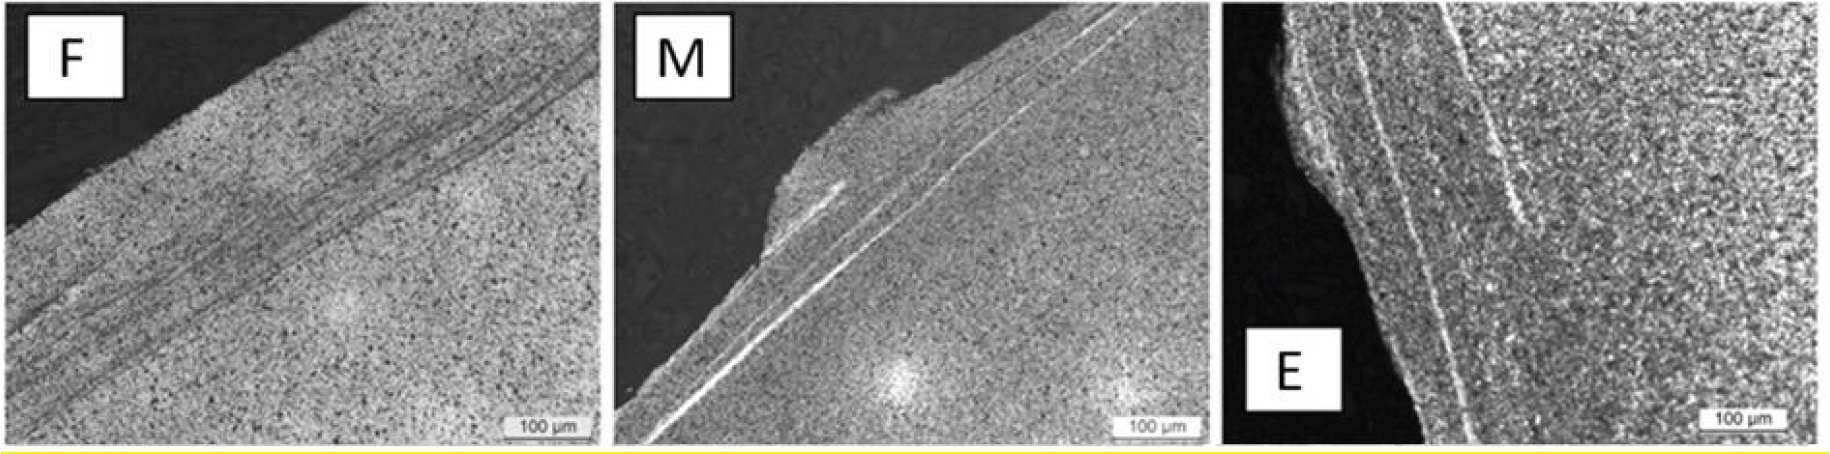
Fig. 11.
Macrostructure of 7075 alloy: front, 200x mag.; middle, 100x mag.; and end extrusion stages, 100x mag. Visible shear lines in the near-surface area
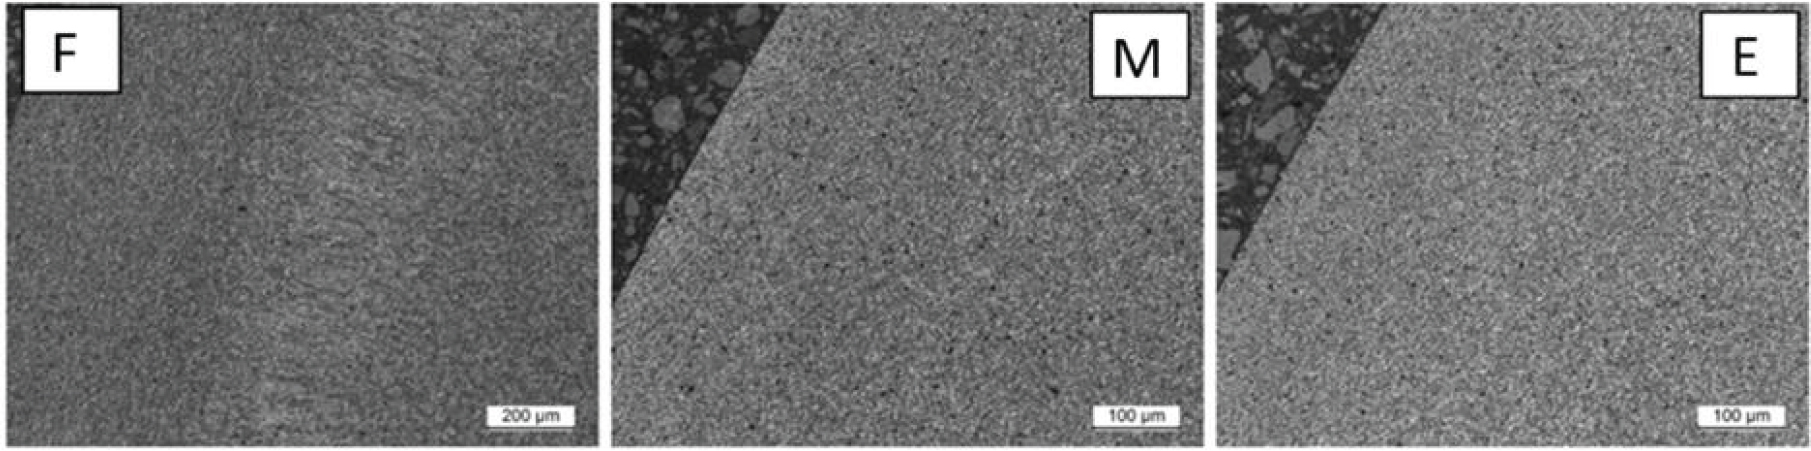
Fig. 12.
Macrostructure of alloy 7075 after conventional extrusion: front, middle and end extrusion stages, 100x mag. No clear shear lines, visible peripheral disruption of the alloy microstructure due to flow
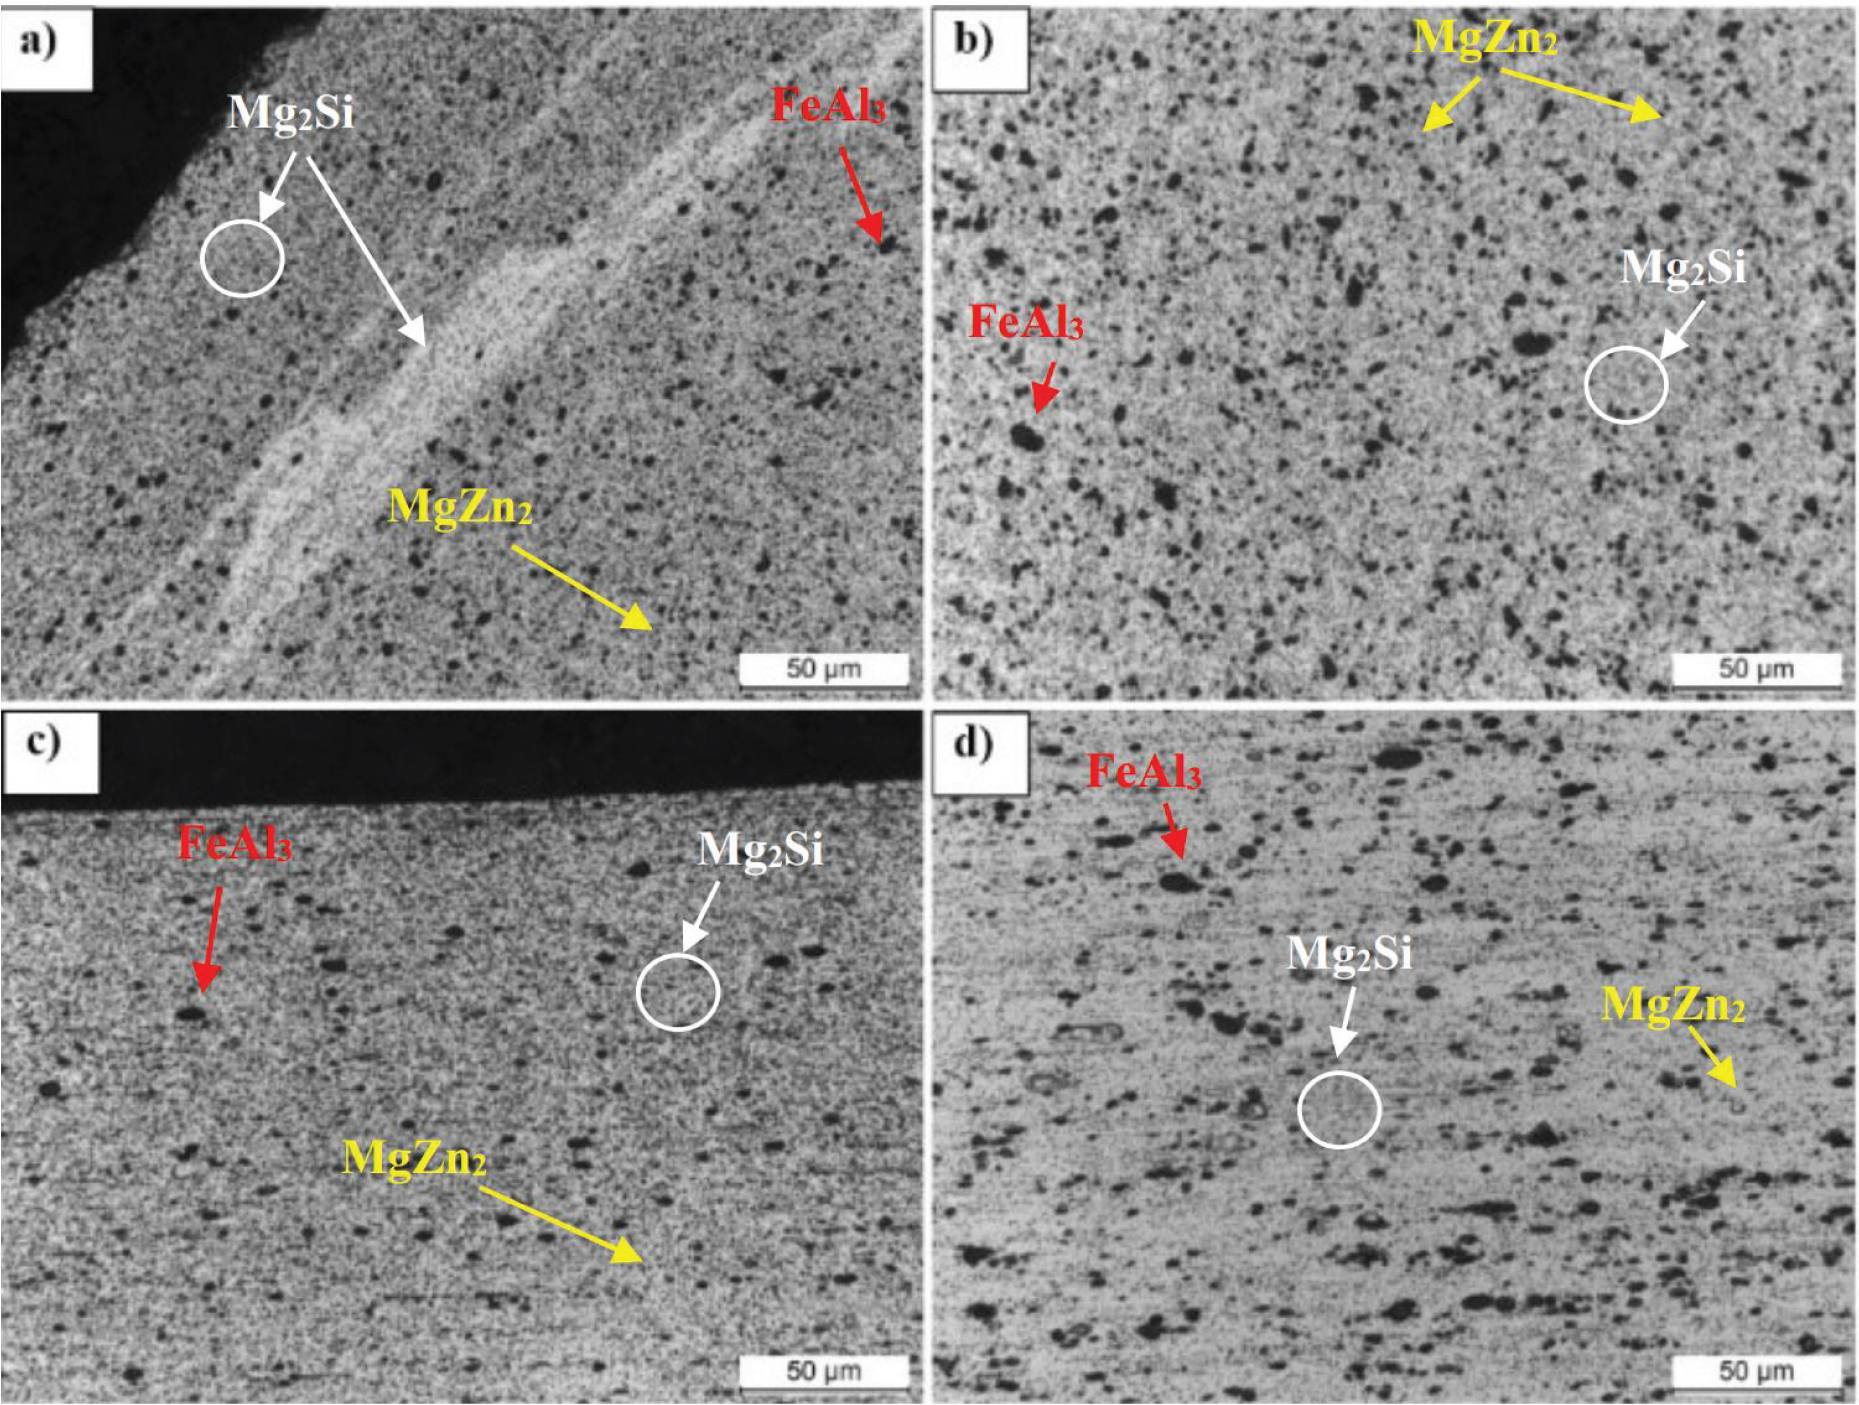
Fig. 13.
Microstructure of 7075 alloy: cross-sectional view of the near-surface area (a) and the area inside the bar (b), and longitudinal section of the near-surface area (c) and the area inside the bar (d), 500x mag
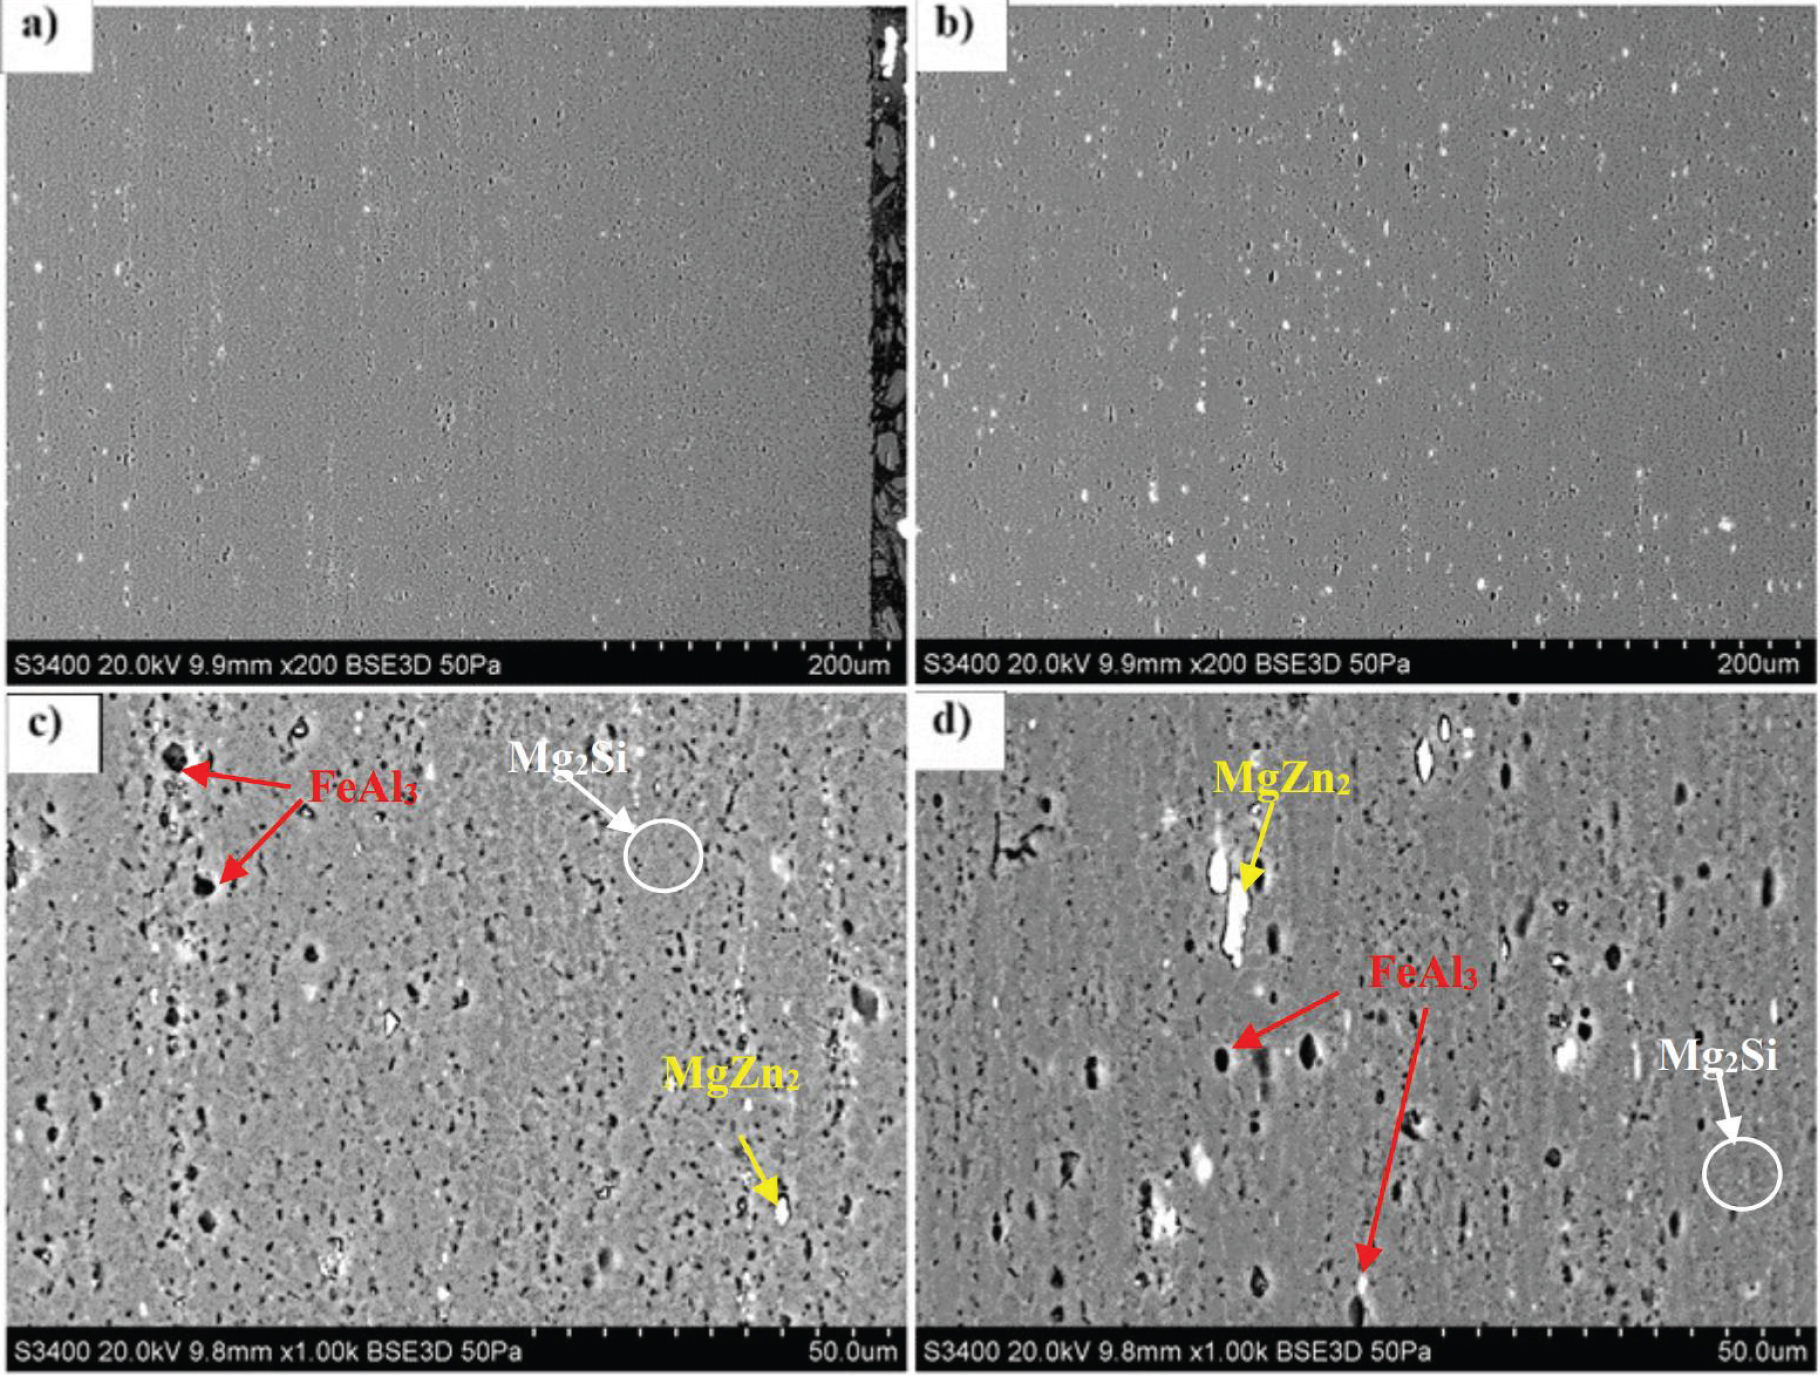
Fig. 14.
Microstructure of 7075 alloy typical of all tested KOBO samples in the near-surface zone (a and c, 200x mag.) and beyond (b and d, 1000x mag.). Longitudinal section, SEM
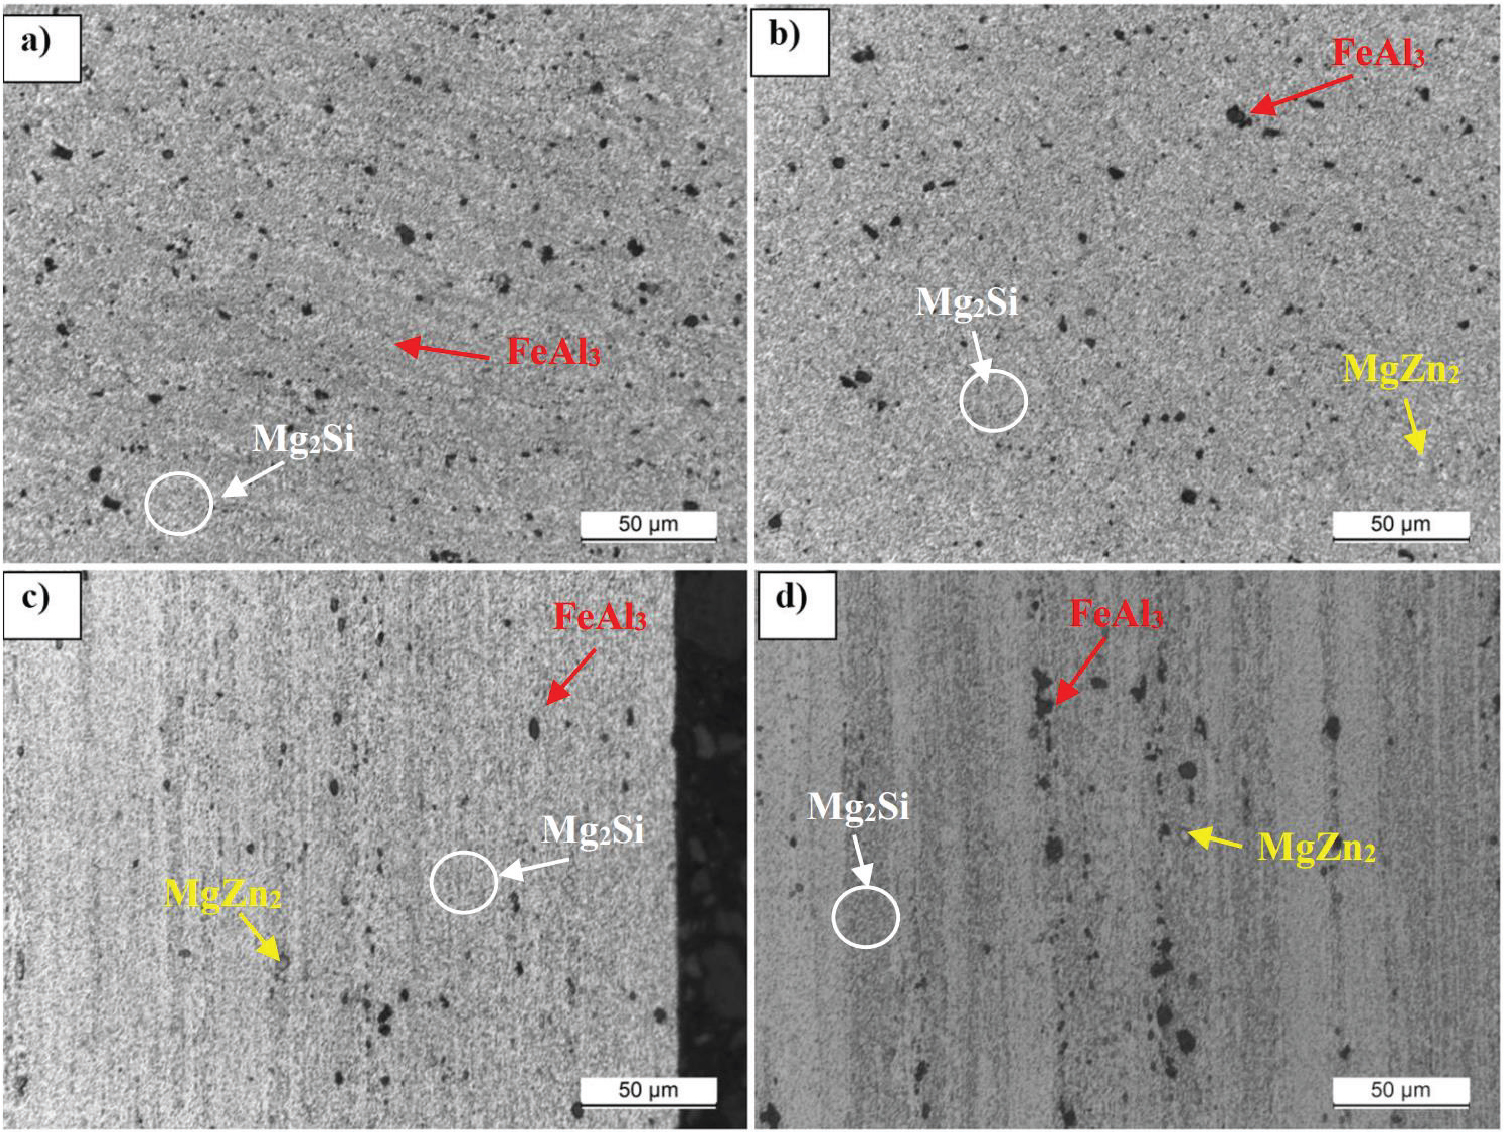
Fig. 15.
Microstructure of 7075 alloy, test NG (F): cross-section of the near-surface area (a) and the area inside the bar (b) and longitudinal cross-section of the near-surface area (c) and the area inside the bar (d), 500x mag
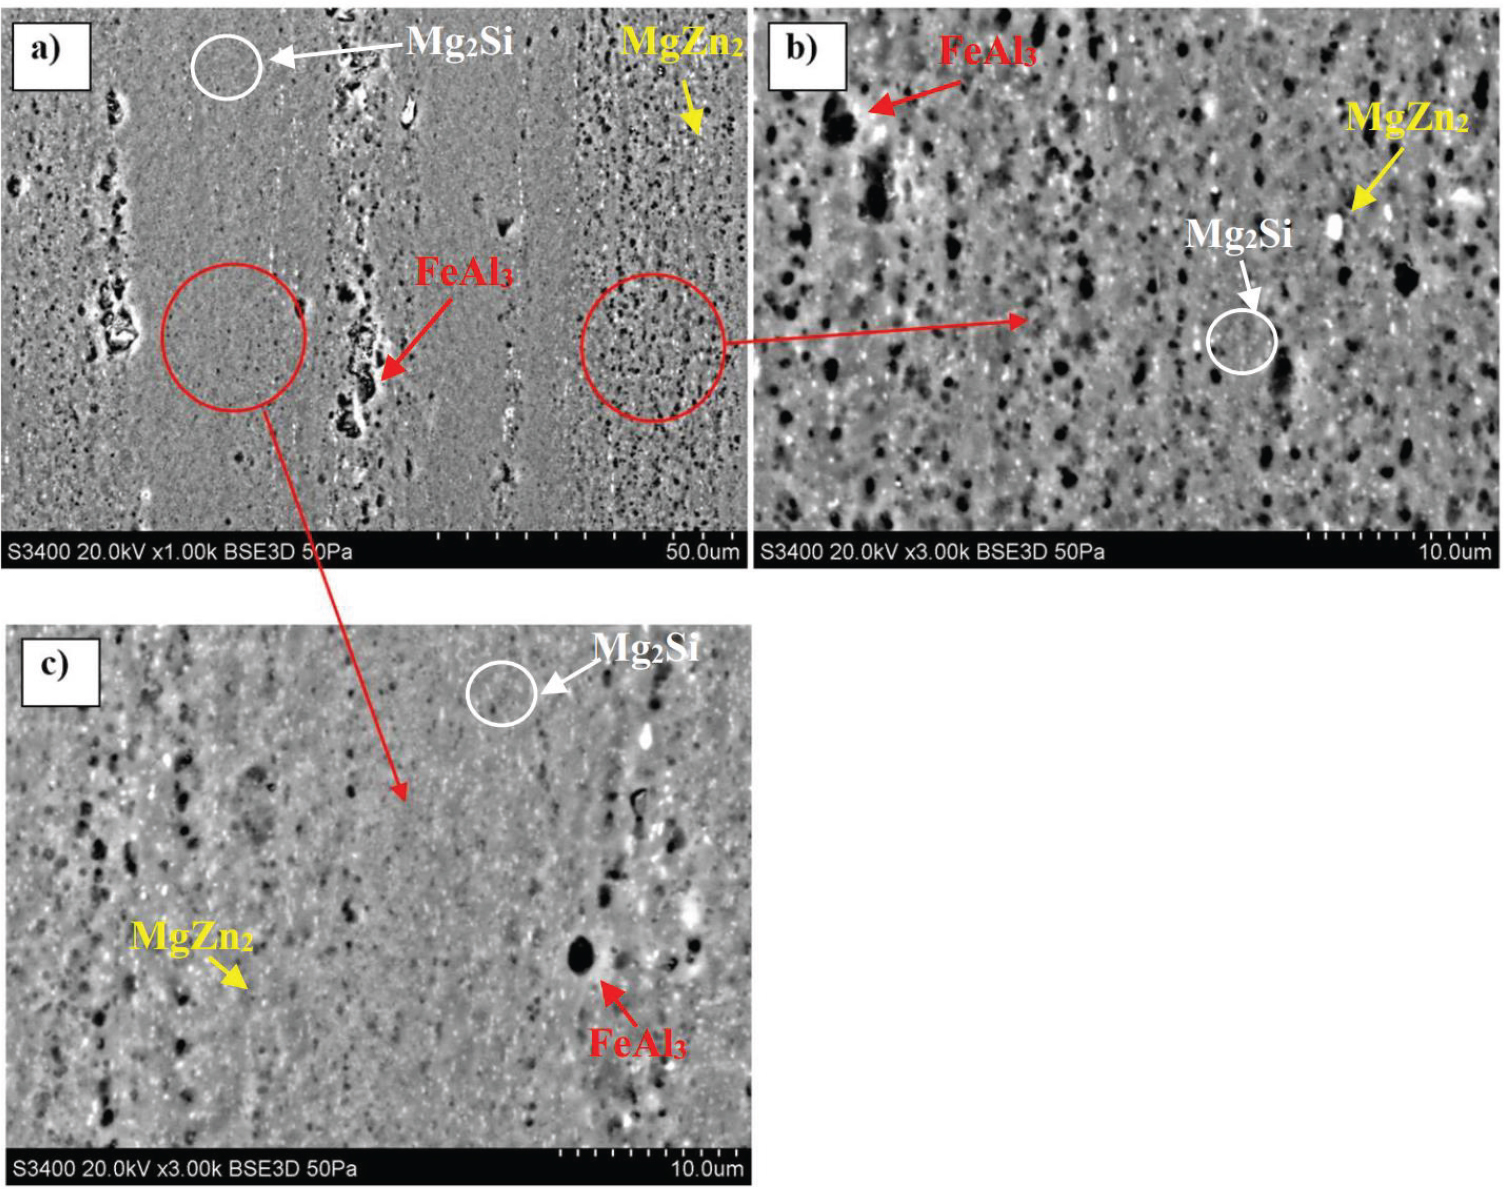
Fig. 16.
Microstructure of the extrudate, sample NG (F): longitudinal cross-section, visible inhomogeneity due to the banded structure of the rod, SEM, (a) 1000x mag., (b) & (c) 3000x mag