
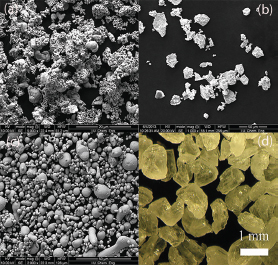
Fig. 1.
SEM images of (a) Ta powder, (b) Nb powder, (c) Sn powder, and (d) carbamide powder
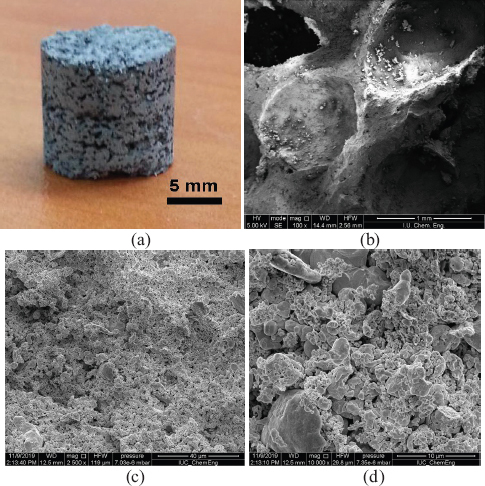
Fig. 2.
(a) Photograph of the foam, (b) SEM image of the macro-pores, (c) SEM image of the cell wall (low magnification), and (d) SEM image of the cell wall (high magnification)
Table 1.
Mean size of carbamide particles and mean pores size of the sintered foams
| Carbamide particle shape | Carbamide particle size ranges (μm) | Mean carbamide particle size (μm) | Mean pore size (μm) |
|---|---|---|---|
| Irregular | –1400+1000 | 1270 | 850 |
| Irregular | –1000+710 | 860 | 590 |
| Irregular | –710+500 | 580 | 410 |
| Spherical | –1400+1000 | 1300 | 880 |
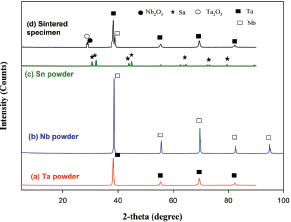
Fig. 3.
XRD patterns of the (a) Ta powder, (b) Nb powder, (c) Sn powder and (d) sintered alloy
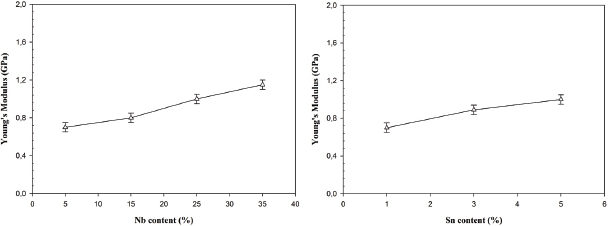
Fig. 4.
Effect of (a) Nb content and (b) Sn content of the alloy on the Young’s modulus
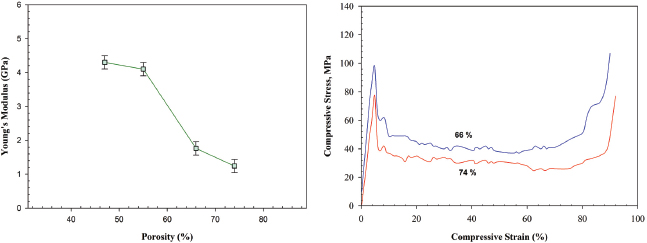
Fig. 5.
Effect of porosity on (a) Young’s modulus and (b) compressive stress-strain diagram
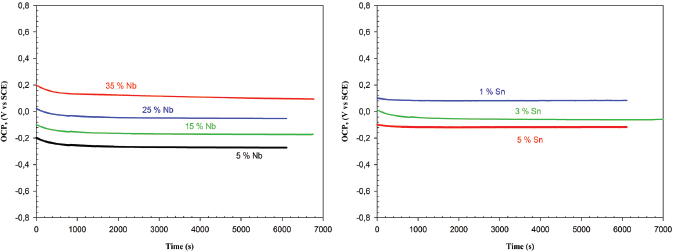
Fig. 6.
Variation of the open circuit potential value with (a) the Nb content and (b) the Sn content of the alloy
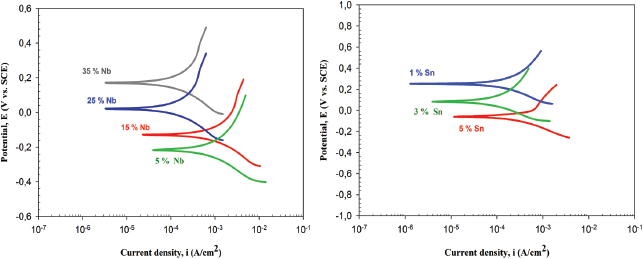
Fig. 7.
Effect of (a) Nb content and (b) Sn content of the alloy on the Tafel curves of the samples
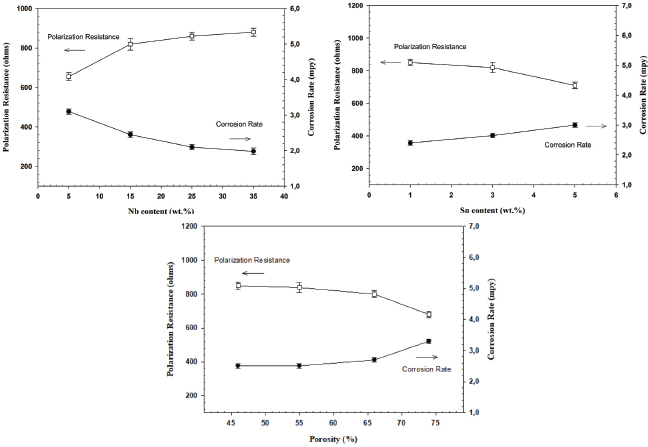
Fig. 8.
Effect of (a) Nb content of the alloy, (b) Sn content of the alloy, and (c) porosity content on the polarization resistance and corrosion rate
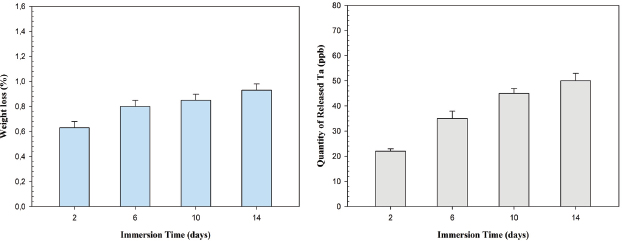
Fig. 9.
Effect of immersion time on the (a) weight loss and (b) Ta ion release in simulated body fluid solution
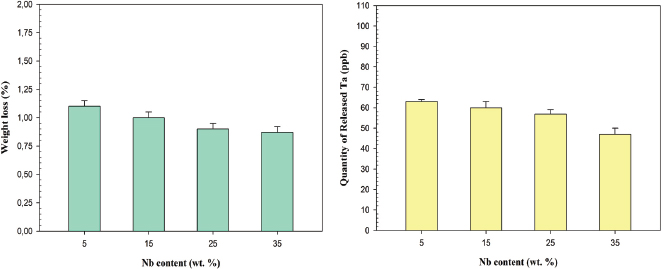
Fig. 10.
Effect of Nb content of the alloy on (a) weight loss and (b) Ta ion release in simulated body fluid solution
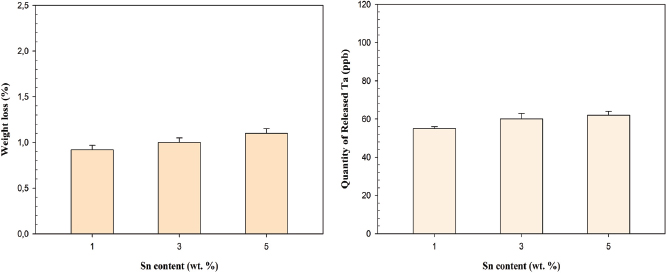
Fig. 11.
Effect of Sn content of the alloy on the (a) weight loss and (b) Ta ion release in simulated body fluid solution
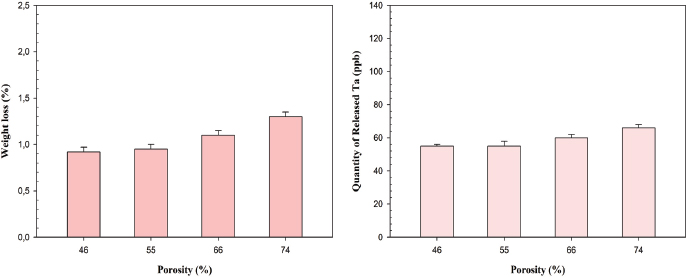
Fig. 12.
Effect of porosity content of the alloy on (a) weight loss and (b) Ta ion release
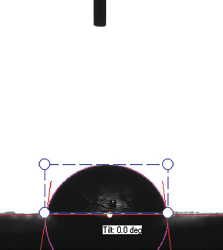
Fig. 13.
Photograph of the water droplet at the surface of the sample
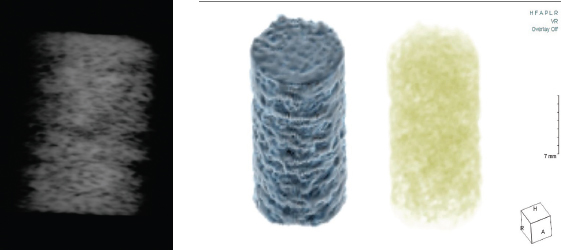
Fig. 14.
(a) Digital radiography result of the sample and (b) computed tomography images of the sample