
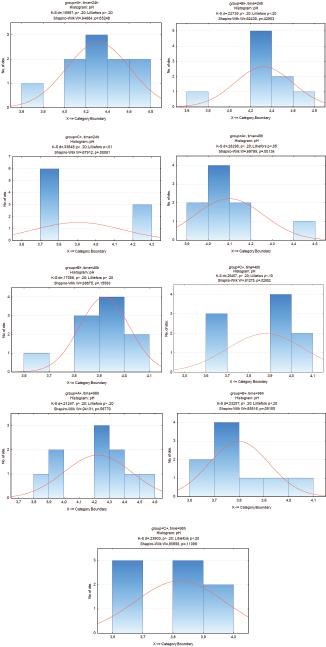
Fig. 1.
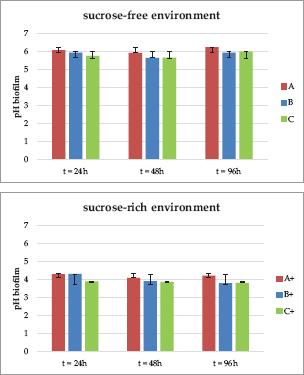
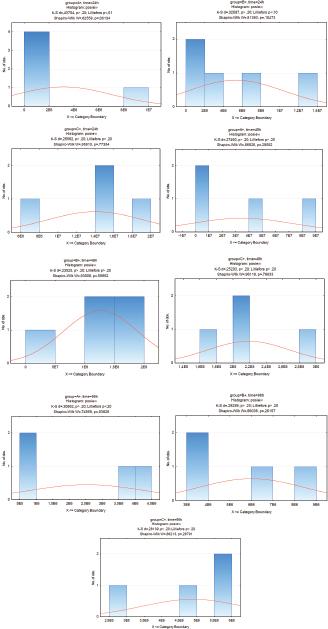
Fig. 2S.
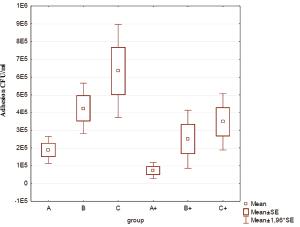
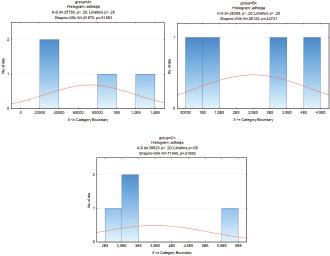
Fig. 3S.
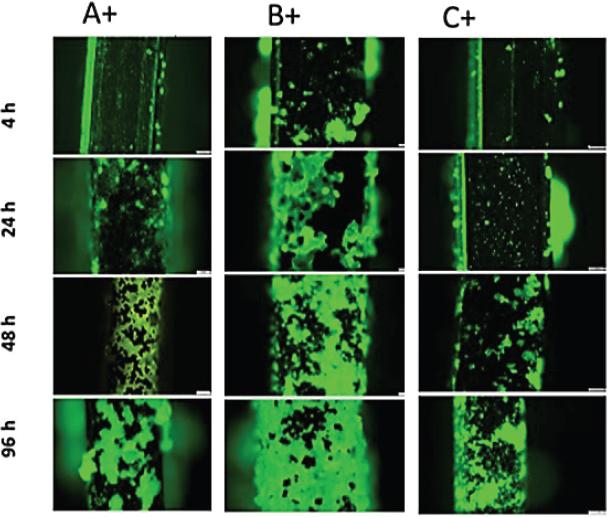
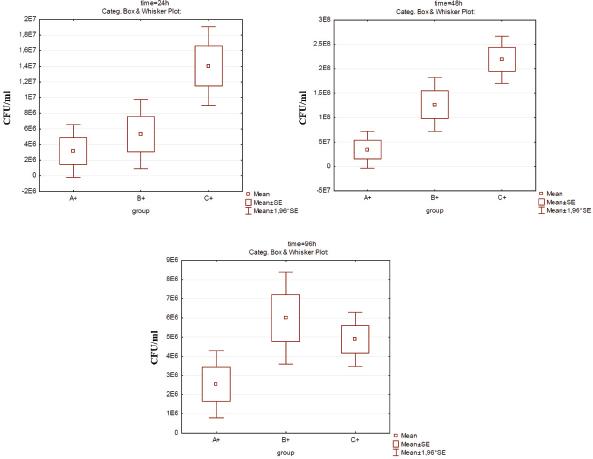
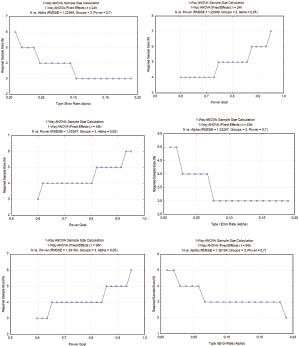
Fig. 4S.
Results of the Newman-Keuls post hoc test for bacterial cultures
| Without sucrose, t = 4 h | |||
| Group | {1} | {2} | {3} |
| A {1} | 0.0590 | 0.0041* | |
| B {2} | 0.0590 | 0.0866 | |
| C {3} | 0.0041 | 0.0866 | |
| With sucrose, t = 4 h | |||
| Group | {1} | {2} | {3} |
| A+ {1} | 0.1012 | 0.0472 | |
| B+ {2} | 0.1012 | 0.3420 | |
| C+ {3} | 0.0472 | 0.3420 | |
Results of the Newman-Keuls post hoc test for bacterial cultures, experiments without sucrose
| t = 48 h | |||
| Group | {1} | {2} | {3} |
| A {1} | 0.0895 | 0.0048* | |
| B {2} | 0.0895 | 0.0529 | |
| C {3} | 0.0048 | 0.0529 | |
| t= 96 h | |||
| Group | {1} | {2} | {3} |
| A {1} | 0.1159 | 0.0488 | |
| B {2} | 0.1159 | 0.0058 | |
| C {3} | 0.0488 | 0.0058 | |
Various categories of orthodontic wires that have undergone surface modifications are utilized in microbiological examinations
| Group A | The experimental group included stainless steel orthodontic archwires coated with a functional thin film of TiO2:Ag. |
| Group B | The experimental group consisted of stainless steel orthodontic archwires with a base coating of a thin TiO2 film. |
| Group C | The control group comprised stainless steel orthodontic archwires without any coating. |
Fundamental descriptive statistics for the examined quantitative variables (experiment with sucrose)
| N | M | Me | SD | Sk. | Kurt | Min. | Maks. | W | p | |
|---|---|---|---|---|---|---|---|---|---|---|
| pH | ||||||||||
| t = 24 h | ||||||||||
| A+ | 10 | 4.31 | 4.27 | 0.30 | −0.38 | 0.78 | 3.72 | 4.75 | 0.95 | 0.652 |
| B+ | 9 | 4.32 | 4.31 | 0.27 | −0.72 | 1.40 | 3.77 | 4.71 | 0.92 | 0.429 |
| C+ | 9 | 3.90 | 3.75 | 0.24 | 0.83 | −1.72 | 3.72 | 4.22 | 0.68 | 0.001 |
| t = 48 h | ||||||||||
| A+ | 9 | 4.10 | 4.03 | 0.16 | 2.34 | 5.88 | 3.98 | 4.50 | 0.68 | 0.001 |
| B+ | 10 | 3.92 | 3.93 | 0.10 | −1.36 | 2.57 | 3.69 | 4.03 | 0.89 | 0.156 |
| C+ | 9 | 3.88 | 3.96 | 0.18 | −0.60 | −1.67 | 3.64 | 4.08 | 0.81 | 0.029 |
| t = 96 h | ||||||||||
| A+ | 10 | 4.22 | 4.27 | 0.22 | −0.55 | −0.37 | 3.82 | 4.55 | 0.94 | 0.568 |
| B+ | 9 | 3.80 | 3.78 | 0.12 | 1.41 | 1.88 | 3.69 | 4.06 | 0.86 | 0.092 |
| C+ | 8 | 3.82 | 3.87 | 0.15 | −0.26 | −1.92 | 3.64 | 4.00 | 0.86 | 0.111 |
| Cultures [CFU/ml] | ||||||||||
| t = 24 h | ||||||||||
| A+ | 5 | 3.16 × 10⁶ | 1.70 × 10⁶ | 3.83 × 10⁶ | 2.20 | 4.87 | 1.1 × 10⁶ | 10 × 106 | 0.63 | 0.001 |
| B+ | 5 | 5.33 × 10⁶ | 2.30 × 10⁶ | 5.05 × 10⁶ | 1.12 | −0.38 | 1.6 × 10⁶ | 13 × 106 | 0.81 | 0.105 |
| C+ | 4 | 1.40 × 10⁷ | 1.45 × 10⁷ | 5.14 × 10⁶ | −0.54 | 1.55 | 7.3 × 10⁶ | 19.8 × 10⁶ | 0.96 | 0.774 |
| t = 48 h | ||||||||||
| A+ | 4 | 3.47 × 10⁷ | 2.41 × 10⁷ | 3.85 × 10⁷ | 0.97 | −0.66 | 4.50 × 10⁶ | 8.60 × 10⁷ | 0.87 | 0.291 |
| B+ | 5 | 1.27 × 10⁸ | 1.49 × 10⁸ | 6.30 × 10⁷ | −1.01 | 1.39 | 2.81 × 10⁷ | 1.96 × 10⁸ | 0.93 | 0.597 |
| C+ | 4 | 2.19 × 10⁸ | 2.15 × 10⁸ | 4.91 × 10⁷ | 0.48 | 1.52 | 1.63 × 10⁸ | 2.83 × 10⁸ | 0.96 | 0.786 |
| t = 96 h | ||||||||||
| A+ | 4 | 2.53 × 10⁶ | 2.50 × 10⁶ | 1.77 × 10⁶ | 0.01 | −5.96 | 1.00 × 10⁶ | 4.15 × 10⁶ | 0.75 | 0.038 |
| B+ | 4 | 6.00 × 10⁶ | 5.50 × 10⁶ | 2.45 × 10⁶ | 0.54 | −2.94 | 4.00 × 10⁶ | 9 × 10⁶ | 0.86 | 0.262 |
| C+ | 4 | 4.89 × 10⁶ | 5.28 × 10⁶ | 1.43 × 10⁶ | −0.91 | −1.00 | 3.00 × 10⁶ | 6 × 10⁶ | 0.86 | 0.268 |
| Adhesion [CFU/ml] | ||||||||||
| t = 4 h | ||||||||||
| A+ | 4 | 7.25 × 10⁴ | 6.50 × 10⁴ | 4.65 × 10⁴ | 0.56 | −2.48 | 3.00 × 10⁴ | 1.30 × 10⁵ | 0.92 | 0.519 |
| B+ | 4 | 2.50 × 10⁵ | 2.35 × 10⁵ | 1.68 × 10⁵ | 0.25 | −4.06 | 9.00 × 10⁴ | 4.40 × 10⁵ | 0.90 | 0.437 |
| C+ | 4 | 3.48 × 10⁵ | 2.75 × 10⁵ | 1.63 × 10⁵ | 1.94 | 3.77 | 2.50 × 10⁵ | 5.90 × 10⁵ | 0.72 | 0.019 |
Results of the Newman-Keuls post hoc test for bacterial cultures, experiments with sucrose
| t = 24 h | |||
| Group | {1} | {2} | {3} |
| A+ {1} | 0,4960 | 0.0121* | |
| B+ {2} | 0.4960 | 0,0166 | |
| C+ {3} | 0.0121 | 0.0166 | |
| t = 48 h | |||
| Group | {1} | {2} | {3} |
| A+ {1} | 0.0282 | 0.0013 | |
| B+ {2} | 0.0282 | 0,0282 | |
| C+ {3} | 0.0013 | 0.0282 | |
| t = 96 h | |||
| Group | {1} | {2} | {3} |
| A+ {1} | 0.0749 | 0.1198 | |
| B+ {2} | 0.0749 | 0.4368 | |
| C+ {3} | 0.1198 | 0.4368 | |
Results of the Newman-Keuls post hoc test for the dependent variable of pH levels; experiment with sucrose
| t = 24h | |||
| Group | {1} | {2} | {3} |
| A+ {1} | 0.9353 | 0.0035* | |
| B+ {2} | 0.9353 | 0.0075 | |
| C+ {3} | 0.0035 | 0.0075 | |
| t = 48 h | |||
| Group | {1} | {2} | {3} |
| A+ {1} | 0.0176 | 0.0117 | |
| B+ {2} | 0.0176 | 0.5602 | |
| C+ {3} | 0.0117 | 0.5602 | |
| t = 96 h | |||
| Group | {1} | {2} | {3} |
| A+ {1} | 0.0002 | 0.0002 | |
| B+ {2} | 0.0002 | 0.7863 | |
| C+ {3} | 0.0002 | 0.7863 | |
Results of the Newman-Keuls post hoc test for the dependent variable of pH levels; experiment without sucrose
| t = 24 h | |||
| Group | {1} | {2} | {3} |
| A {1} | 0.0678 | 0.0007* | |
| B {2} | 0.0678 | 0.0236 | |
| C {3} | 0.0007 | 0.0236 | |
| t= 48 h | |||
| Group | {1} | {2} | {3} |
| A {1} | 0.0067 | 0.0035 | |
| B {2} | 0.0067 | 0.8958 | |
| C {3} | 0.0035 | 0.8958 | |
| t= 96 h | |||
| Group | {1} | {2} | {3} |
| A {1} | 0.0058 | 0.0084 | |
| B {2} | 0.0058 | 0.5474 | |
| C {3} | 0.0084 | 0.5474 | |