
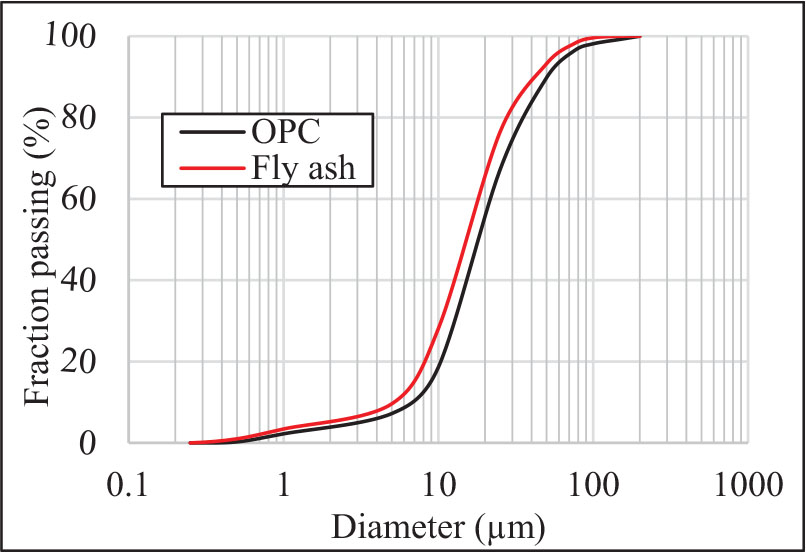
Fig. 1.
Particle size distribution of OPC and FA used in the model
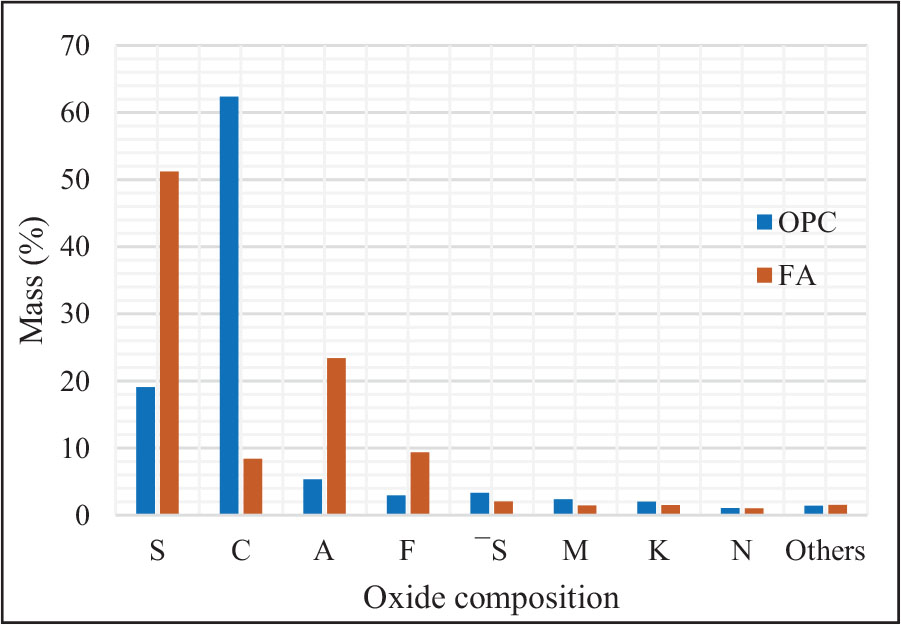
Fig. 2.
Oxide composition of OPC and FA used in the model (mass%)
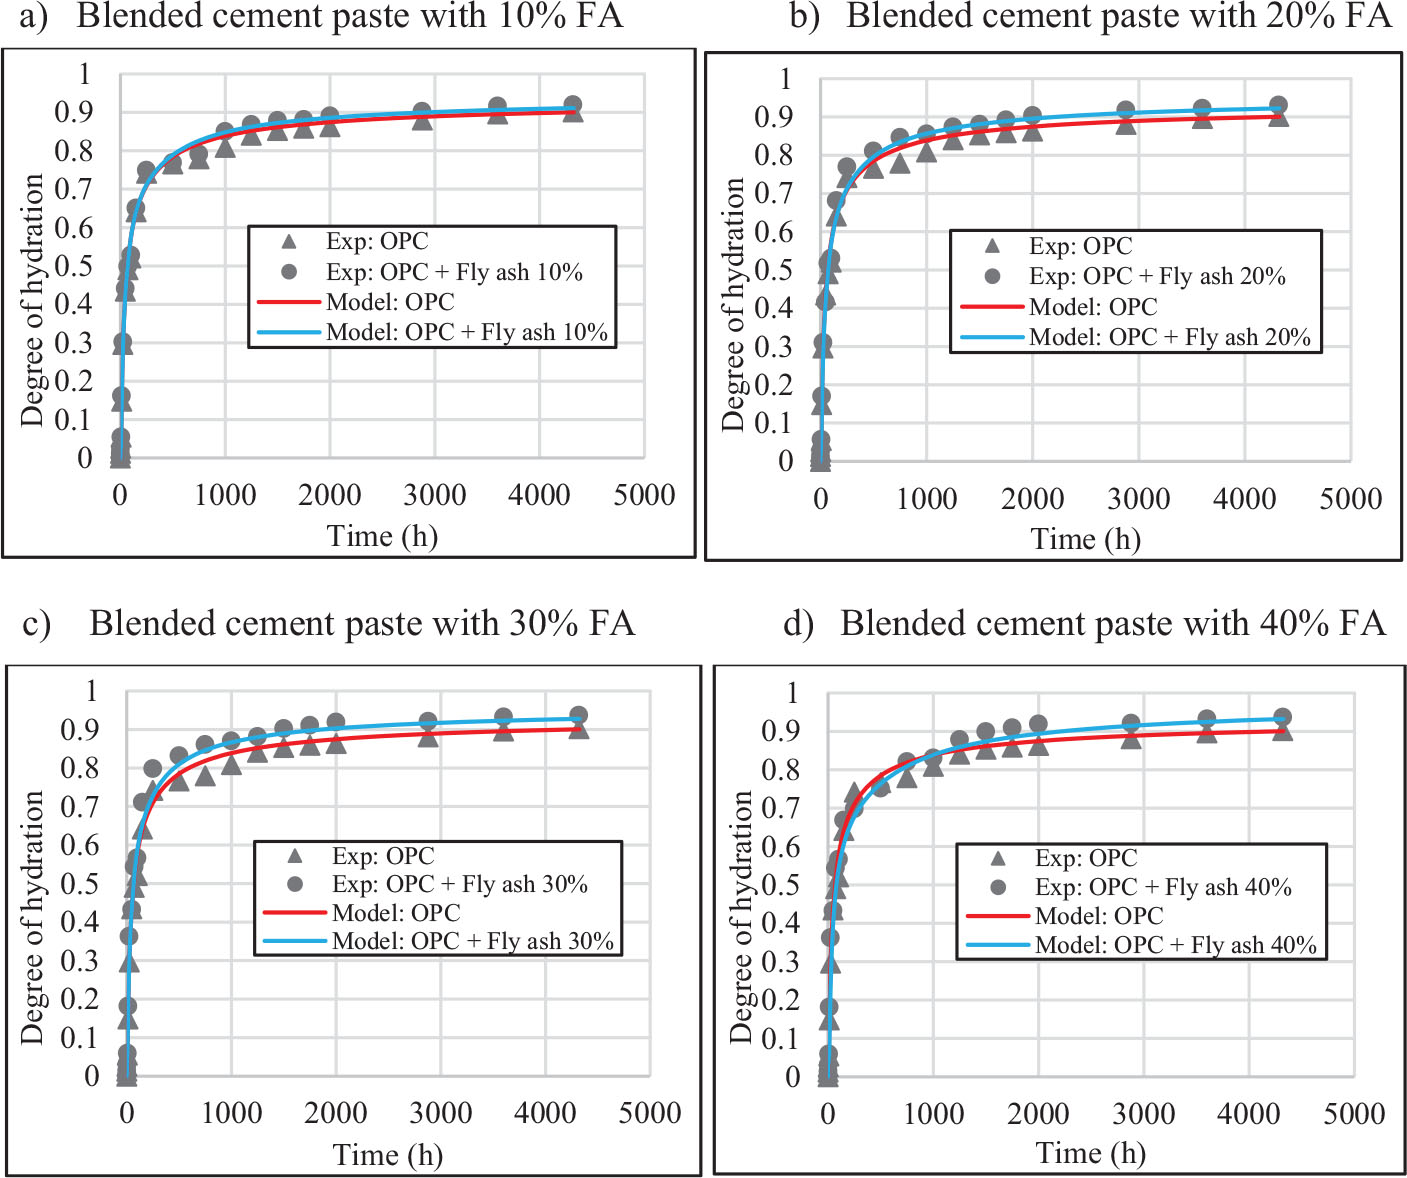
Fig. 3.
Simulated degree of hydration in blended cement with 10%, 20%, 30%, and 40% FA substitution for w/c = 0.45
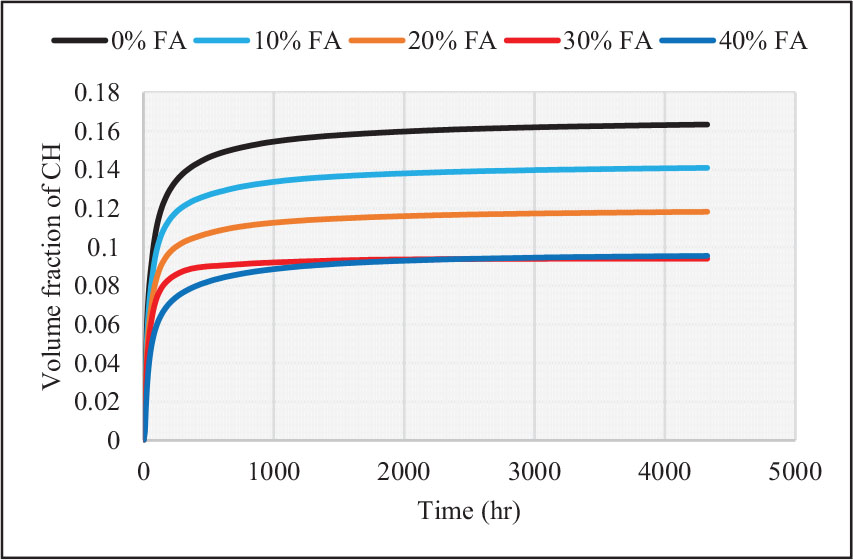
Fig. 4.
Comparison of CH formation in FA-modified cement paste
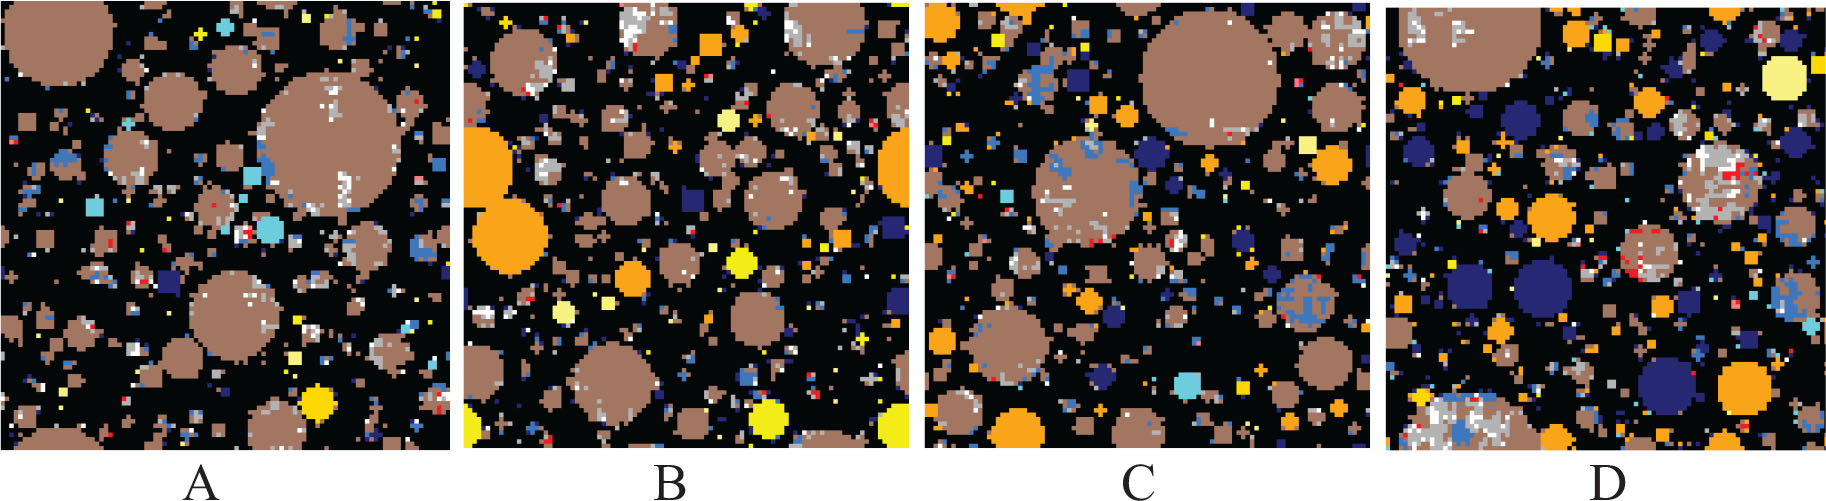
Fig. 5.
Simulated microstructure of FA-blended cement pastes from the CEMHYD3D model with various FA substitutions. The image is 256μm × 200μm
Table 1.
Pore size distribution of FA-blended cement paste at the age of 180 days
| FA Replacement (%) | Pore Size < 10 nm (%) | Pore Size 10–100 nm (%) | Pore Size > 100 nm (%) |
|---|---|---|---|
| 0 | 12.50 | 56.50 | 31.00 |
| 10 | 11.10 | 55.30 | 33.60 |
| 20 | 10.20 | 54.90 | 34.90 |
| 30 | 9.30 | 54.20 | 36.50 |
| 40 | 8.40 | 53.40 | 38.20 |
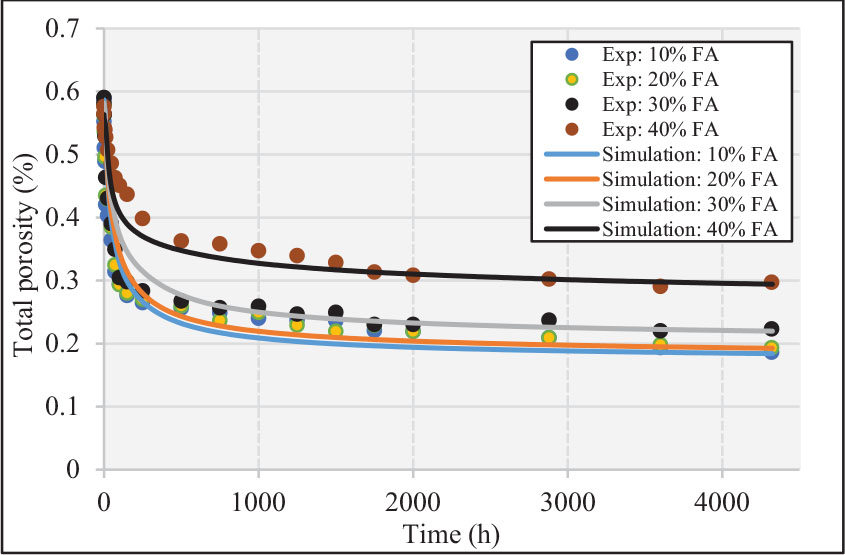
Fig. 6.
Model-predicted effect of FA on pore structure of cement paste at the age of 180 days