
Table 1.
The tested root canal sealers: composition, manufacturers and setting time (according the manufacturer description)
| Sealer | Composition | Setting time (min) | Manufacturer |
|---|---|---|---|
| CERASEAL | Calcium silicates, zirconium oxide, thickening agent | 210 | Meta Biomed Co., Cheongju, Korea |
| MTA Fillapex | Base paste: Salicylate resin, natural resin, calcium tungstate, nanoparticulated silica, pigments Catalyst paste: Diluting resin, tricalcium silicate, di-calcium silicate, calcium oxide, tricalcium aluminate, nanoparticulated silica, pigments. | 130 | Angelus Dental Solutions, Londrina, PR, Brazil |
| SEALAPEX | Base paste: sulphonamide resin, N-ethyl toluene, silicon dioxide, zinc oxide, calcium oxide; Catalyst paste: isobutyl salicylate resin, silicon dioxide, bismuth trioxide, titanium dioxide, pigments | 1400 | SybronEndo - Sybron Dental Specialties, Glendona, CA, USA |
| AH Plus | Paste A: bisphenol A epoxy resin, bisphenol F epoxy resin, calcium tungstate, zirconium oxide, silica, iron oxide pigments; Paste B: dibenzylamine, aminoadamantane, tricyclodecane-diamide, calcium tungstate, zirconium oxide, silica, silicone oil | 480 | Dentsply Sirona, York, PA, USA |
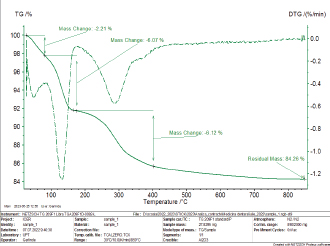
Fig. 1.
TGA and DTG thermograms of CERASEAL root sealer
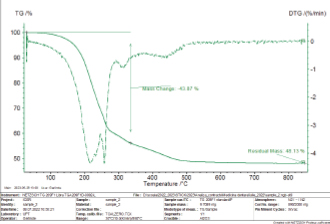
Fig. 2.
TGA and DTG thermograms of MTA FILLAPEX
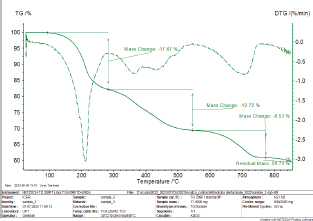
Fig. 3.
TGA and DTG thermograms of SEALAPEX root canal sealer
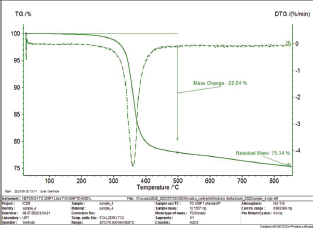
Fig. 4.
TGA and DTG thermograms of AH PLUS root canal sealer
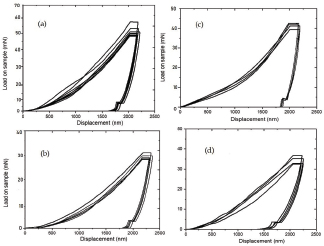
Fig. 5.
Load-displacement curves recorded on the surface of the specimens: a) CERASEAL; b) MTA FILLAPEX; c) SEALAPEX and d) AH PLUS
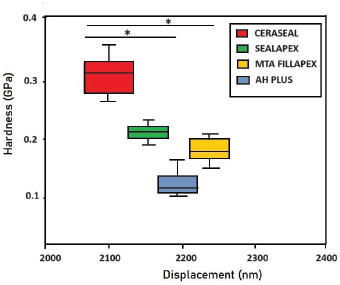
Fig. 6.
Box plot graphical representation of hardness values obtained from nanoindentation tests as a function of contact depth for each specimen (*p values < 0.01)
Table 2.
Measurement of pH, Ca2+ and PO43− ions in SBF solution, at different time point
| Sample | 1 day | 7 days | 14 days | 21 days | 28 days |
|---|---|---|---|---|---|
| pH | |||||
| CERASEAL | 10.2 ± 0.9a | 11.7 ± 0.9a | 9.7 ± 0.1a | 9.2 ± 0.2a | 8.7 ± 0.5a |
| MTA FILLAPEX | 9.2 ± 0.1b | 9.8 ± 0.2b | 8.9 ± 0.1b | 8.2 ± 0.2b | 8.2 ± 0.2a |
| AH PLUS | 7.4 ± 0.2c | 7.9 ± 0.2c | 7.2 ± 0.3c | 7.2 ± 0.3c | 7.0 ± 0.2b |
| SEALAPEX | 8.2 ± 0.2d | 8.4 ± 0.2d | 8.4 ± 0.1b | 8.2 ± 0.1b | 8.4 ± 0.1a |
| Ca2+ (mg/L) | |||||
| CERASEAL | 180.2 ± 20.2a | 90.7 ± 10.5a | 80.5 ± 10.2a | 51.7 ± 10.1a | 31.4 ± 3.9a |
| MTA FILLAPEX | 90.4 ± 10.5b | 130.5 ± 11.6b | 110.8 ± 10.9b | 60.5 ± 7.5b | 42.2 ± 5.5b |
| AH PLUS | 110.2 ± 15.5c | 92.5 ± 10.2a | 88.7 ± 9.2c | 90.3 ± 9.8c | 90.7 ± 10.2c |
| SEALAPEX | 97.5 ± 10.0d | 105.5 ± 11.5b | 98.2 ± 10.2d | 96.1 ± 10.5d | 94.2 ± 10.8d |
| PO4 3− (mg/L) | |||||
| CERASEAL | 48.3 ± 5.0a | 37.2 ± 4.0a | 25.1 ± 2.0a | 19.2 ± 1.5a | 15.5 ± 2.0a |
| MTA FILLAPEX | 42.8 ± 5.0b | 30.5 ± 3.5b | 22.1 ± 2.0b | 16.8 ± 2.0b | 14.0 ± 2.0a |
| AH PLUS | 40.5 ± 5.0c | 39.2 ± 4.0c | 32.9 ± 3.0c | 30.5 ± 3.5c | 29.2 ± 3.0b |
| SEALAPEX | 42.1 ± 5.0b | 38.5 ± 4.0c | 35.0 ± 3.0d | 34.0 ± 4.0d | 35.0 ± 3.0c |
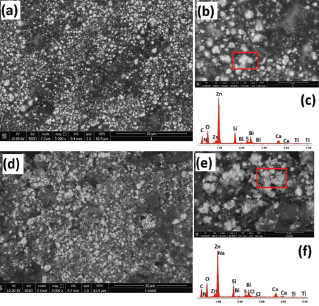
Fig. 7.
SEM micrograph recorded on the surface of SEALAPEX sample before (a–c) and after immersion in SBF (d–f) along with the EDX spectrum
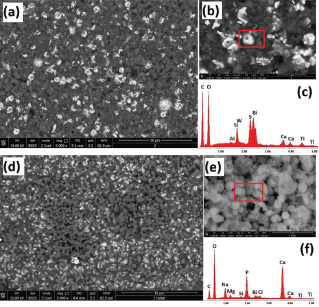
Fig. 8.
SEM micrograph recorded on the surface of MTA FILLAPEX sample before (a–c) and after immersion in SBF (d–f) along with the EDX spectrum
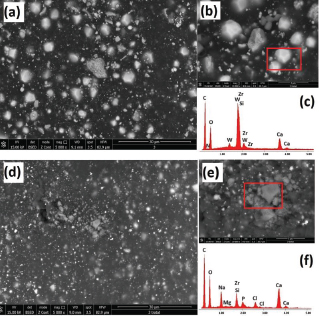
Fig. 9.
SEM micrograph recorded on the surface of AH PLUS sample before (a–c) and after immersion in SBF (d–f) along with the EDX spectrum
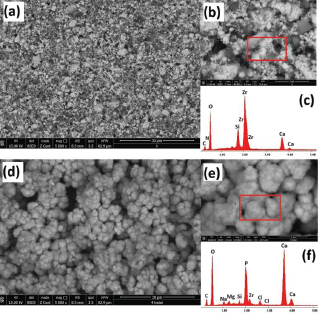
Fig. 10.
SEM micrograph recorded on the surface of CERASEAL sample before (a–c) and after immersion in SBF (d–f) along with the EDX spectrum