
Fig. 1.
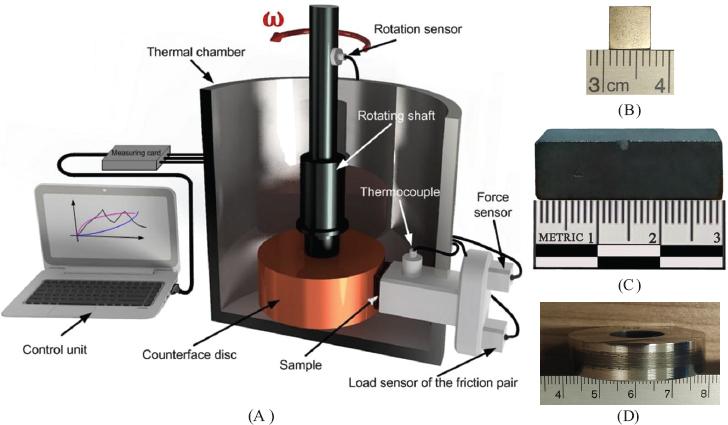
Fig. 2.
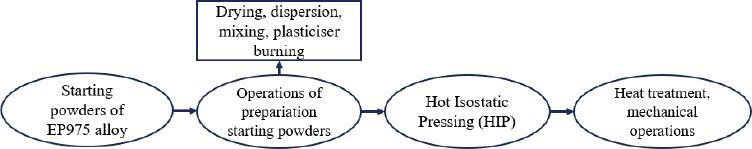
Fig. 3.
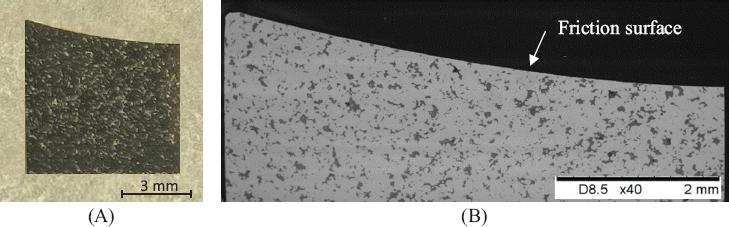
Fig. 4.
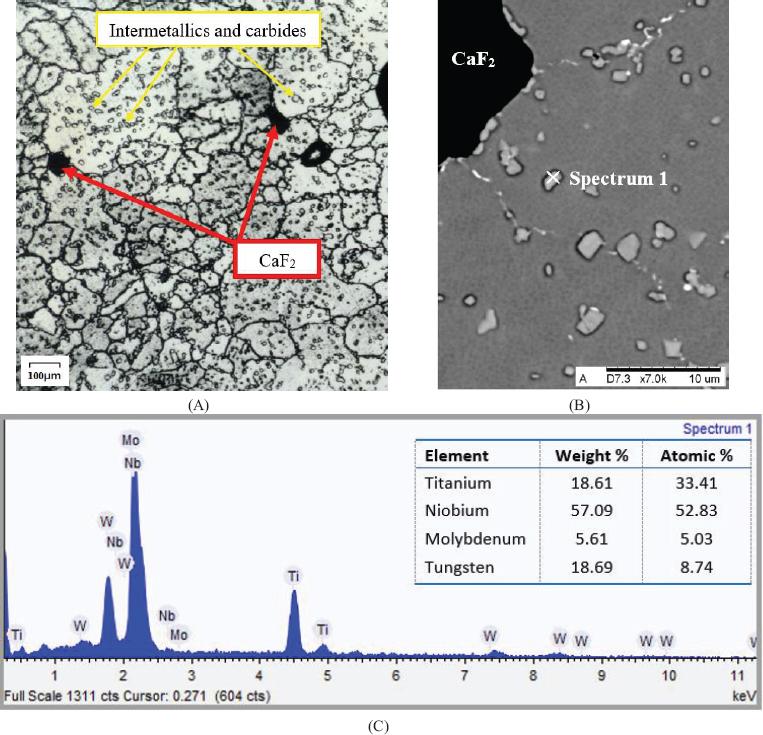
Fig. 5.
Fig. 6.
Fig. 7.
Fig. 8.
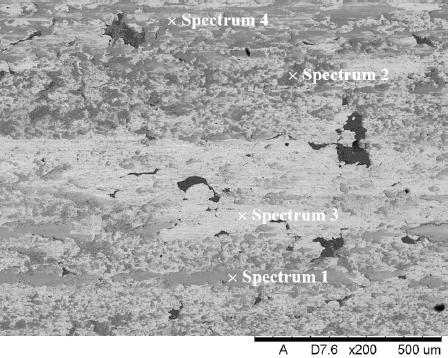
Fig. 9.
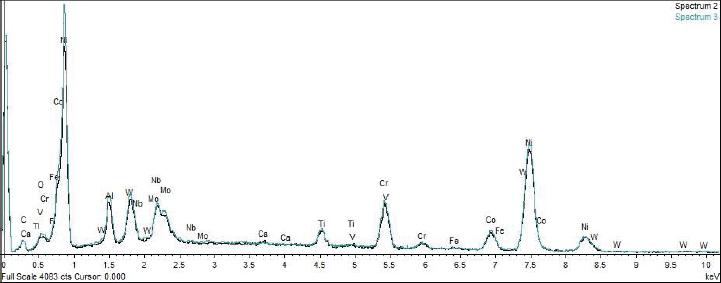
Fig. 10.
Fig. 11.
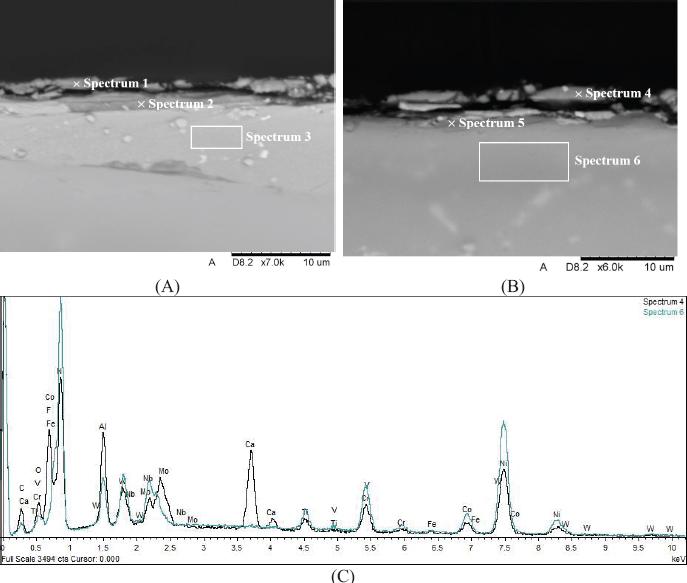
Fig. 12.
Fig. 13.
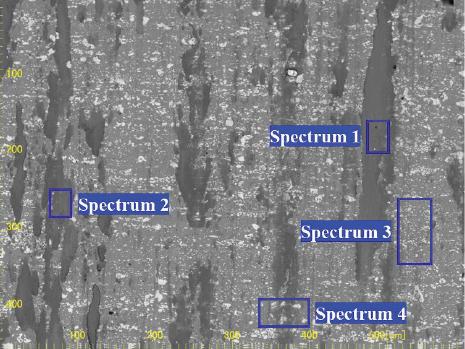
Fig. 14.
Results of the EDS analysis in selected areas (marked in Fig_ 11) of the cross-section of the friction layer
| Analysis point | Element, wt% | |||||||||||
|---|---|---|---|---|---|---|---|---|---|---|---|---|
| O | F | Al | Ca | Ti | Cr | Fe | Co | Ni | Nb | Mo | W | |
| Spectrum 1 | 16.64 | 4.68 | 3.49 | 2.12 | 0.99 | 4.97 | 14.68 | 6.14 | 35.96 | 0.94 | 2.38 | 7.01 |
| Spectrum 2 | 14.38 | 3.71 | 3.07 | 1.96 | 1.15 | 5.62 | 16.49 | 7.04 | 38.44 | 0.49 | 1.59 | 6.06 |
| Spectrum 3 | 0.11 | 1.04 | 3.99 | 0.07 | 1.64 | 8.32 | 0.18 | 11.16 | 61.11 | 0.86 | 2.48 | 9.04 |
| Spectrum 4 | 16.74 | 4.91 | 3.73 | 1.98 | 1.03 | 5.11 | 13.67 | 7.08 | 36.93 | 0.49 | 1.62 | 6.71 |
| Spectrum 5 | 14.91 | 5.79 | 3.29 | 2.17 | 1.11 | 5.56 | 14.14 | 6.73 | 37.60 | 0.71 | 1.67 | 6.32 |
| Spectrum 6 | 0.09 | 1.58 | 4.77 | 0.09 | 2.01 | 8.06 | 0.10 | 10.43 | 57.31 | 1.94 | 3.01 | 10.61 |
EDS results of the wear track in selected areas on composite’s friction surface
| Analysis point | Element, wt% | |||||||||||
|---|---|---|---|---|---|---|---|---|---|---|---|---|
| O | F | Al | Ca | Ti | Cr | Fe | Co | Ni | Nb | Mo | W | |
| Spectrum 1 | 17.24 | 4.81 | 3.21 | 1.94 | 1.01 | 5.00 | 14.1 | 5.84 | 36.86 | 0.78 | 2.22 | 6.99 |
| Spectrum 2 | 16.45 | 26.45 | 0.85 | 16.87 | 0.21 | 1.24 | 8.48 | 1.31 | 25.21 | 0.37 | 0.97 | 1.68 |
| Spectrum 3 | 9.12 | 0.99 | 4.12 | 0.07 | 1.71 | 8.04 | 0.24 | 10.41 | 52.01 | 1.24 | 2.51 | 9.54 |
| Spectrum 4 | 16.04 | 4.51 | 3.02 | 2.01 | 1.04 | 5.54 | 13.46 | 6.23 | 38.02 | 0.65 | 2.45 | 7.03 |
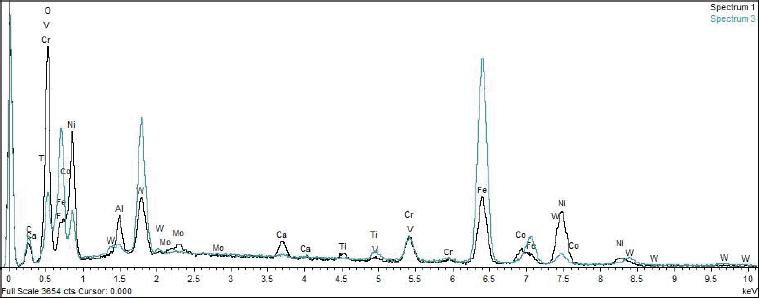
Results of the EDS analysis of the chemical composition in selected areas (marked in Fig_ 13) of the friction surface of the EI961Sh counter-sample after the abrasion test of the EP975 + 6%CaF2 composite_ Friction conditions: P = 3_0 MPa and v = 0_5 m/s
| Analysis point | Element, wt% | ||||||||||||
|---|---|---|---|---|---|---|---|---|---|---|---|---|---|
| O | F | Al | Ca | Ti | Cr | Fe | Co | Ni | Nb | Mo | W | V | |
| Sp. 1 | 19.23 | 3.99 | 2.39 | 4.21 | 0.79 | 5.54 | 21.95 | 4.84 | 26.79 | 0.15 | 2.59 | 7.09 | 0.44 |
| Sp. 2 | 18.02 | 3.53 | 2.3 | 4.02 | 0.65 | 5.62 | 25.86 | 4.89 | 23.55 | 0.12 | 2.56 | 8.54 | 0.34 |
| Sp. 3 | 12.31 | 1.84 | 0.44 | 0.42 | 0.14 | 6.51 | 61.16 | 1.56 | 7.26 | 0.11 | 0.65 | 6.58 | 1.02 |
| Sp. 4 | 15.07 | 2.87 | 1.08 | 0.98 | 0.26 | 4.11 | 50.66 | 1.89 | 14.92 | 0.12 | 1.02 | 6.66 | 0.36 |
Chemical composition of the material based on nickel alloy EP975
| Components, wt% | |||||||||
|---|---|---|---|---|---|---|---|---|---|
| C | W | Cr | Mo | Ti | Al | Nb | Co | Ni | CaF2 |
| 0.038–0.076 | 8.65–9.31 | 7.6–9.5 | 2.28–3.04 | 1.71–2.09 | 4.75–5.13 | 1.71–2.59 | 9.5–11.4 | basis | 4.0–8.0 |