
Table 1.
Chemical compositions of MMT (wt.%)
| Composition | SiO2 | Al2O3 | MgO | Na2O | CaO | Fe2O3 | TiO2 | F | K2O | P2O5 | other |
|---|---|---|---|---|---|---|---|---|---|---|---|
| MMT | 51.62 | 12.24 | 3.13 | 9.80 | 2.01 | 1.60 | 0.13 | 0.28 | 0.04 | 18.78 | 0.37 |
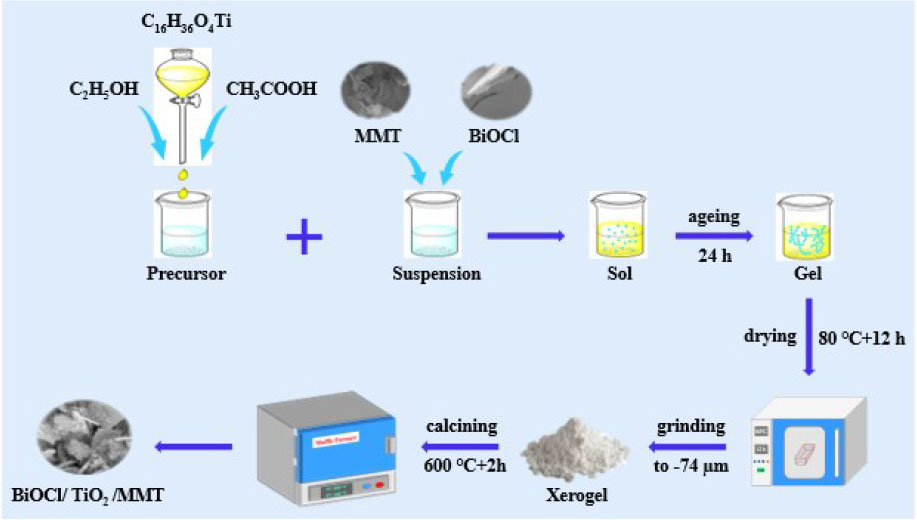
Fig. 1.
The schematic illustration of the synthesis process of BTMC composite materials
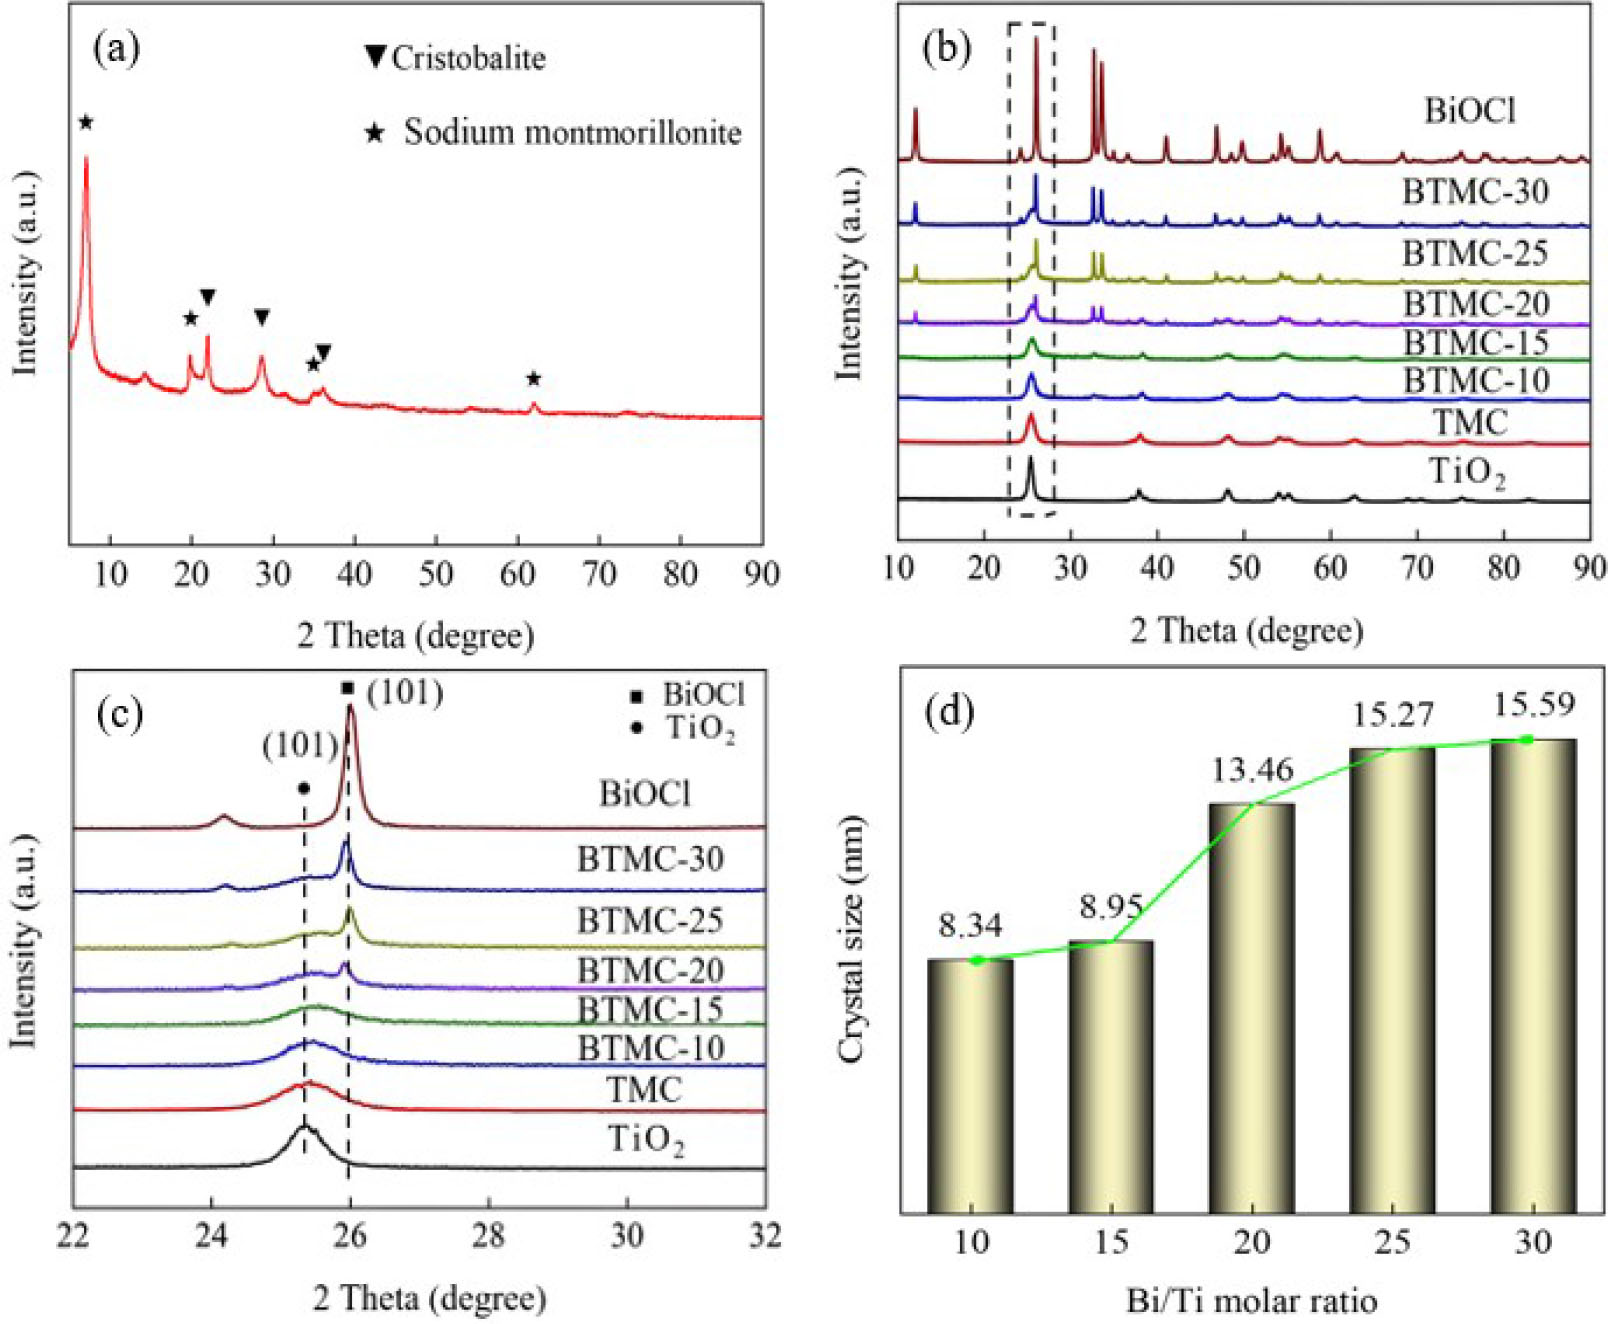
Fig. 2.
The XRD patterns of samples (a–c) and the crystal size of BTMC composite materials (d)
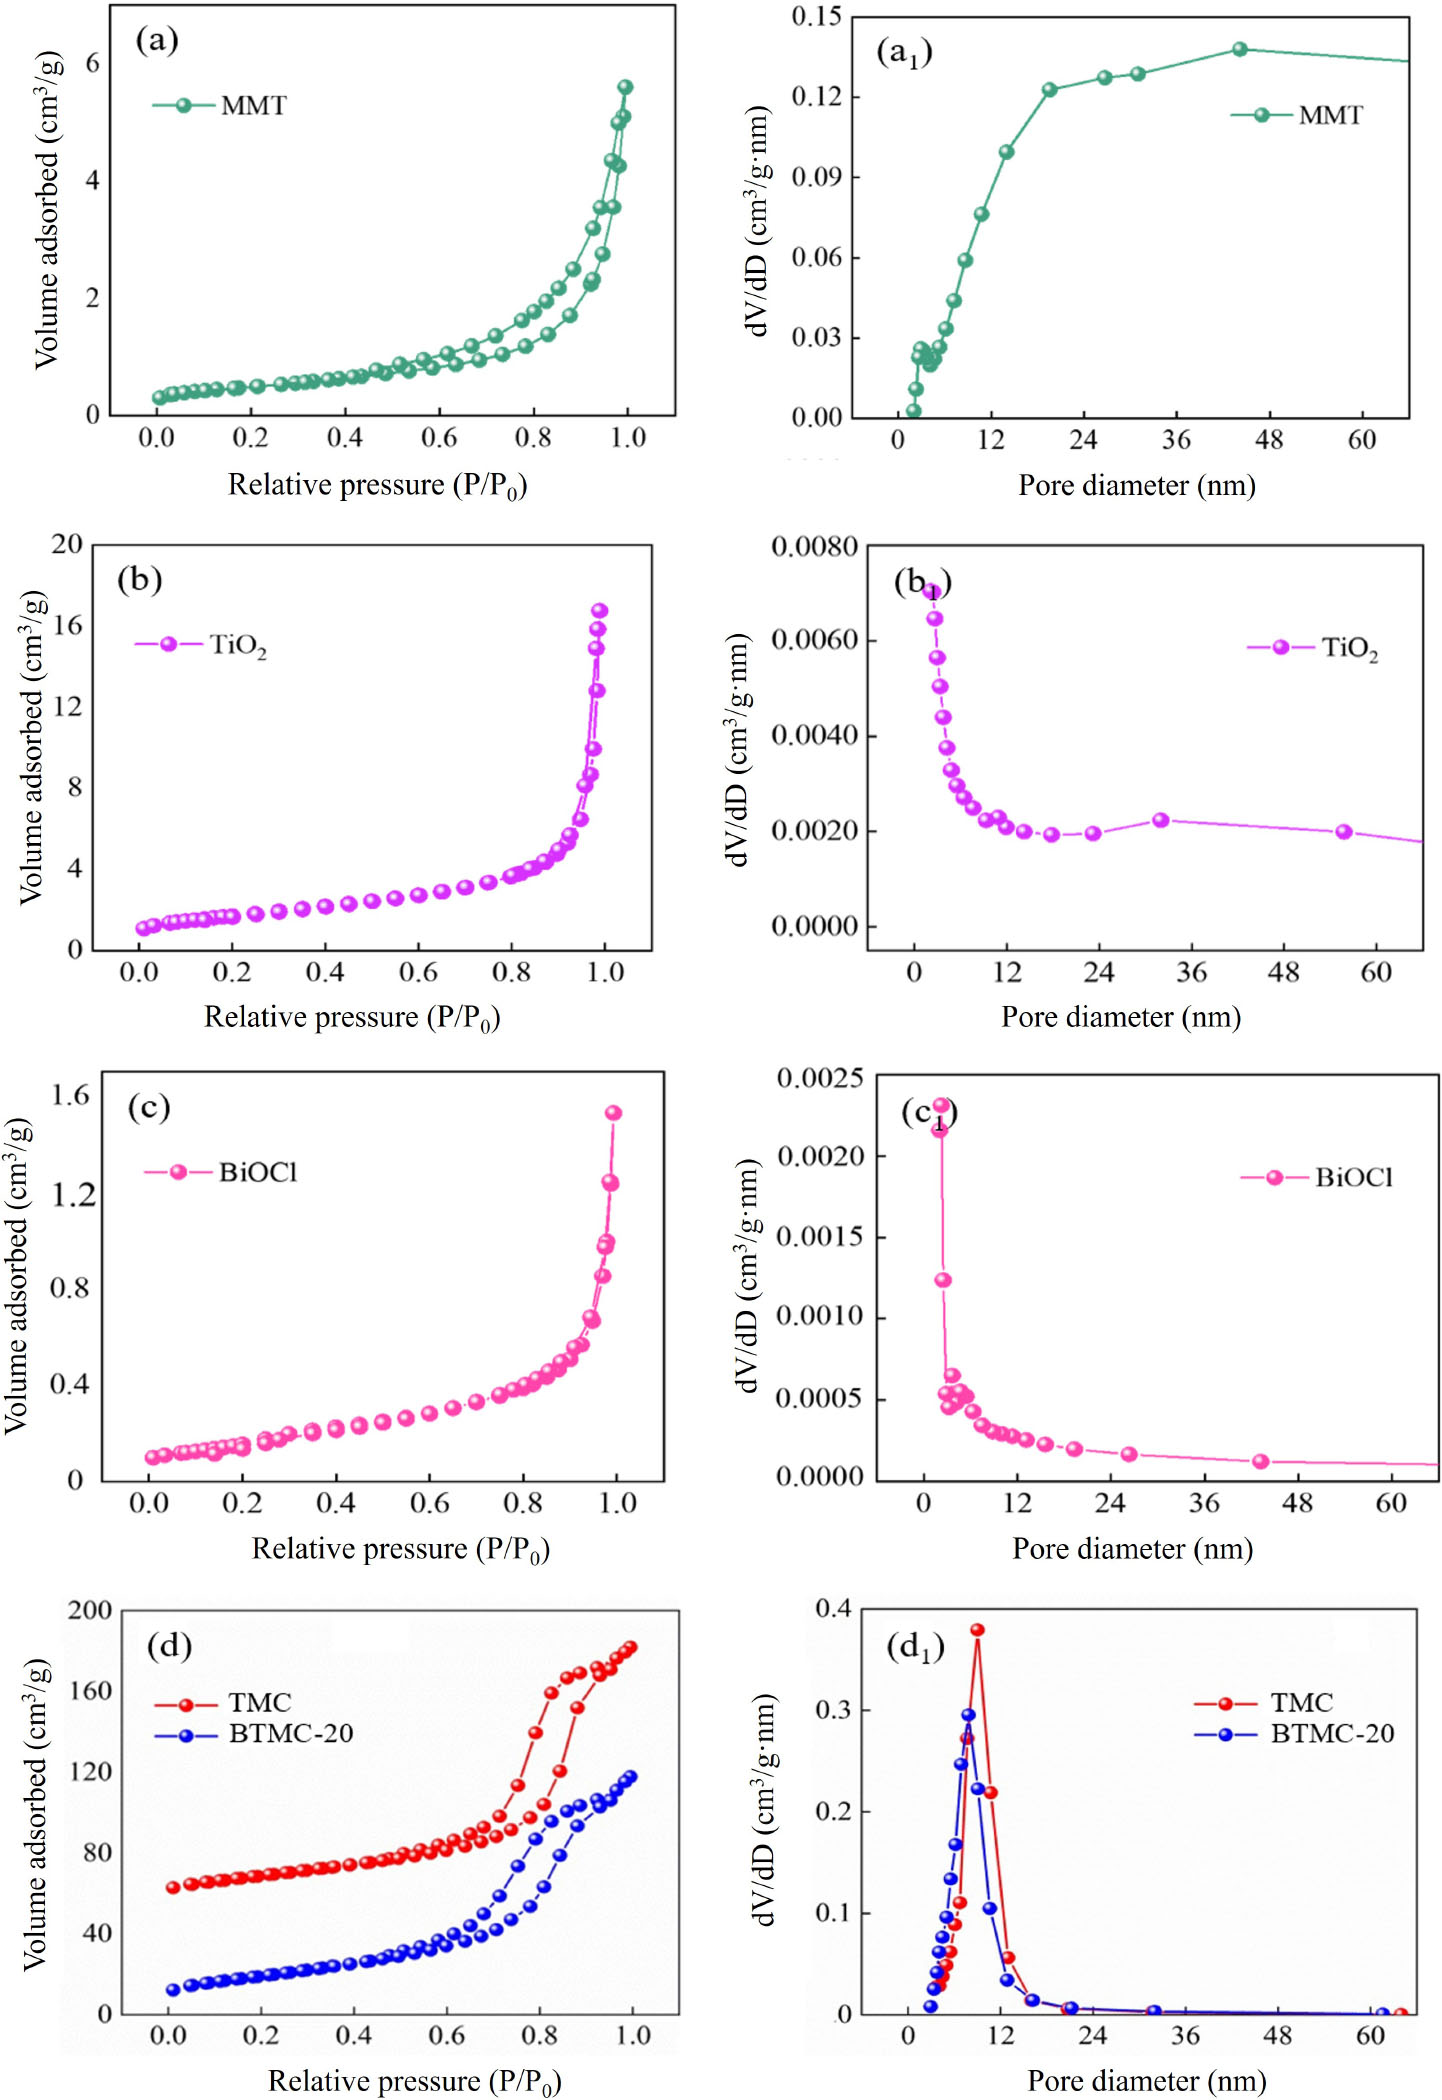
Fig. 3.
The nitrogen adsorption-desorption isotherms and pore size distribution curves of five samples
Table 2.
BET test data of materials
| Materials | Specific surface area (m2/g) | Mean aperture (nm) |
|---|---|---|
| MMT | 39.20 | 19.84 |
| TiO2 | 6.09 | 18.43 |
| BiOCl | 0.59 | 14.01 |
| TMC | 97.46 | 11.05 |
| BTMC-20 | 109.02 | 9.52 |
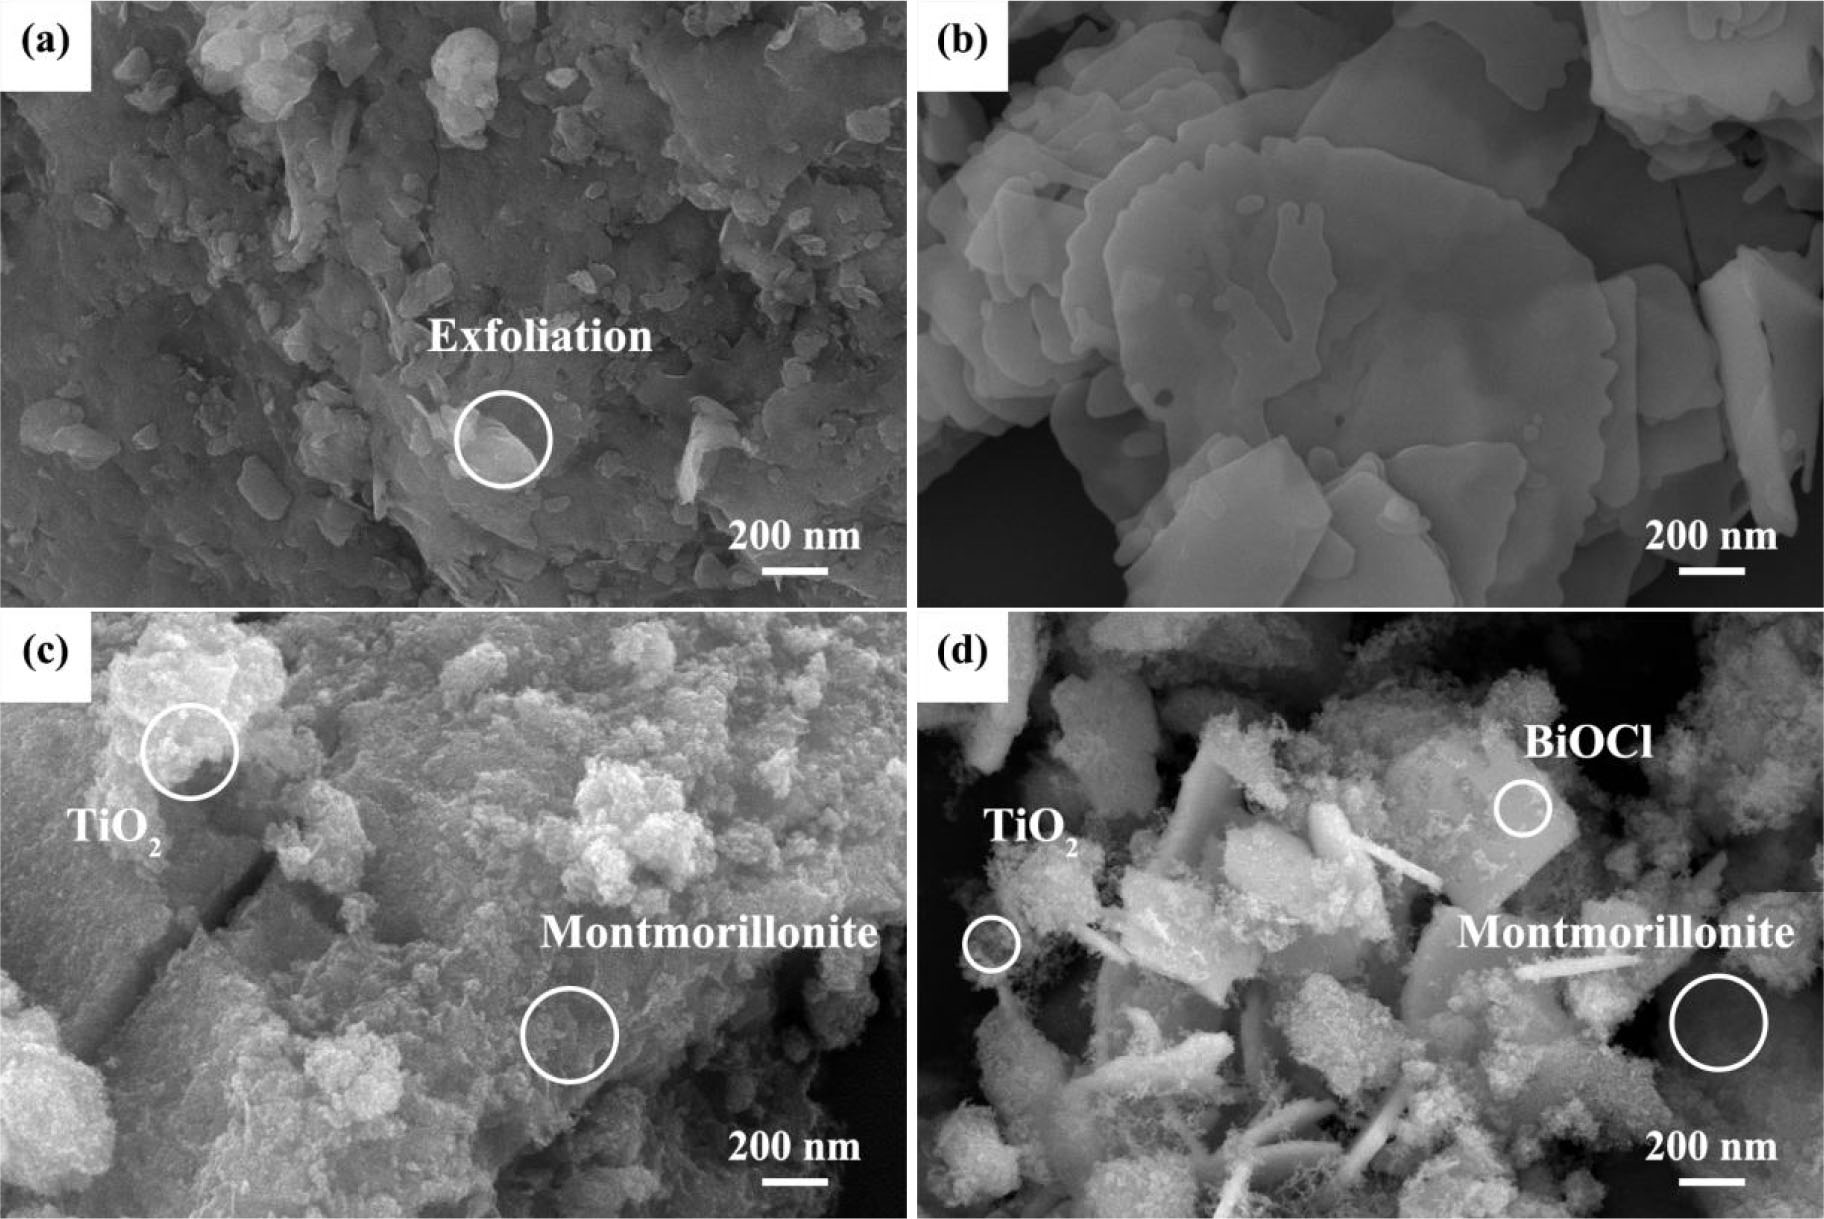
Fig. 4.
The SEM images of MMT (a), BiOCl (b), TMC (c), BTMC-20 (d)
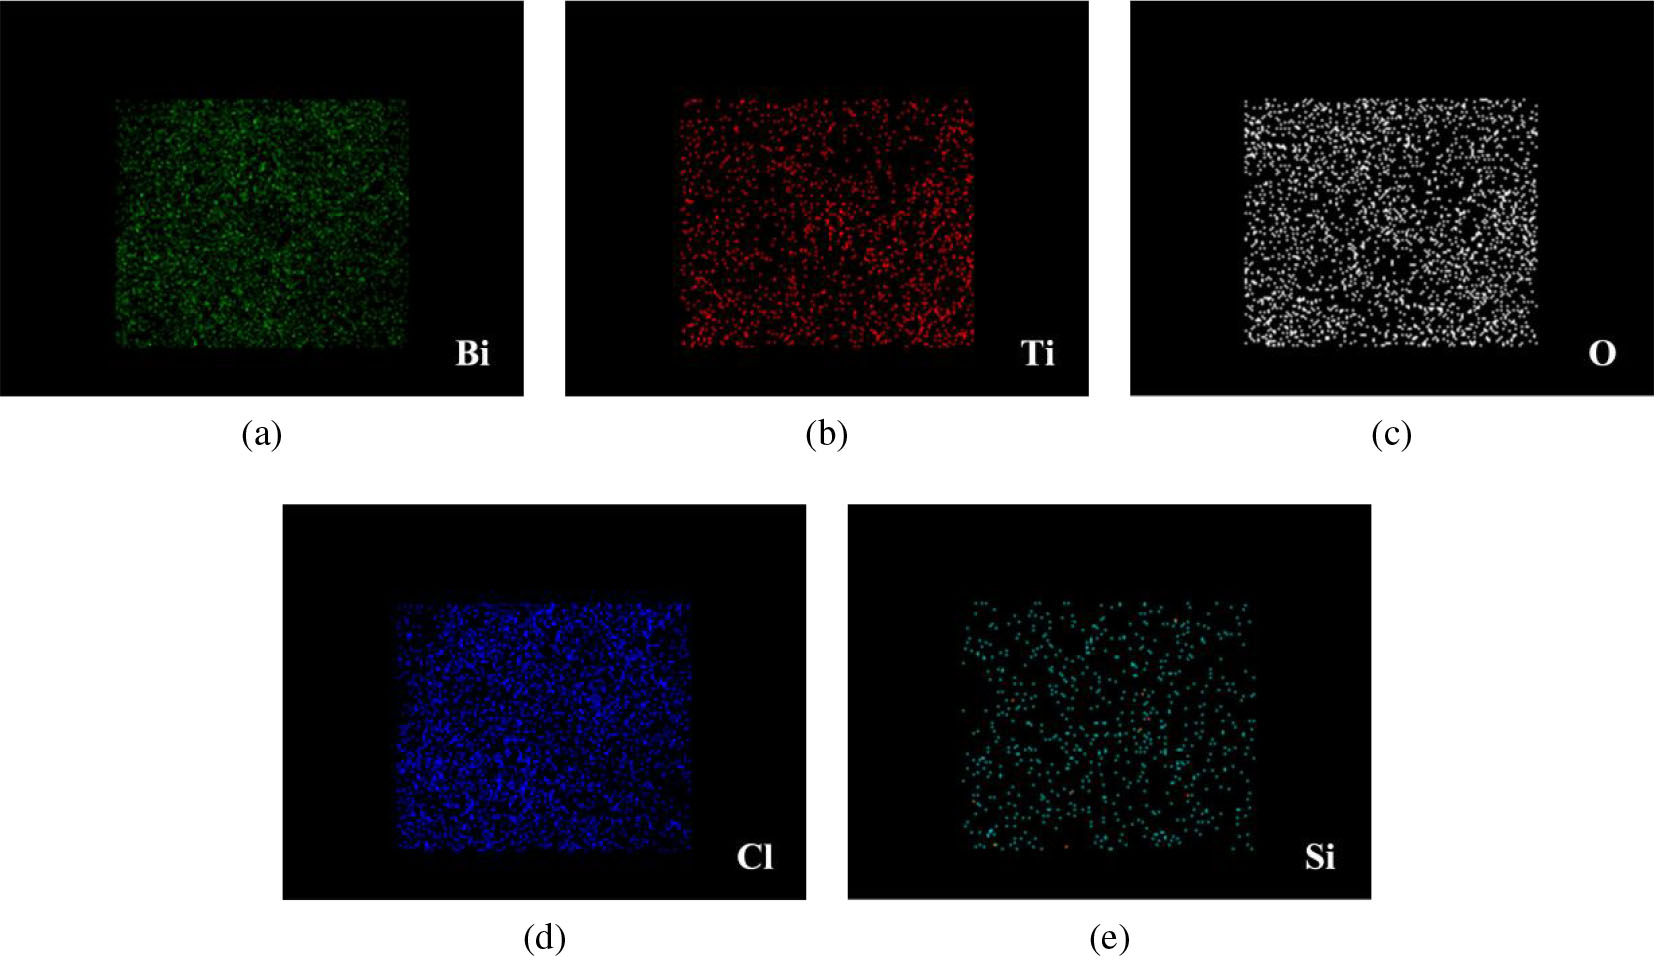
Fig. 5.
The EDX mapping image of BTMC-20
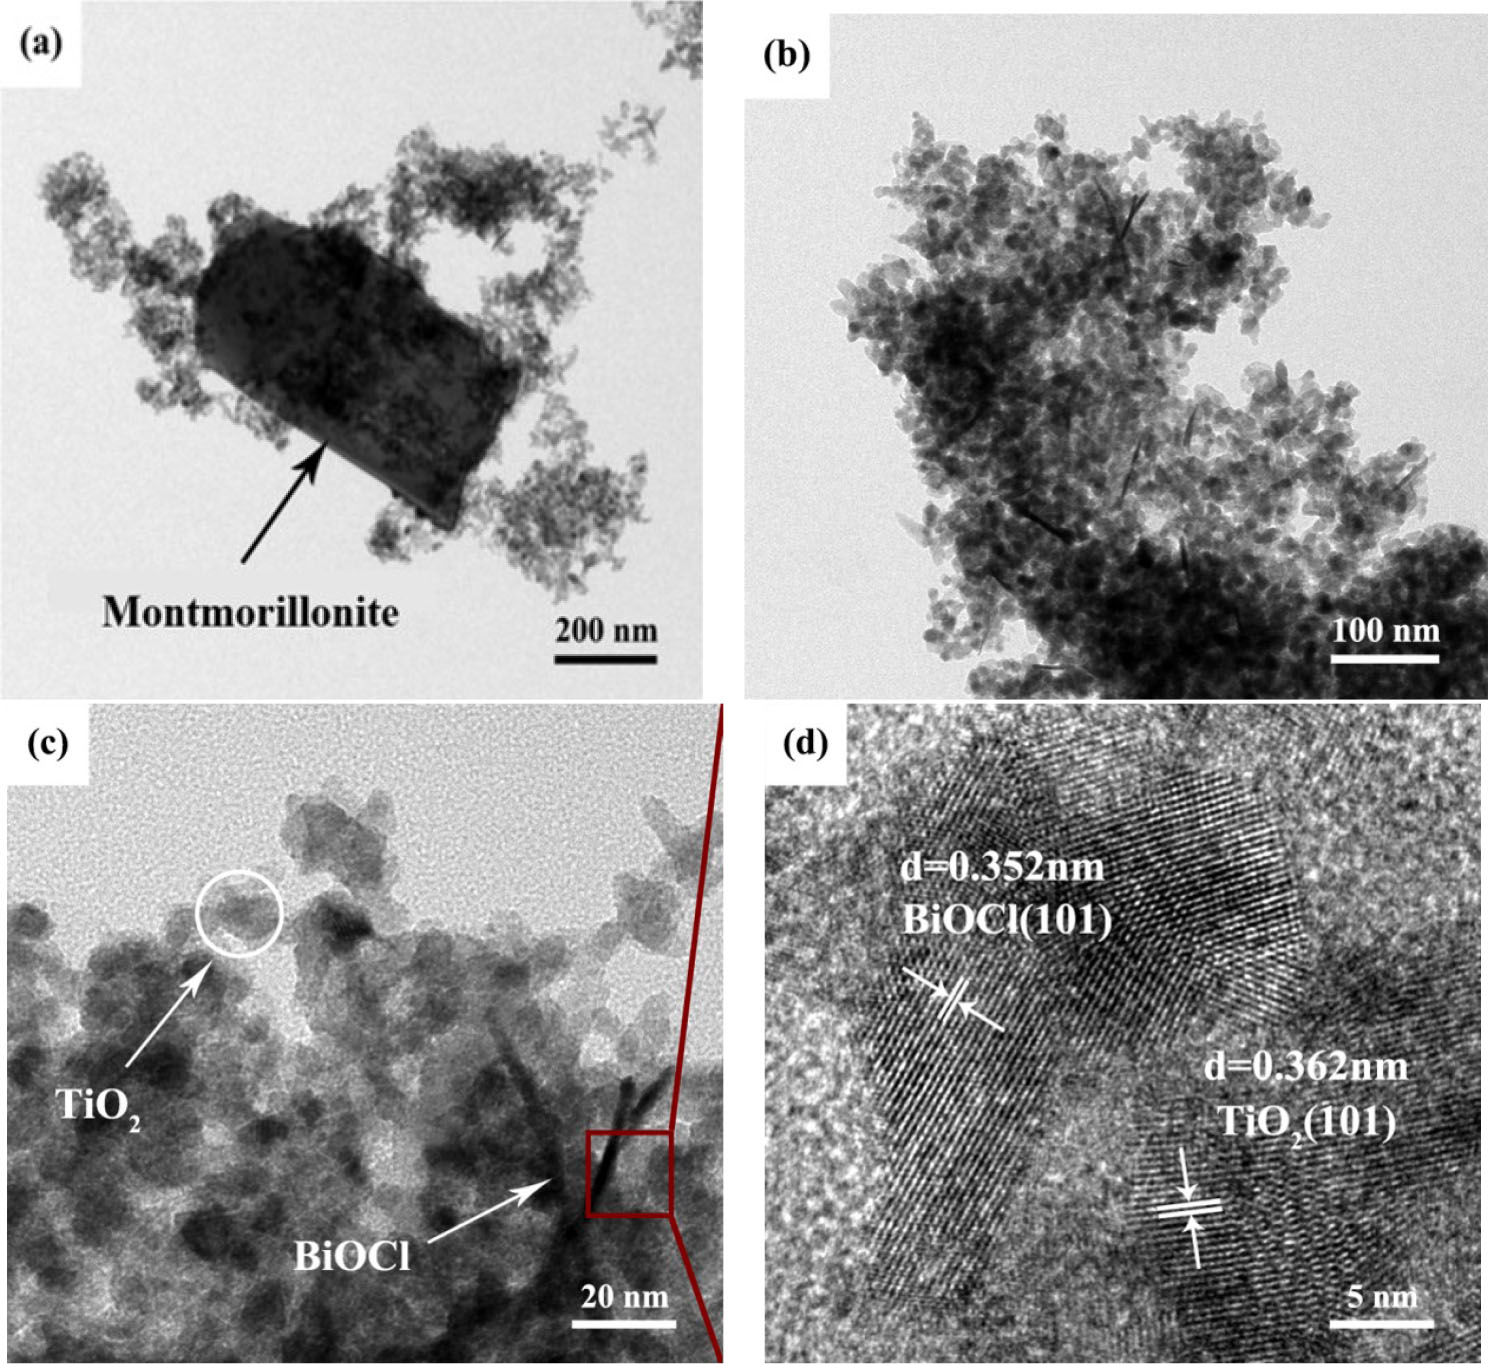
Fig. 6.
The TEM images of BTMC-20
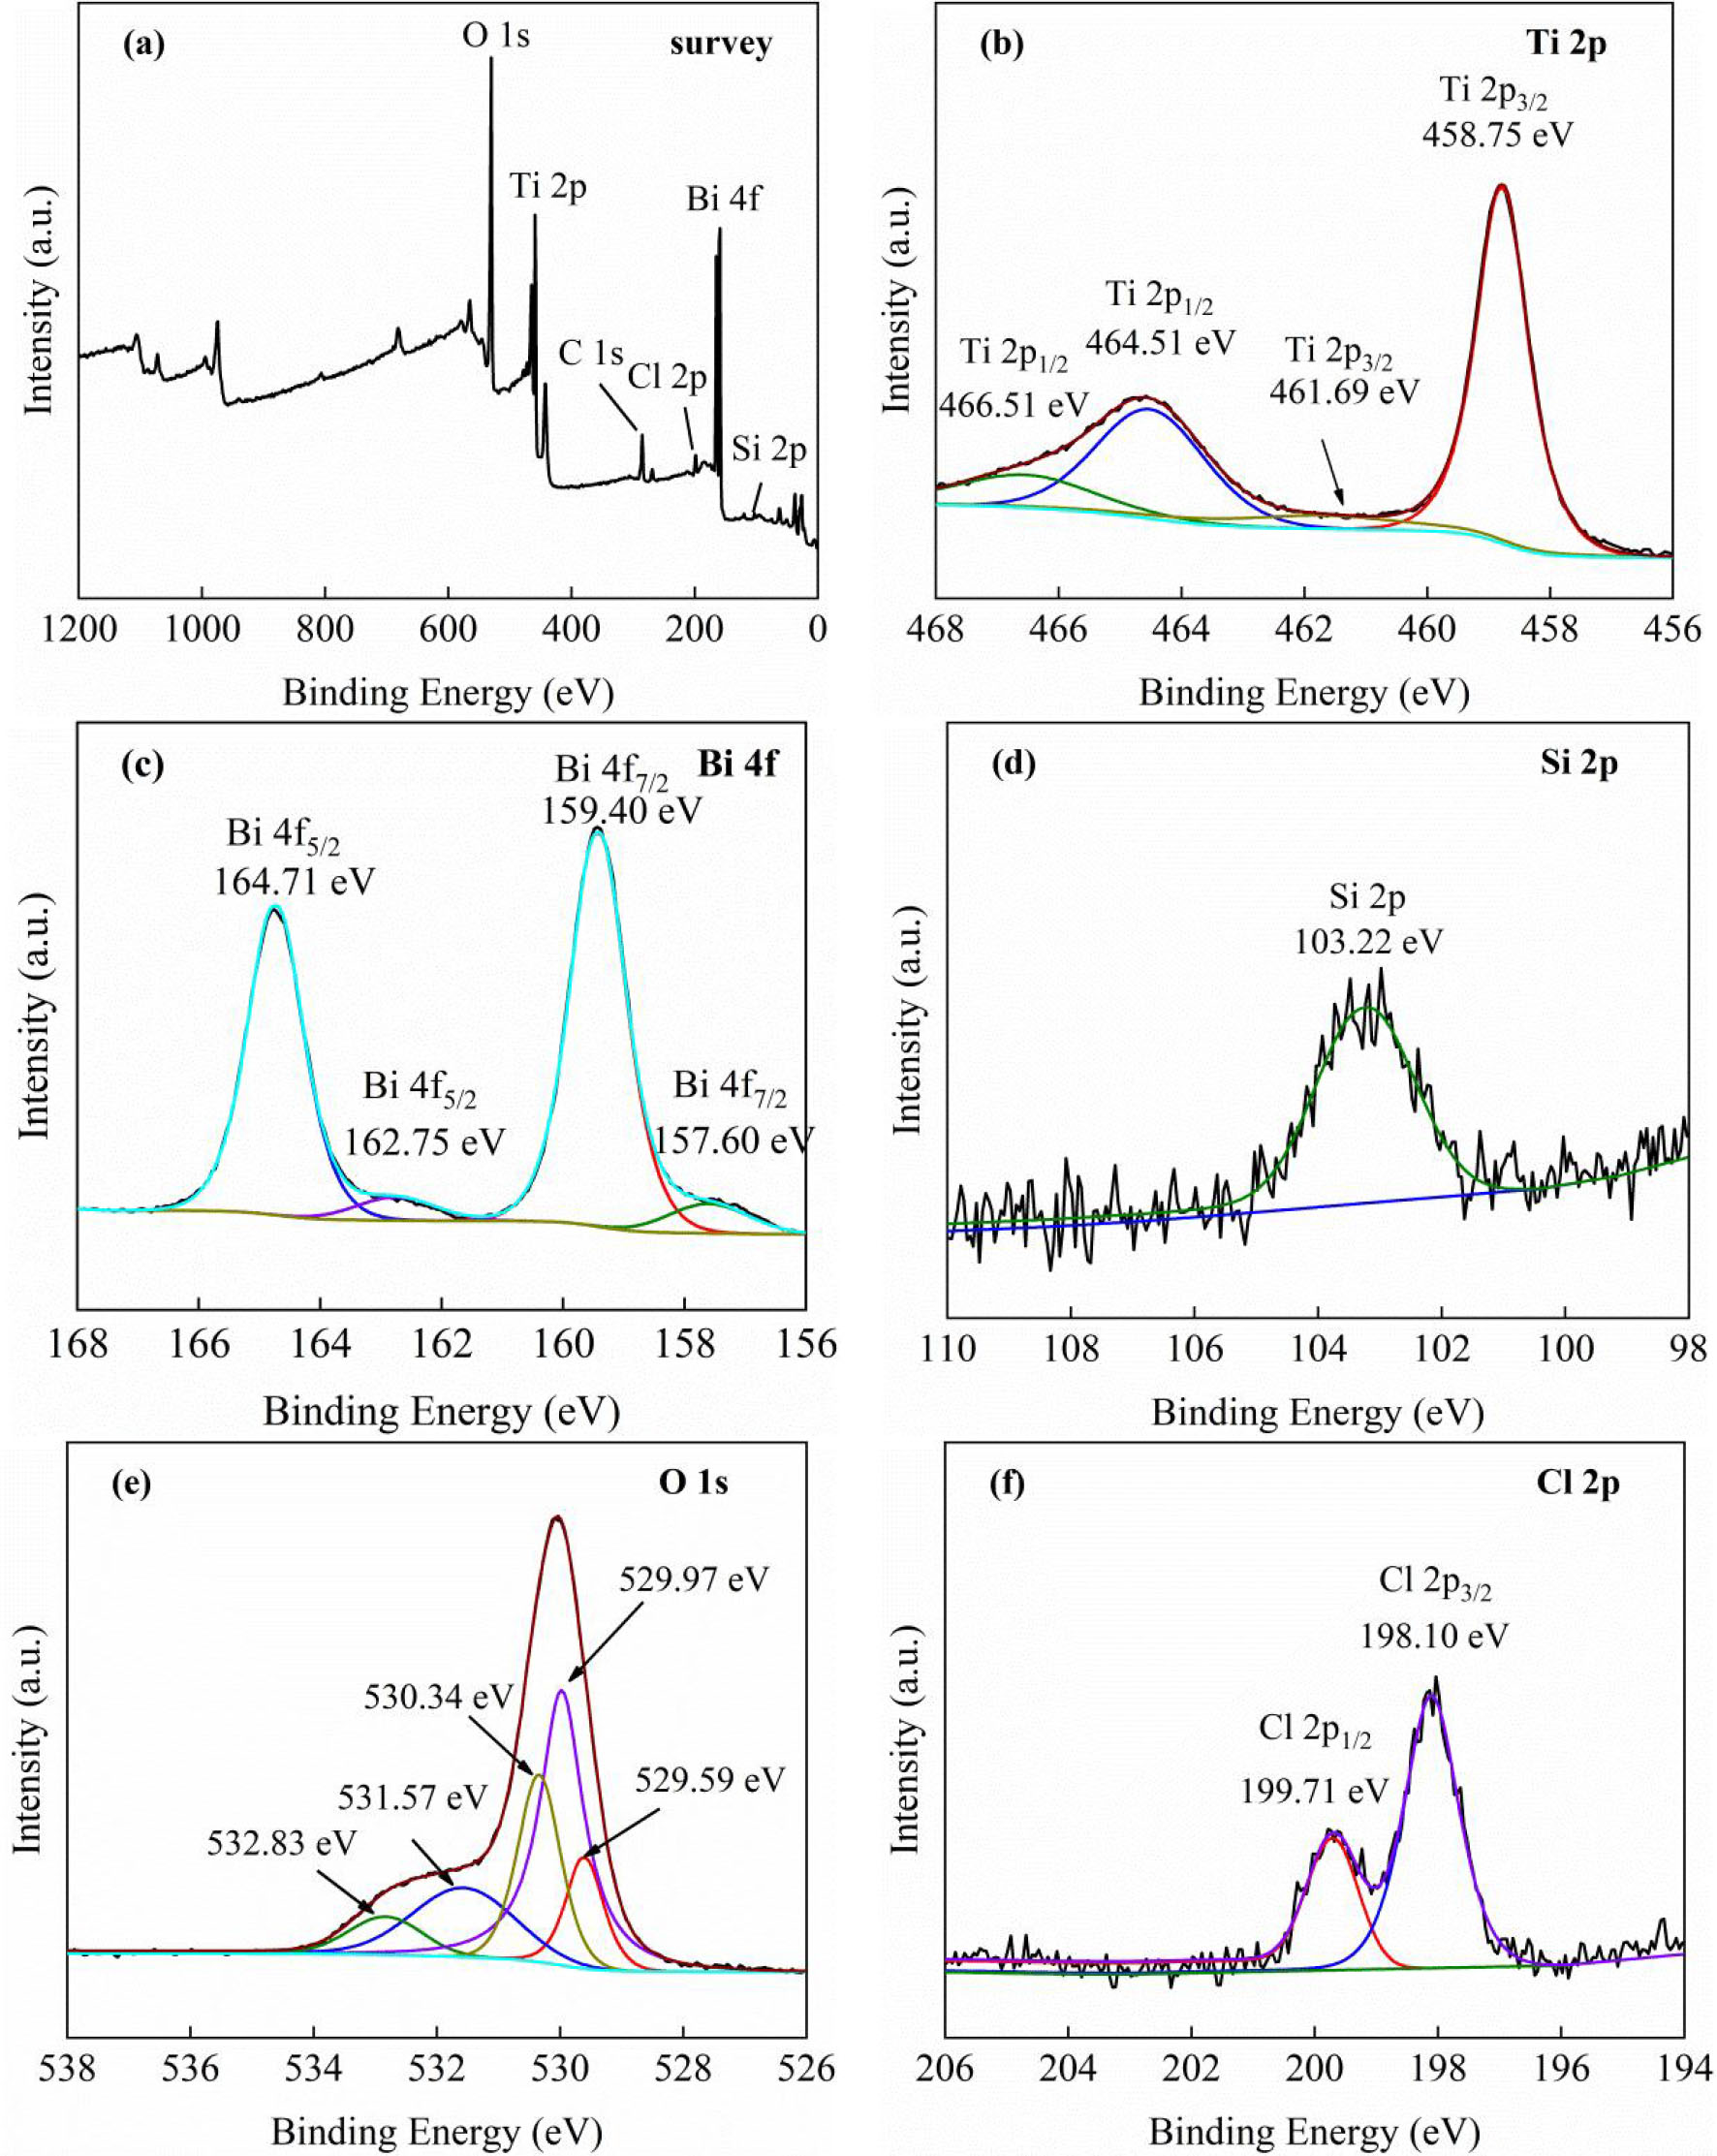
Fig. 7.
(a) The XPS of BTMC-20, (b) the high-resolution Ti 2p, (c) Bi 4f, (d) Si 2p, (e) O 1s, (f) Cl 2p of sample
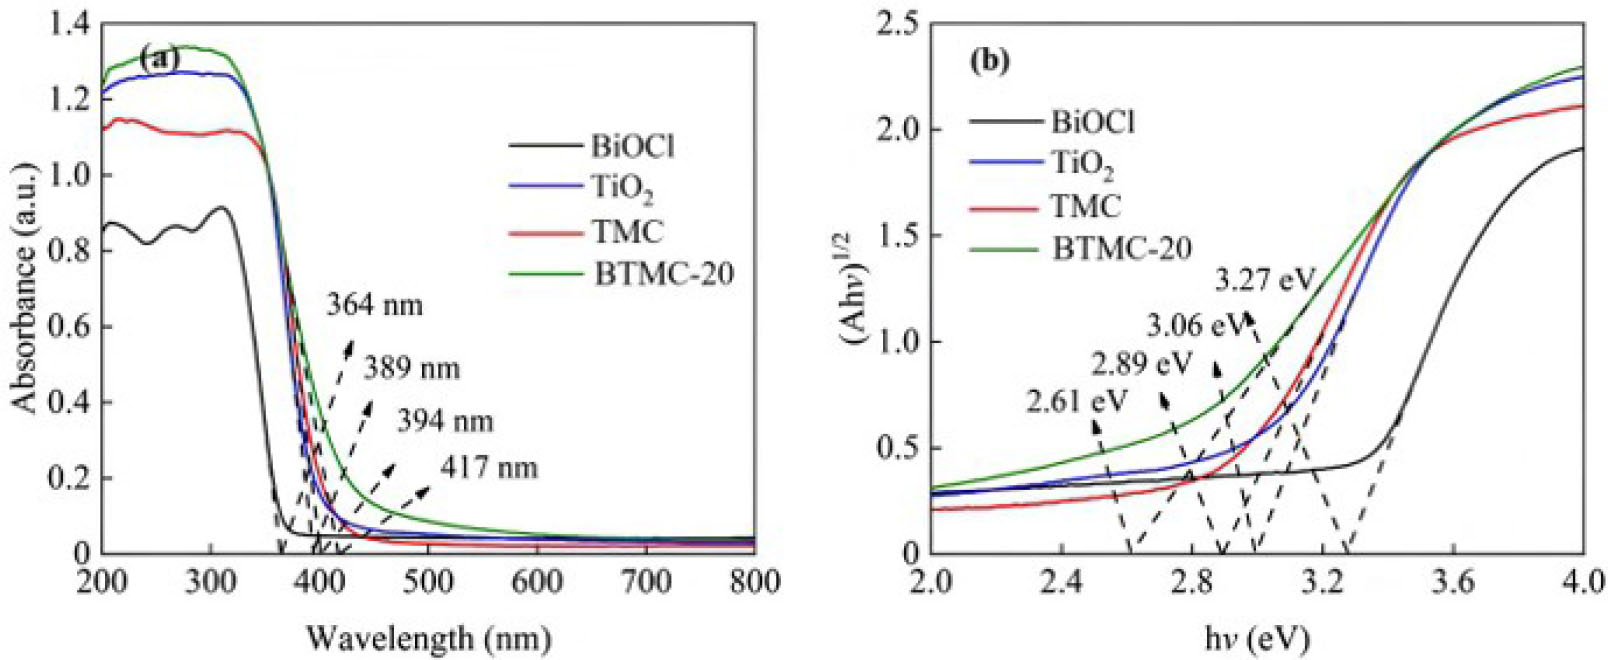
Fig. 8.
The UV–vis spectra (a) and band gaps of BiOCl, TiO2, TMC, and BTMC-20 (b)
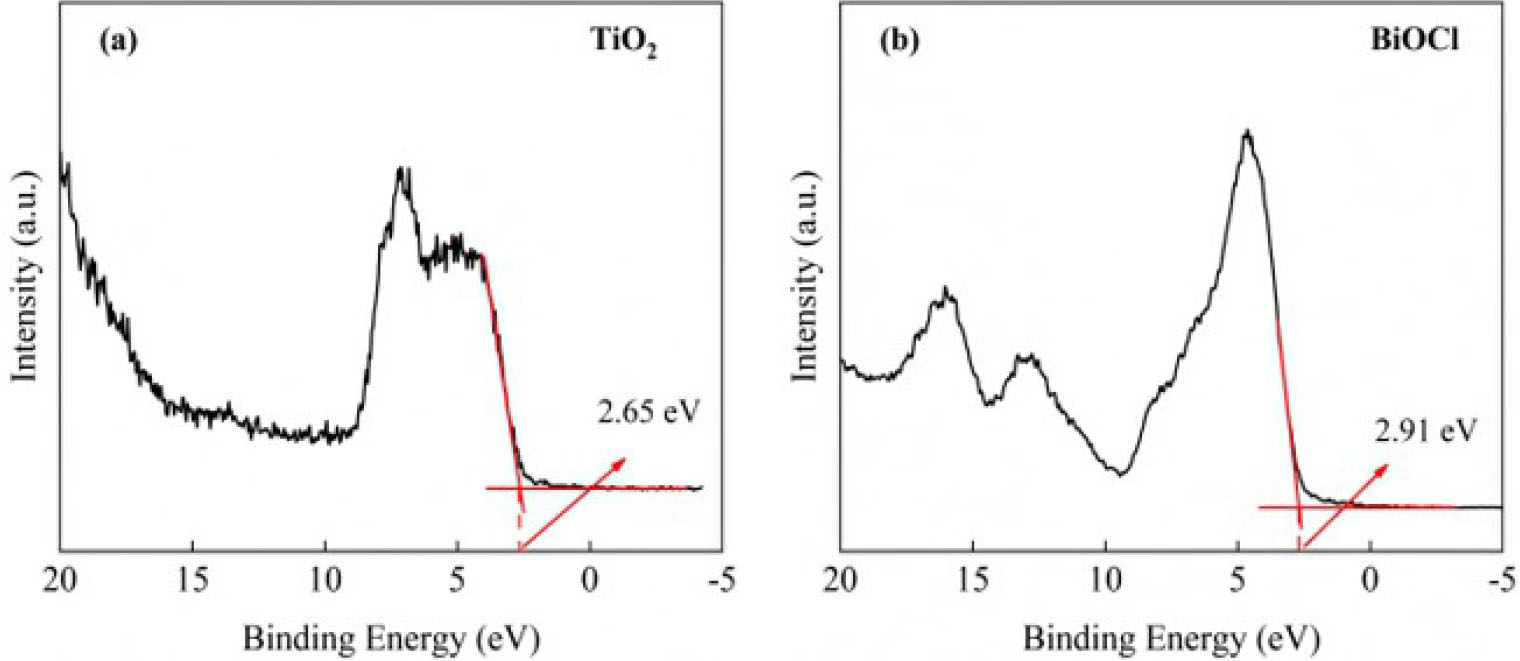
Fig. 9.
The valence-band XPS spectrum of TiO2 (a) and BiOCl (b)