
Fig. 1.
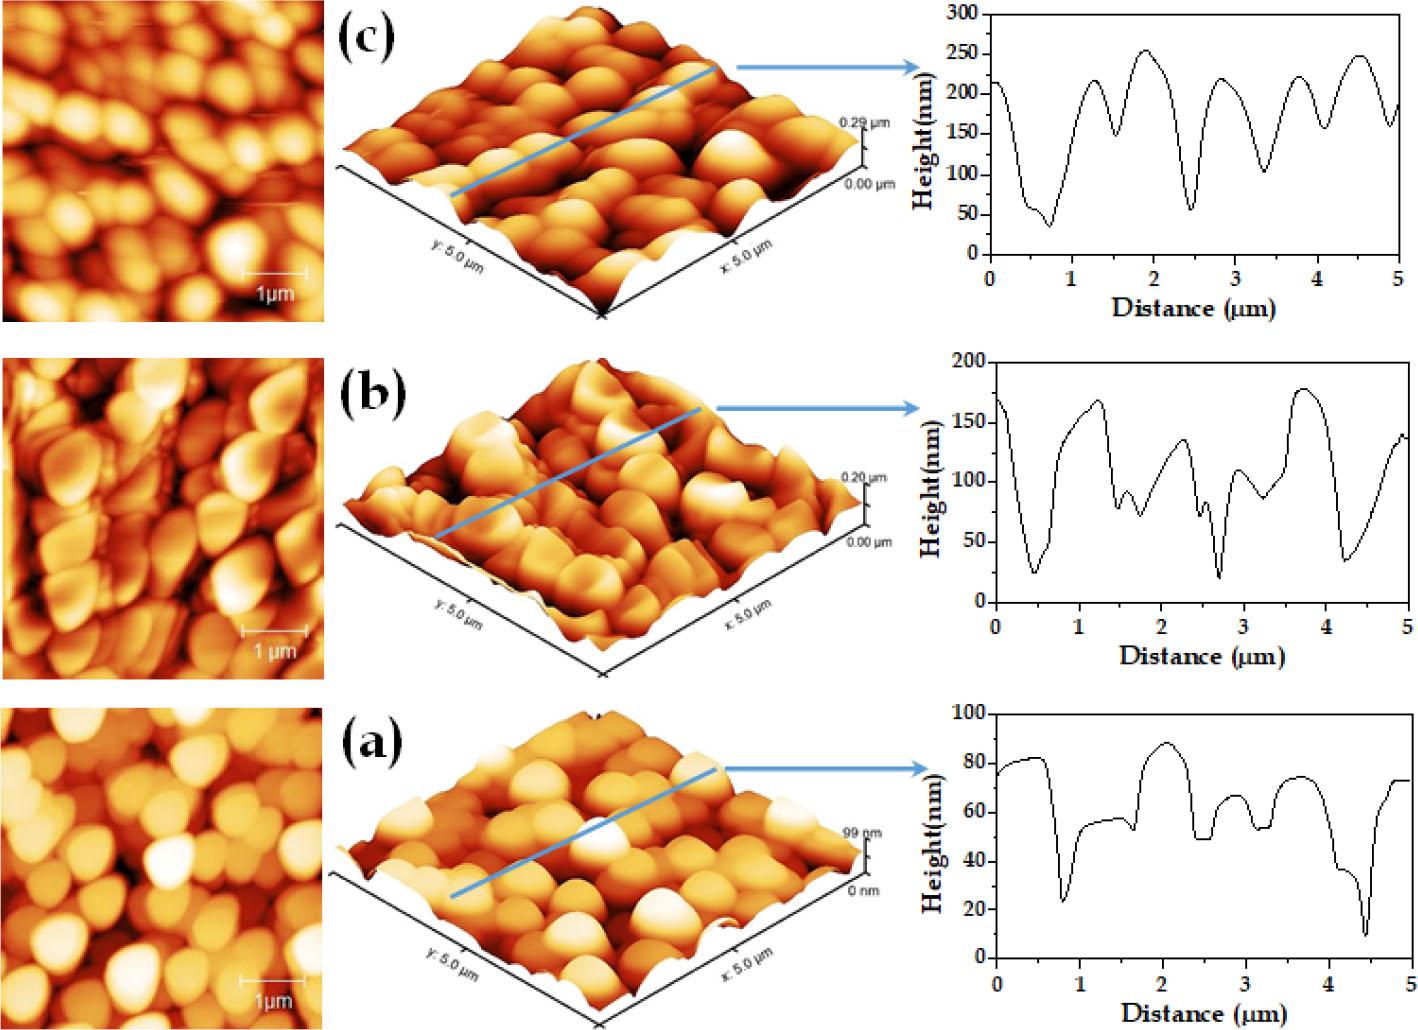
Fig. 2.
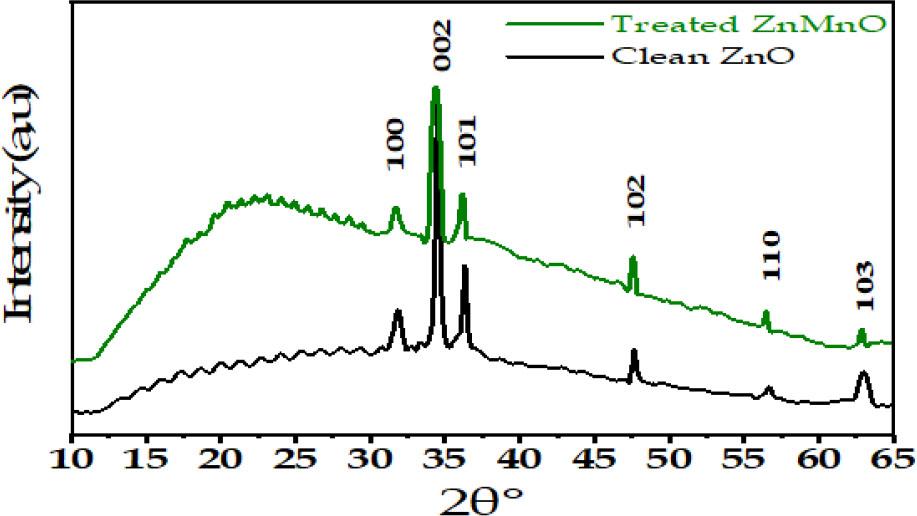
Fig. 3.
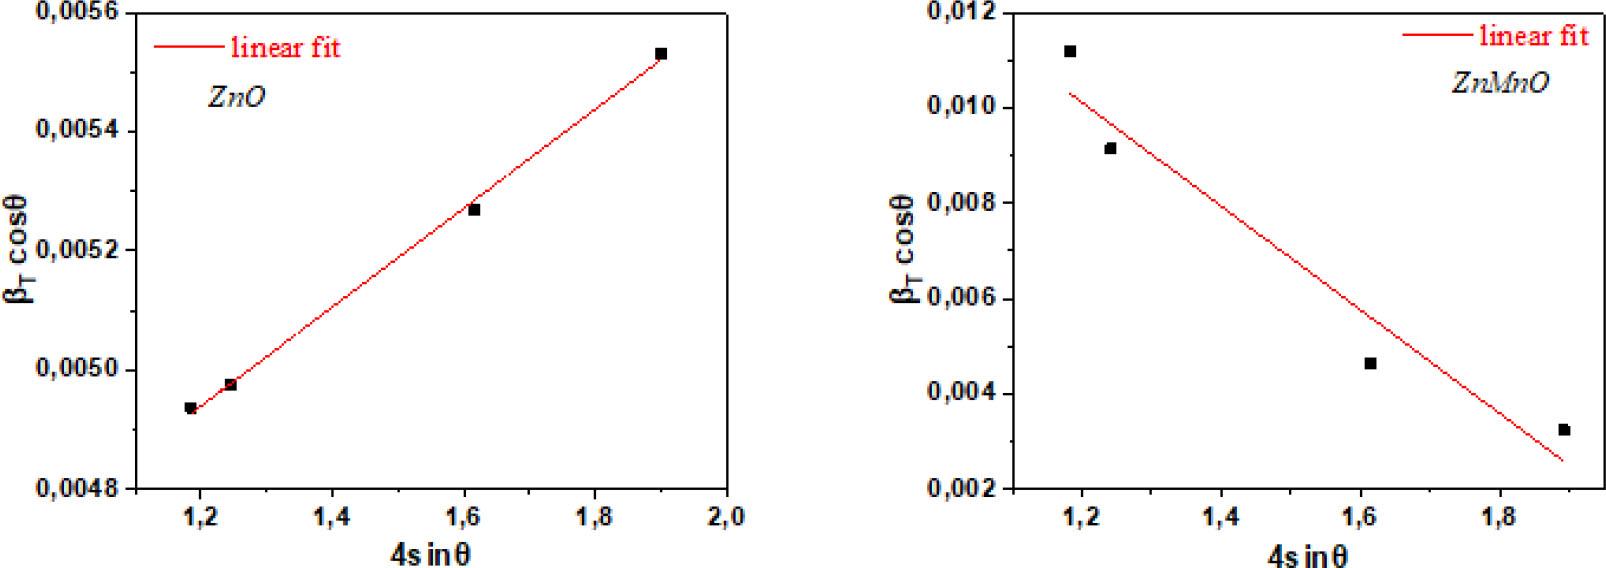
Fig. 4.
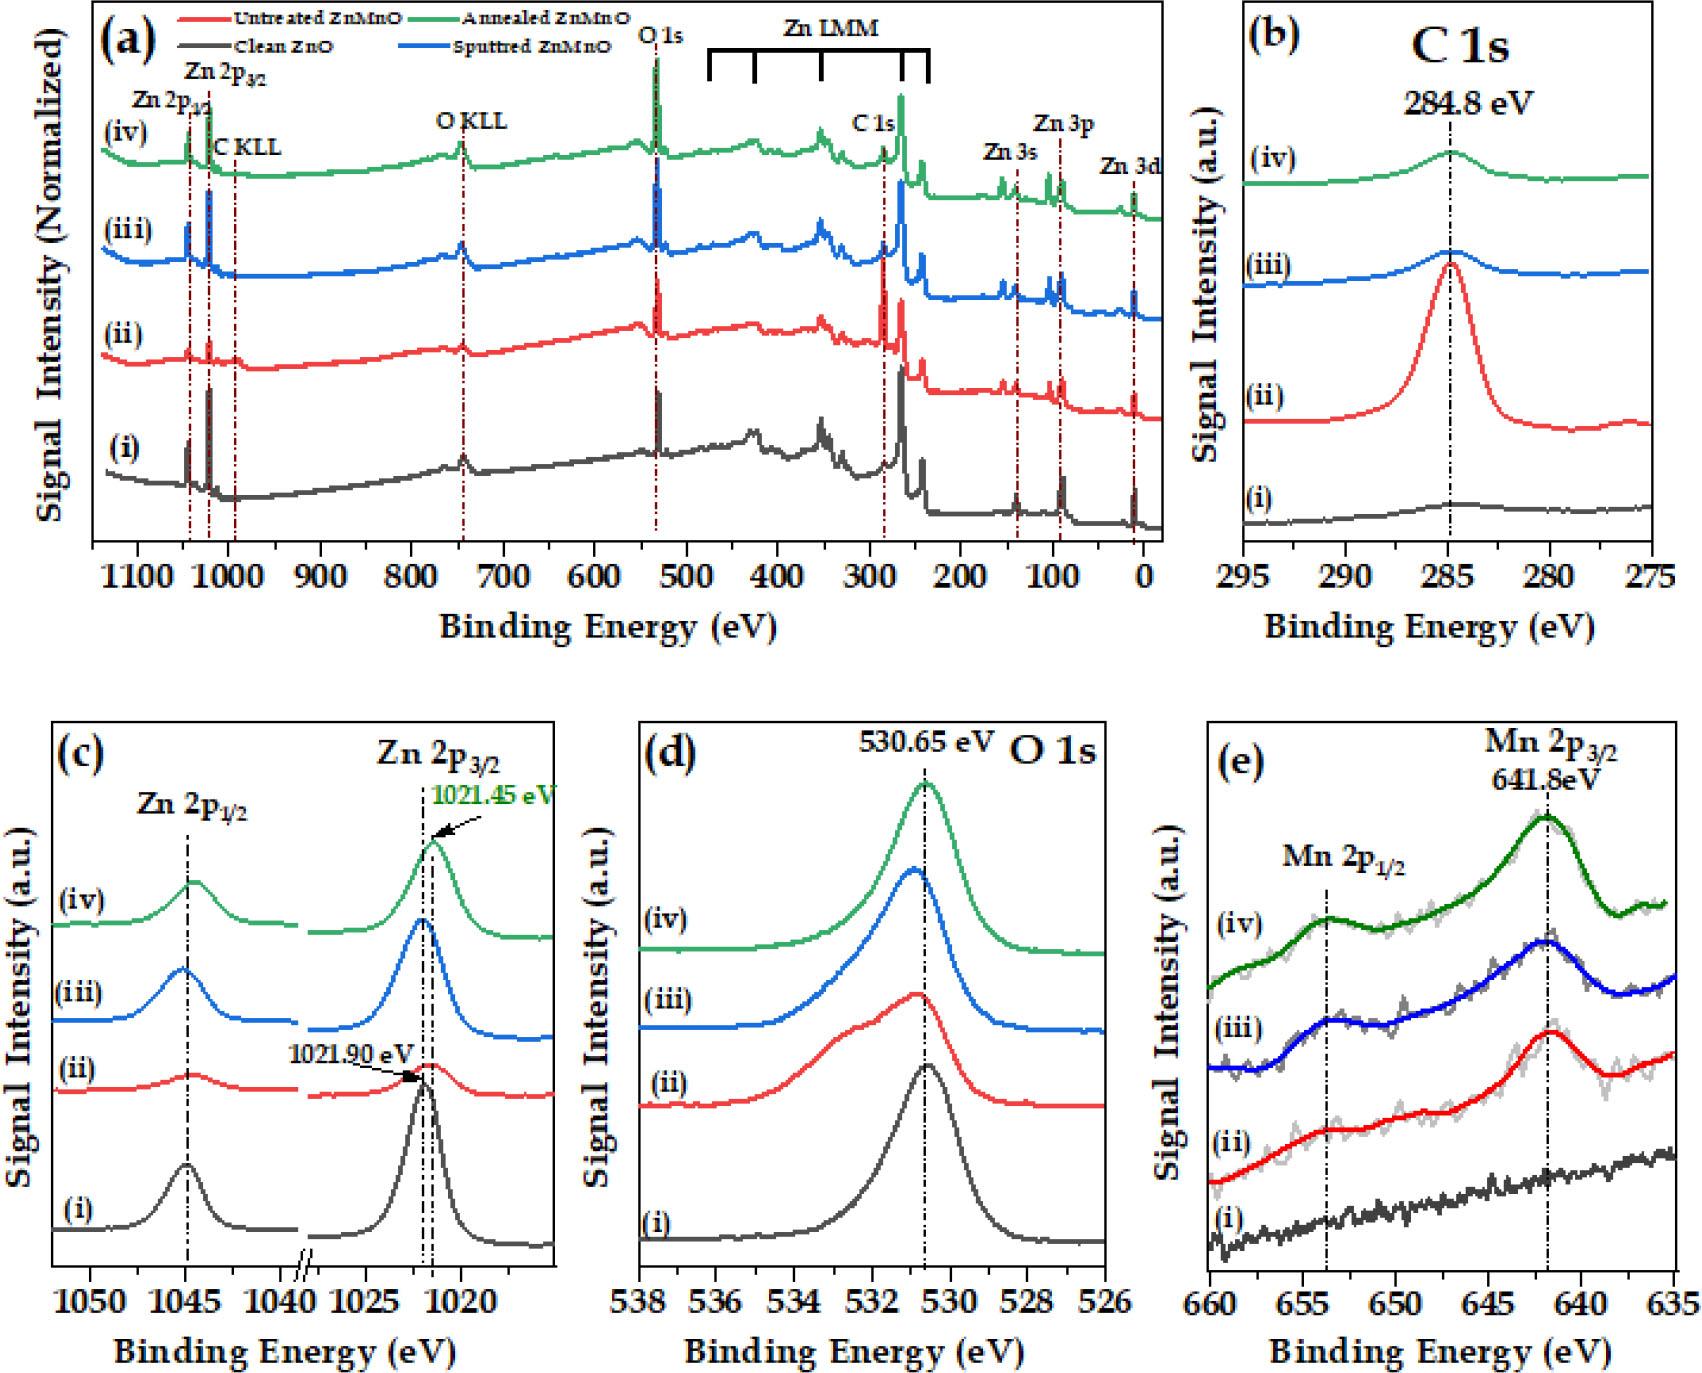
Fig. 5.
Fig. 6.
Fig. 7.
Structural parameters of ZnO and treated ZnMnO: tabulated XRD spectroscopy results
| Sample | Peak position (2θ °) | hkl | FWHM (2θ°) | d-spacing (Å) | Average grain size D (nm) | Cell parameters (Å) | c/a | Strain (ε) | |||
|---|---|---|---|---|---|---|---|---|---|---|---|
| Scherrer equation | W-H Plot | a = b | c | Scherrer equation | W-H Plot | ||||||
| ZnO(0%) | 31.84 | 1 00 | 0.58 | 2.80 | 25.20 | 28.88 | 3.242 | 5.195 | 1.602 | 0.0014 | 0.00085 |
| 34.50 | 002 | 0.33 | 2.60 | ||||||||
| 36.32 | 1 0 1 | 0.30 | 2.47 | ||||||||
| 47.65 | 1 02 | 0.33 | 1.90 | ||||||||
| 56.68 | 1 1 0 | 0.36 | 1.62 | ||||||||
| 63.02 | 1 03 | 0.83 | 1.47 | ||||||||
| ZnMnO(4%) | 31.70 | 1 00 | 0.56 | 2.82 | 12.41 | 12.38 | 3.256 | 5.212 | 1.600 | 0.0025 | 0.00122 |
| 34.38 | 002 | 0.67 | 2.60 | ||||||||
| 36.17 | 1 0 1 | 0.36 | 2.48 | ||||||||
| 47.56 | 1 02 | 0.29 | 1.91 | ||||||||
| 56.44 | 1 1 0 | 0.21 | 1.63 | ||||||||
| 62.87 | 1 03 | 0.30 | 1.47 | ||||||||
Atomic percentages of Zn, O, and Mn elements corresponding to pure ZnO and treated ZnMnO_ (a) atomic ratio of the Mn atoms taking the Zn sites_ (b) stoichiometry factor of O to Zn and Mn
| Sample | at(%) | Comments | |||
|---|---|---|---|---|---|
| Zn | O | Mn | (a): | (b): | |
| ZnO | 34.00 | 66.00 | 0.00 | 0.00 | 1.94 |
| ZnMnO@800°C | 22.30 | 74.04 | 3.65 | 14.07 | 2.85 |
The main statistical parameters calculated through the AFM images in Figure 1 using Gwyddion software
| Sample | Maximum height (Zmax) (nm) | Median height (Zmed) (nm) | Mean roughness (Sa) (nm) | Number of grains (N) |
|---|---|---|---|---|
| ZnO | 98.84 | 60.22 | 13.50 | 115 |
| Untreated ZnMnO | 198.0 | 106.46 | 27.05 | 152 |
| Treated ZnMnO | 288.84 | 132.52 | 43.03 | 126 |