
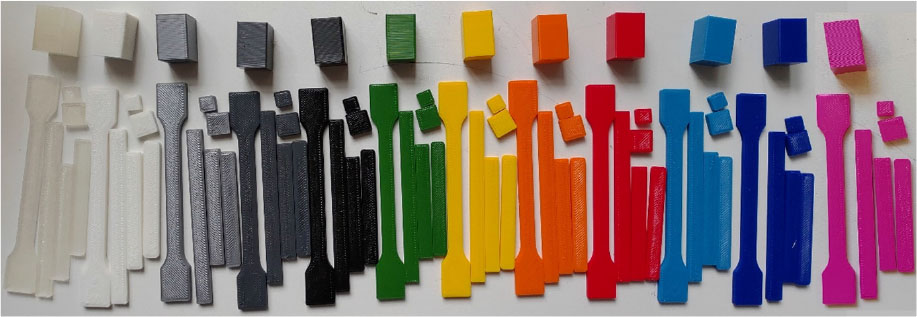
Fig. 1.
PLA test samples printed in different colours
Table 1.
Parameters for printing test samples set on the HBOT 3D F300 printer
| parameter | size |
|---|---|
| Working table temperature [°C] | 60 |
| Nozzle temperature [°C] | 235 |
| Nozzle diameter [mm] | 0,60 |
| Layer height [mm] | 0,30 |
| Sample filling degree [%] | 100 |
| Filling type | rectangular |
| Printing direction | horizontal |
| Print speed [mm/s] | 50 |
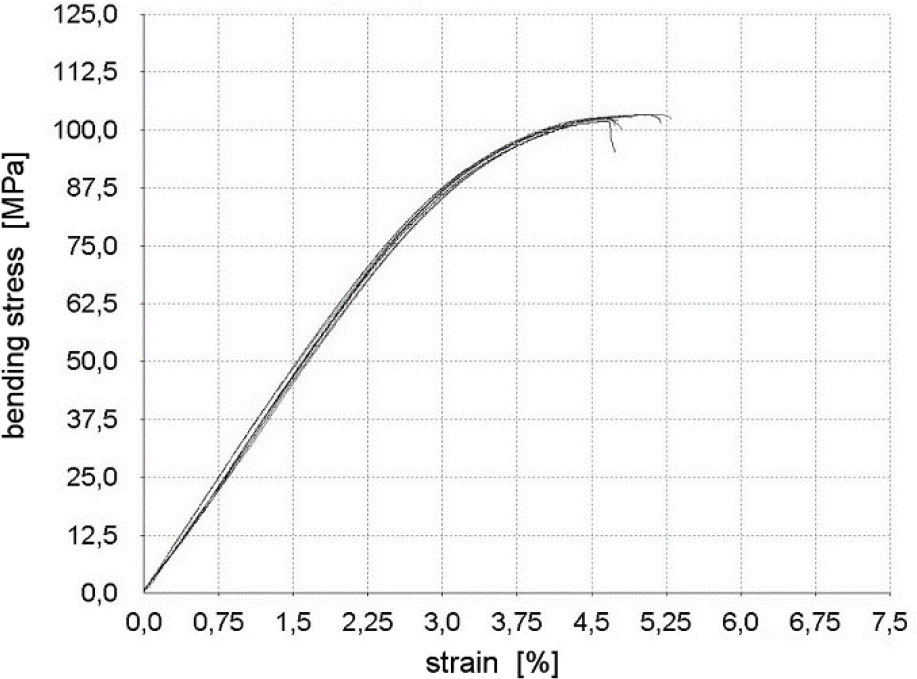
Fig. 2.
Bending curves for natural samples
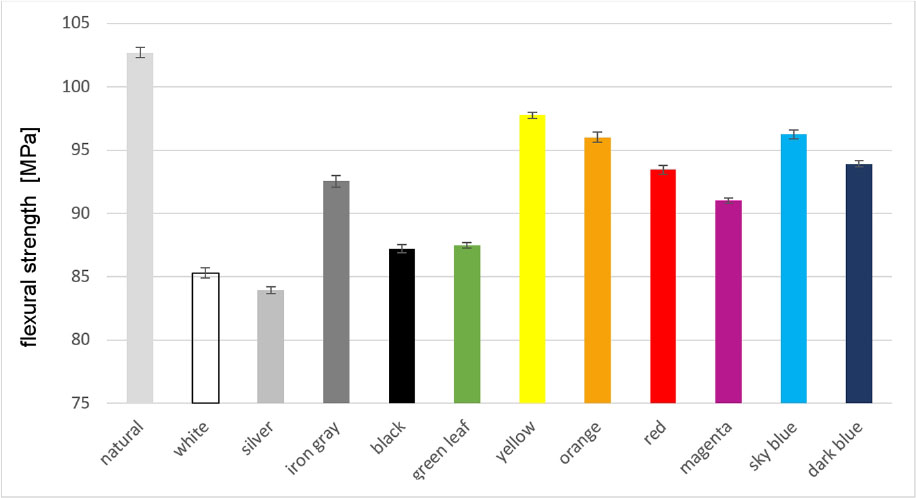
Fig. 3.
Flexural strength of the tested materials
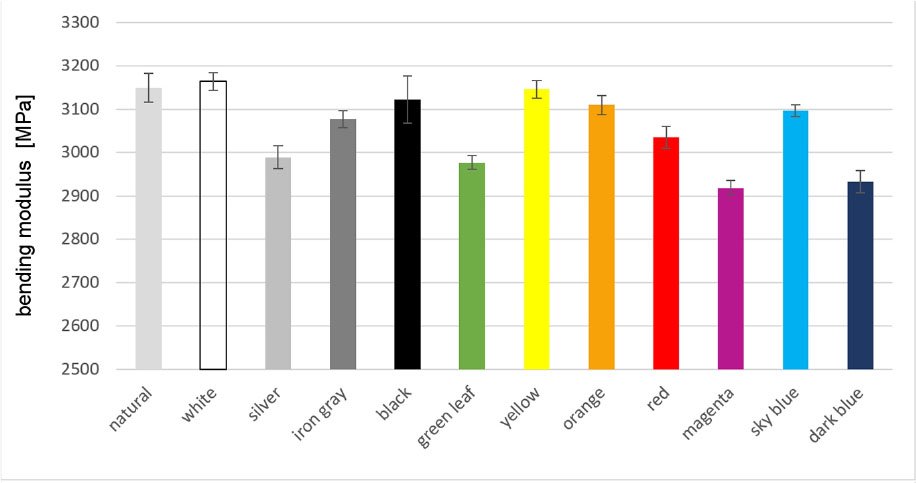
Fig. 4.
Flexural modulus of the tested materials
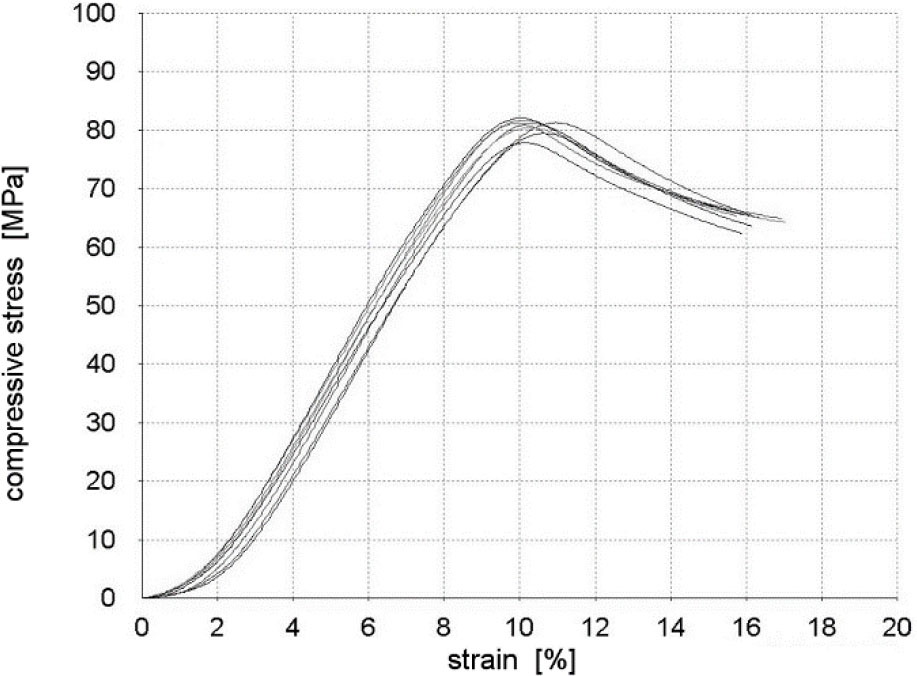
Fig. 5.
Compression curves for natural samples
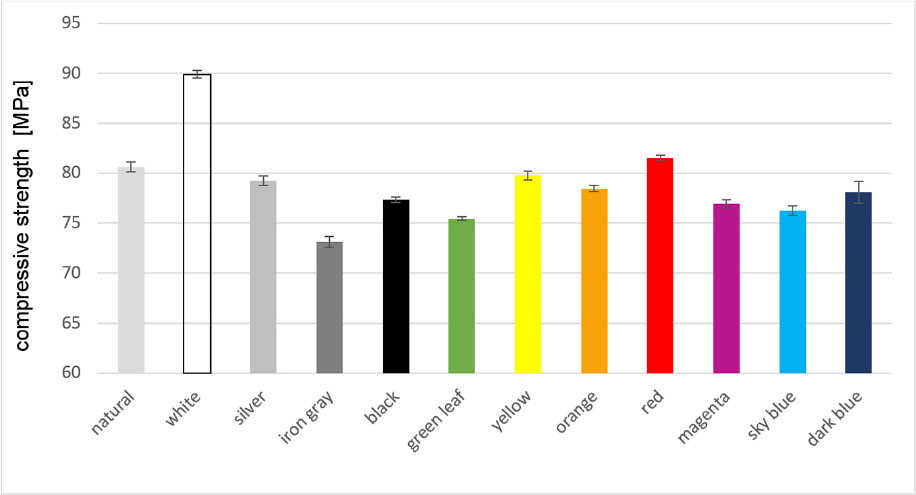
Fig. 6.
Compressive strength of the tested materials
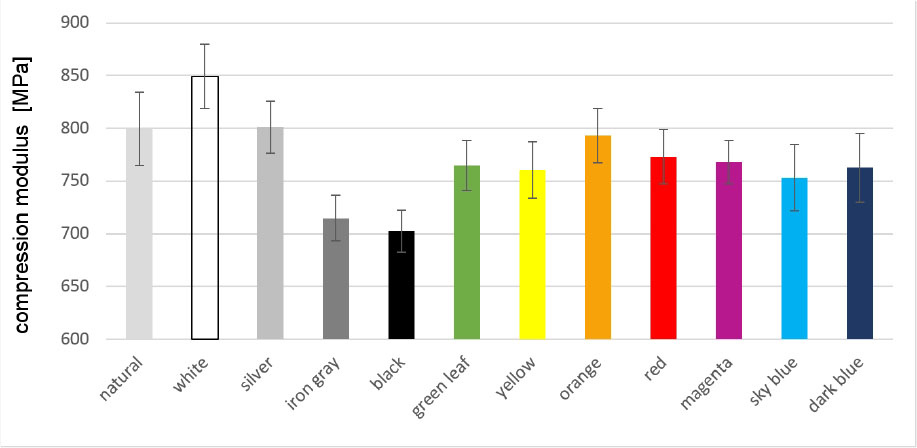
Fig. 7.
Compression modulus of the tested materials
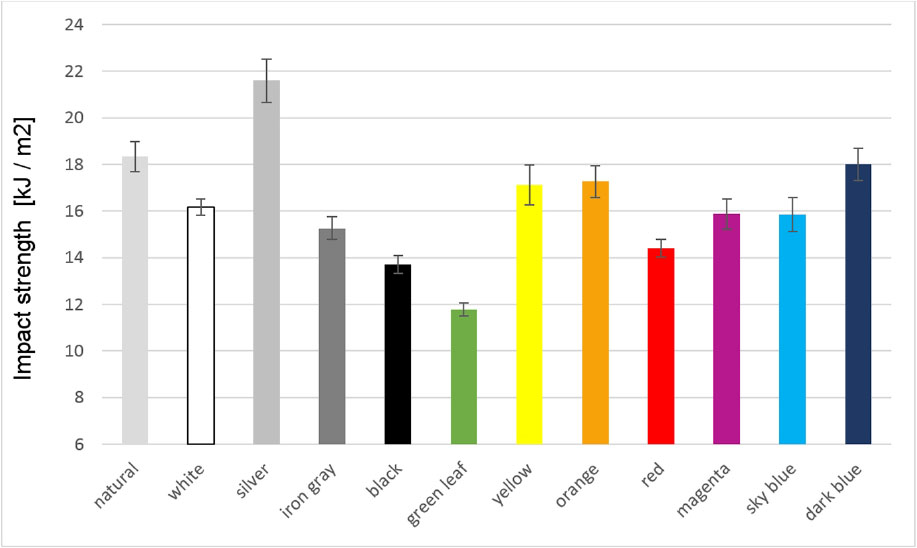
Fig. 8.
Impact strength of the tested materials
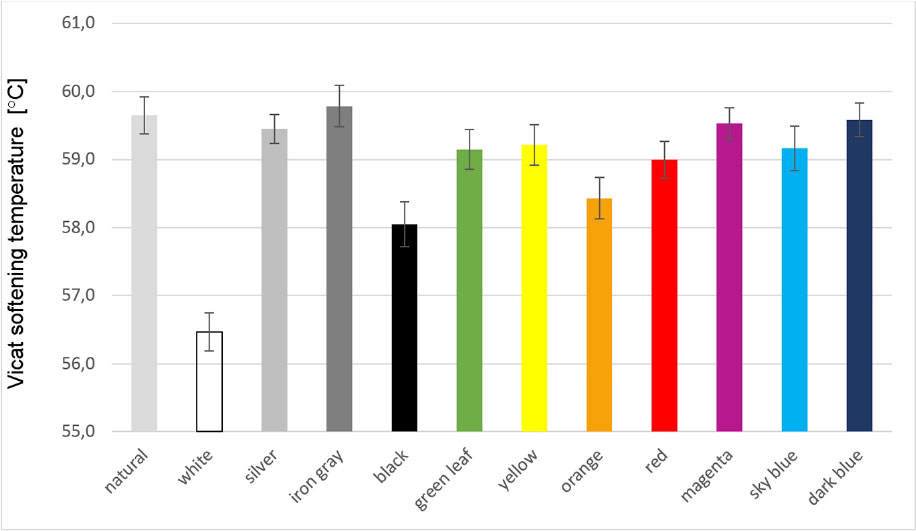
Fig. 9.
Vicat softening point of the tested materials
Table 2.
Summary of the data produced from DSC testing of first heating scan for the PLA filaments considered including heat capacity (Cp) at temperature of glass transition, glass transition temperature (Tg), cold crystallisation temperature (Tc), enthalpy of cold crystallisation (ΔHc), melting temperature (Tm), enthalpy of melting (ΔHm) and degree of crystallinity (X)
| I heating | ||||||||
|---|---|---|---|---|---|---|---|---|
| J/(g*K) ΔCp | °C Tg | °C Tc | J/g ΔHc | °C Tm1 | °C Tm2 | J/g ΔHm | % X | |
| natural | 1,463 | 63,4 | 106,4 | 29,24 | 162,5 | 153,9 | 43,34 | 13,2 |
| white | 0,884 | 61,8 | 98,2 | 24,55 | 160,6 | 149,6 | 40,98 | 15,4 |
| silver | 0,930 | 65,2 | 103,1 | 25,91 | 152,8 | 35,95 | 9,5 | |
| iron gray | 0,555 | 64,0 | 101,8 | 24,33 | 153,0 | 38,10 | 13,0 | |
| black | 0,752 | 64,6 | 101,4 | 18,31 | 155,0 | 148,0 | 36,20 | 16,8 |
| green leaf | 1,622 | 64,6 | 106,0 | 28,63 | 152,5 | 35,25 | 6,2 | |
| yellow | 1,461 | 65,5 | 103,4 | 19,98 | 151,8 | 39,67 | 18,5 | |
| orange | 1,425 | 65,7 | 100,2 | 21,74 | 153,7 | 34,39 | 11,9 | |
| red | 1,327 | 64,8 | 101,3 | 27,88 | 155,2 | 148,3 | 32,67 | 4,5 |
| magenta | 1,149 | 66,2 | 95,0 | 21,60 | 161,9 | 38,88 | 16,2 | |
| sky blue | 0,933 | 66,1 | 96,0 | 28,05 | 162,8 | 38,99 | 10,3 | |
| dark blue | 0,995 | 64,3 | 97,1 | 30,12 | 162,8 | 40,17 | 9,4 | |
Table 3.
Summary of the data produced from DSC testing of second heating scan for the PLA filaments considered including cold crystallisation temperature (Tc), enthalpy of cold crystallisation (ΔHc), melting temperature (Tm) and enthalpy of melting (ΔHm)
| II heating | |||||
|---|---|---|---|---|---|
| °C Tc | J/g ΔHc | °C Tm1* | °C Tm2** | J/g ΔHm | |
| natural | 131,4 | 3,575 | 158,6 | 3,564 | |
| white | 124,3 | 44,900 | 155,7 | 159,2 | 42,360 |
| silver | 126,3 | 15,340 | 152,9 | 16,430 | |
| iron gray | 124,3 | 25,780 | 152,2 | 25,130 | |
| black | 102,7 | 17,240 | 150,4 | 153,9 | 42,500 |
| green leaf | 126,6 | 14,210 | 152,6 | 13,570 | |
| yellow | 105,9 | 20,850 | 149,2 | 38,360 | |
| orange | 122,2 | 33,090 | 152,1 | 28,490 | |
| red | 127,7 | 13,560 | 153,8 | 13,140 | |
| magenta | 116,5 | 12,110 | 159,4 | 7,293 | |
| sky blue | 113,1 | 47,870 | 155,2 | 161,3 | 46,310 |
| dark blue | 118,4 | 52,560 | 155,5 | 160,9 | 45,020 |
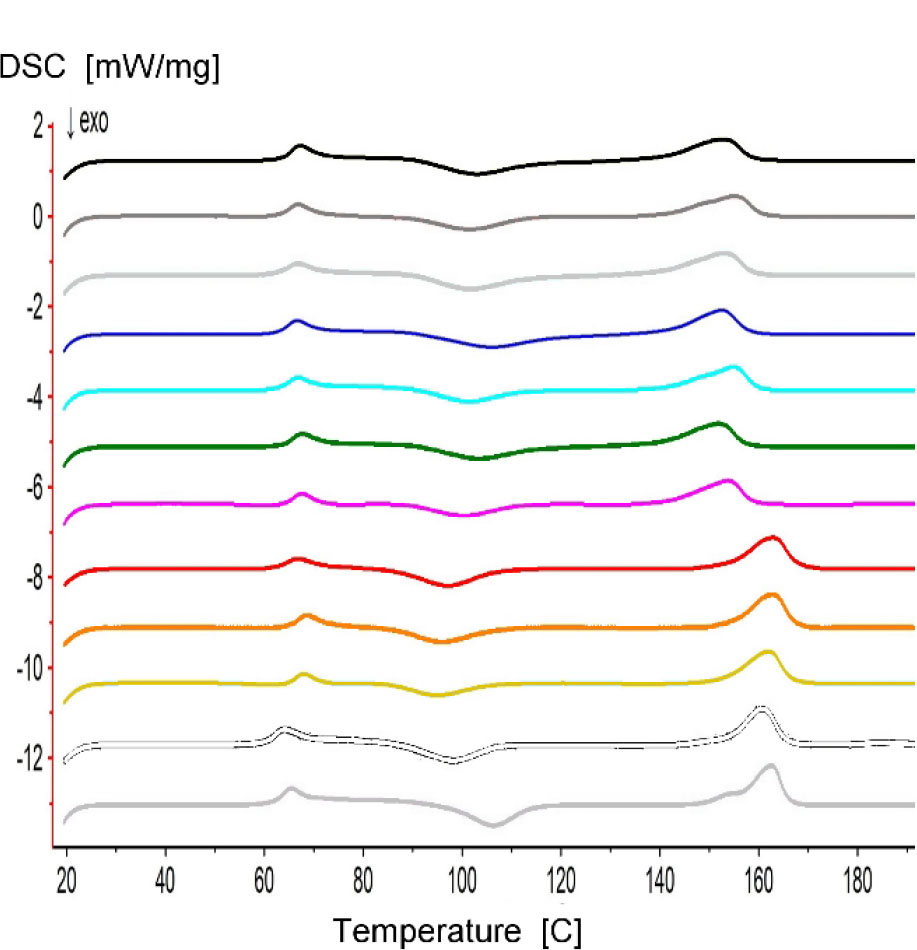
Fig. 10.
The course of the DSC curves for the tested materials for the first heating (respectively from the bottom: natural, white, yellow, orange, red, magenta, green leaf, sky blue, dark blue, silver, iron gray, black)
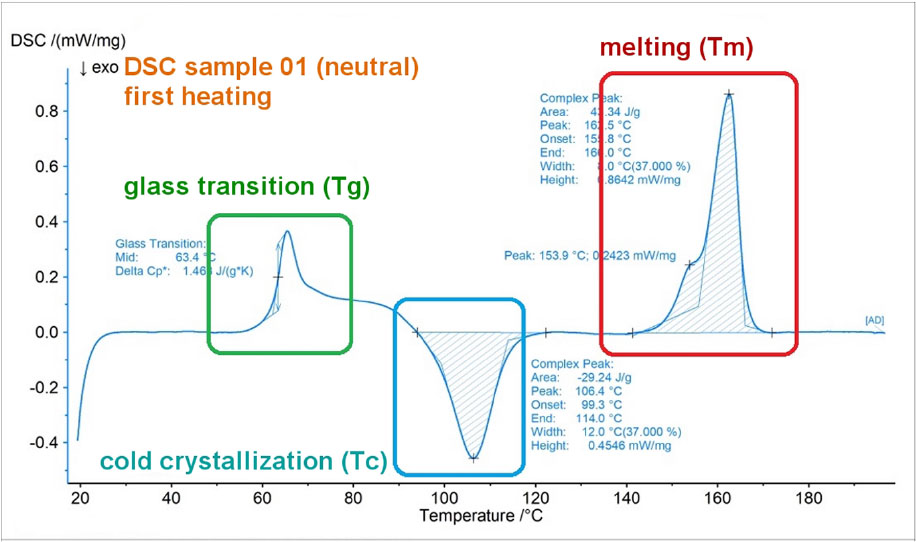
Fig. 11.
DSC curve of the first heating at a constant rate of 10 K/min for the natural sample – two temperature peaks can be observed appearing in the melting area
Table 4.
Table of R2 coefficients between the parameters determined in the DSC study
| X [%] | Tg | Tc (I) | Tc (II) | Tm1 (I) | Tm1 (II) | Cp | Hc (I) | Hm (I) | Hc (II) | Hm (II) | |
|---|---|---|---|---|---|---|---|---|---|---|---|
| X [%] | 1,00 | ||||||||||
| Tg | 0,00 | 1,00 | |||||||||
| Tc (I) | 0,03 | 0,06 | 1,00 | ||||||||
| Tc (II) | 0,36 | 0,16 | 0,11 | 1,00 | |||||||
| Tm1 (I) | 0,01 | 0,03 | 0,33 | 0,00 | 1,00 | ||||||
| Tm1 (II) | 0,00 | 0,02 | 0,14 | 0,19 | 0,71 | 1,00 | |||||
| Cp | 0,06 | 0,04 | 0,19 | 0,06 | 0,02 | 0,00 | 1,00 | ||||
| Hc (I) | 0,57 | 0,06 | 0,01 | 0,45 | 0,16 | 0,21 | 0,03 | 1,00 | |||
| Hm (I) | 0,28 | 0,17 | 0,01 | 0,00 | 0,41 | 0,25 | 0,01 | 0,02 | 1,00 | ||
| Hc (II) | 0,00 | 0,02 | 0,41 | 0,04 | 0,14 | 0,00 | 0,15 | 0,03 | 0,04 | 1,00 | |
| Hm (II) | 0,08 | 0,01 | 0,19 | 0,41 | 0,01 | 0,16 | 0,20 | 0,05 | 0,02 | 0,66 | 1,00 |
Table 5.
Table of R2 coefficients between the parameters determined in the DSC test and the mechanical properties of the tested materials
| bending modulus [MPa] | flexural strength [MPa] | compress. modulus [MPa] | compress. strength [MPa] | impact strength [kJ/m2] | Vicat softening temp. [C] | |
|---|---|---|---|---|---|---|
| X [%] | 0,20 | 0,01 | 0,01 | 0,02 | 0,02 | 0,07 |
| Tg | 0,15 | 0,04 | 0,16 | 0,38 | 0,00 | 0,27 |
| Tc (I) | 0,08 | 0,01 | 0,00 | 0,00 | 0,00 | 0,04 |
| Tc (II) | 0,03 | 0,00 | 0,30 | 0,04 | 0,03 | 0,02 |
| Tm1 (I) | 0,01 | 0,08 | 0,07 | 0,06 | 0,02 | 0,00 |
| Tm1 (II) | 0,09 | 0,04 | 0,17 | 0,04 | 0,03 | 0,02 |
| Cp | 0,00 | 0,17 | 0,11 | 0,01 | 0,01 | 0,02 |
| Hc (I) | 0,10 | 0,03 | 0,08 | 0,00 | 0,01 | 0,11 |
| Hm (I) | 0,07 | 0,14 | 0,06 | 0,07 | 0,11 | 0,00 |
| Hc (II) | 0,00 | 0,00 | 0,01 | 0,03 | 0,01 | 0,11 |
| Hm (II) | 0,11 | 0,01 | 0,03 | 0,02 | 0,00 | 0,20 |
Table 6.
Determined wma and wra parameters for the tested materials
| Δcp | X | wma | wra | |
|---|---|---|---|---|
| [J/gK] | - | - | - | |
| natural | 1,463 | 0,13 | 0,73 | 0,14 |
| white | 0,884 | 0,16 | 0,44 | 0,40 |
| silver | 0,930 | 0,09 | 0,47 | 0,44 |
| iron gray | 0,555 | 0,13 | 0,28 | 0,59 |
| black | 0,752 | 0,16 | 0,38 | 0,46 |
| green leaf | 1,622 | 0,06 | 0,81 | 0,13 |
| yellow | 1,461 | 0,19 | 0,73 | 0,08 |
| orange | 1,425 | 0,12 | 0,71 | 0,17 |
| red | 1,327 | 0,05 | 0,66 | 0,29 |
| magenta | 1,149 | 0,17 | 0,57 | 0,26 |
| sky blue | 0,933 | 0,10 | 0,47 | 0,43 |
| dark blue | 0,995 | 0,09 | 0,50 | 0,41 |
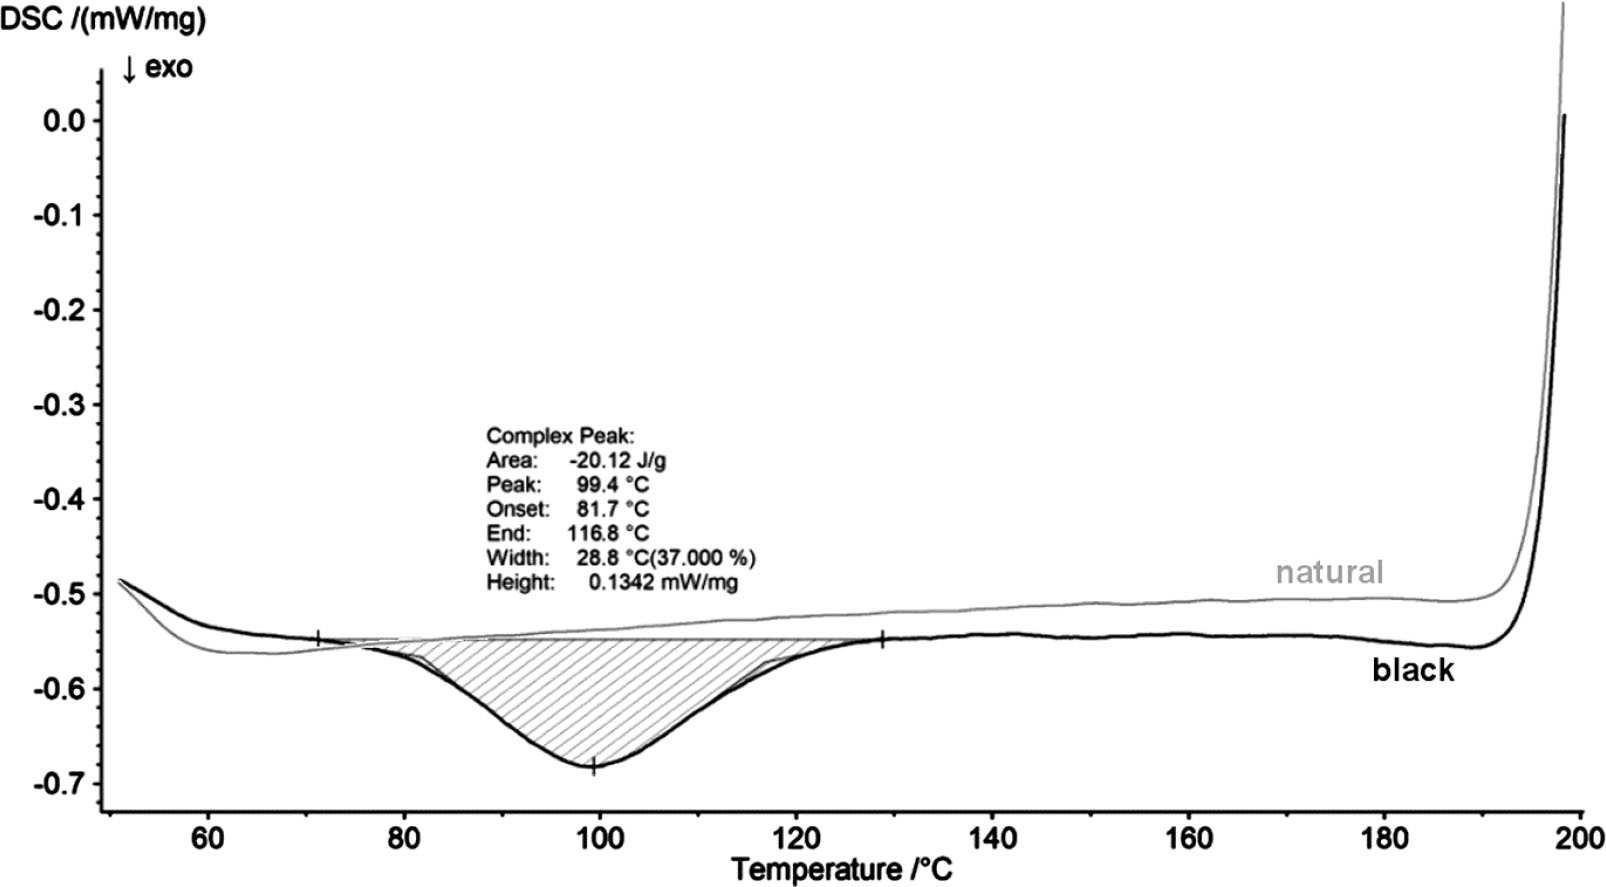
Fig. 12.
DSC curve of cooling at a constant rate of 10 K/min for black and natural samples; in the case of black, one can observe an exothermic peak characteristic of the crystallisation process