
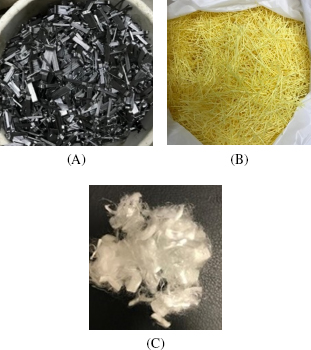
Fig. 1.
Fibers: (A) hooked-steel fibers; (B) polyvinyl alcohol fibers (C) polypropylene fibers
Table 1.
Cement and silica fume properties
| Type 1 Cement | Silica Fume | ||
|---|---|---|---|
| Chemical composition (%) | CaO | 64.1 | 2.15 |
| SiO2 | 21.8 | 89.5 | |
| AL2O3 | 5.25 | 0.43 | |
| Fe2O3 | 4.10 | 3.25 | |
| MgO | 0.71 | 1.30 | |
| TiO2 | 0.3 | 0.0 | |
| SO3 | 2.4 | 0.74 | |
| Physical properties | L.O.I | 2.18 | 2.47 |
| Mean particle size (μm) | 40.1 | 0.32 | |
| Specific gravity | 3.15 | 2.2 |
Table 2.
UHPC mixture proportions for 1 m3
| Material | Weight (kg/m3) |
|---|---|
| Cement | 900.0 |
| Fine quartz sand | 1000.0 |
| Silica Fume | 222.0 |
| Water | 164.0 |
| Super-plasticizer | 30 |
Table 3.
Properties of fibers
| Fiber type | Fiber properties | |||||
|---|---|---|---|---|---|---|
| Shape | Length (mm) | Section dimension (mm) | Specific gravity | Modulus of elasticity (GPa) | Tensile strength (MPa) | |
| Steel fibers | Hooked ends | 35 | φ 0.55 (Circular) | 7.85 | 210 | 1225 |
| Polyvinyl alcohol (PVA) | straight | 30 | φ 0.66 (Circular) | 1.3 | 23 | 900 |
| Polypropylene (PP) | straight | 12 | φ 0.022 (Circular) | 0.90 | 4 | 550 |
Table 4.
Percentage of fibers in concrete mixes
| Concrete mix | Fiber by volume (%) | ||
|---|---|---|---|
| Polyvinyl alcohol (PVA) | Polypropylene (PP) | Steel fibers (SF) | |
| M0-NF | 0.0 | 0.0 | 0.0 |
| M1-S1 | 0.0 | 0.0 | 1.0 |
| M2-S0.7-PVA0.3 | 0.3 | 0.0 | 0.7 |
| M3-S0.7-PVA0.2-PP0.1 | 0.2 | 0.1 | 0.7 |
| M4-S0.7-PVA0.2 | 0.2 | 0.0 | 0.7 |
| M5-S0.5-PVA0.5 | 0.5 | 0.0 | 0.5 |
Table 5.
Details of test matrix
| Mix | Compression and split Test | Flexure Test | ||||||
|---|---|---|---|---|---|---|---|---|
| Room temp. | 100°C | 300°C | 400°C | Room temp. | 100°C | 300°C | 400°C | |
| M0-NF | 6 | 6 | 6 | 6 | 3 | 3 | 3 | 3 |
| M1-S1 | 6 | 6 | 6 | 6 | 3 | 3 | 3 | 3 |
| M2-S0.7-PVA0.3 | 6 | 6 | 6 | 6 | 3 | 3 | 3 | 3 |
| M3-S0.7-PVA0.2-PP0.1 | 6 | 6 | 6 | 6 | 3 | 3 | 3 | 3 |
| M4-S0.7-PVA0.2 | 6 | 6 | 6 | 6 | 3 | 3 | 3 | 3 |
| M5-S0.5-PVA0.5 | 6 | 6 | 6 | 6 | 3 | 3 | 3 | 3 |
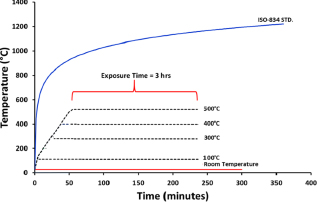
Fig. 2.
Individual time-temperature plots
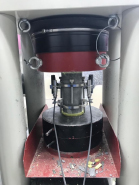
Fig. 3.
Specimen under testing
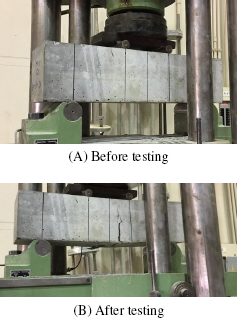
Fig. 4.
Prism specimen in flexure test
Table 6.
Fresh UHPC properties
| Mix No. | Unit Weight (kg/m3) | Slump (mm) |
|---|---|---|
| M0-NF | 2318 | 280.0 |
| M1-S1 | 2363 | 257.0 |
| M2-S0.7-PVA0.3 | 2325 | 256.0 |
| M3-S0.7-PVA0.2-PP0.1 | 2294 | 250.0 |
| M4-S0.7-PVA0.2 | 2310 | 255.0 |
| M5-S0.5-PVA0.5 | 2285 | 251.0 |
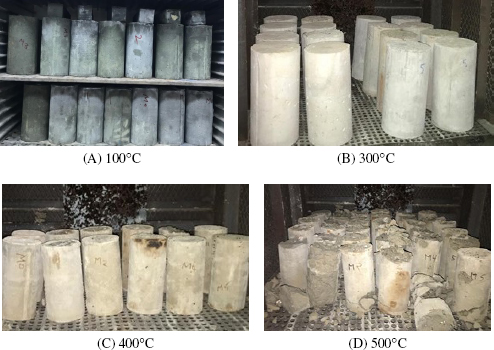
Fig. 5.
All samples after heating-cooling cycle
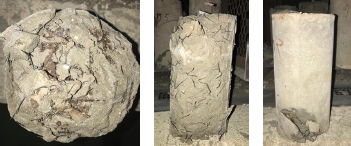
Fig. 6.
Destroyed concrete specimen from 500°C exposure
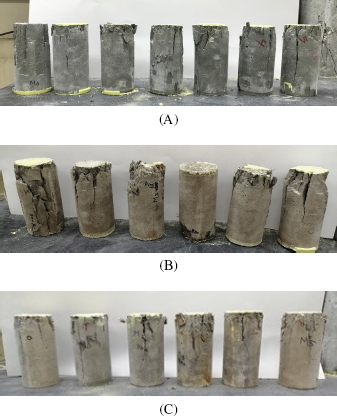
Fig. 7.
Representative samples after compression testing: (A) 100°C; (B) 300°C (C) 400°C
Table 7.
Summary of test results of different concrete mixes
| Mix | Compressive strength (MPa) | Flexure strength (MPa) | Splitting strength (MPa) | |||||||||
|---|---|---|---|---|---|---|---|---|---|---|---|---|
| Room temp. | 100°C | 300°C | 400°C | Room temp. | 100°C | 300°C | 400°C | Room temp. | 100°C | 300°C | 400°C | |
| M0-NF | 120.3 | 124.1 (+3%) | 105.6 (–12.5%) | 88.32 (–26.6%) | 10.27 | 10.47 | 8.77 (–15.1%) | 7.50 (–27.0%) | 6.6 | 6.8 (+3%) | 5.7 (–13.6%) | 4.80 (–27.3%) |
| M1-S1 | 139.8 (16.2%) | 143.8 (+2.9%) | 132.0 (–5.5%) | 104.68 (–25.12%) | 19.50 (89.9%) | 19.75 | 17.83 (–9.0%) | 16.20 (–17.0%) | 11.7 (77.3%) | 11.9 (+3%) | 10.8 (–7.7%) | 10.20 (–12.8%) |
| M2-S0.7-PVA0.3 | 134.6 (11.8%) | 139.4 (+3.6%) | 123.4 (–8.5%) | 110.19 (–18.2%) | 19.00 (85%) | 19.53 | 17.24 (–9.0%) | 15.10 (–20.5%) | 12.3 (86.4%) | 12.7 (+3%) | 11.9 (–3.3%) | 10.70 (–13%) |
| M3-S0.7-PVA0.2-PP0.1 | 131.7 (9.5%) | 133.7 (+1%) | 129.7 (–1.0%) | 102.62 (–21.5%) | 17.03 (65.8%) | 17.64 | 16.00 (–6.0%) | 15.20 (–10.7%) | 12.1 (83.3%) | 12.4 (+3%) | 11.4 (–5.8%) | 10.40 (–14%) |
| M4-S0.7-PVA0.2 | 128.2 (6.8%) | 130.3 (+1%) | 124.0 (–3.3%) | 99.70 (–22.3%) | 17.77 (73%) | 17.85 | 17.01 (–4.0%) | 14.20 (–20.0%) | 11.7 (77.3%) | 11.8 (+3%) | 10.9 (–6.8%) | 9.50 (–18.8%) |
| M5-S0.5-PVA0.5 | 127.8 (6.5%) | 131.8 (+3.2%) | 119.6 (–6.4%) | 97.4 (–23.7%) | 16.90 (64.5%) | 17.0 | 15.85 (–6.0%) | 12.90 (–25.0%) | 11.3 (74.2%) | 11.8 (+3%) | 10.8 (–6.1%) | 8.90 (–22.6%) |
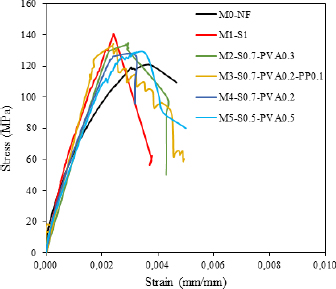
Fig. 8.
Stress-strain relations for UHPFRC cylinders at ambient temperature
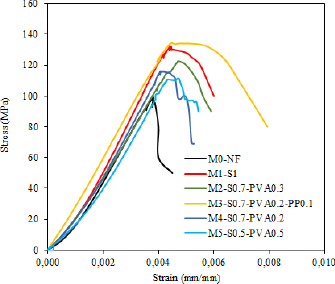
Fig. 9.
Stress-strain relations for UHPFRC cylinders at 300°C
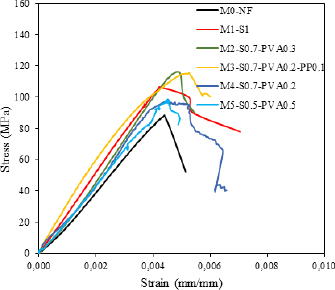
Fig. 10.
Stress-strain relations for UHPFRC cylinders at 400°C
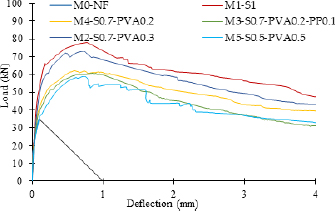
Fig. 11.
Load-deflection relations for UHPC and UH-PFRC beams (room temp. 26°C)
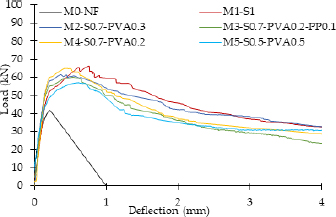
Fig. 12.
Load-deflection relations for UHPC and UH-PFRC beams (300°C)
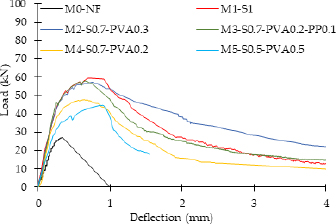
Fig. 13.
Load-deflection relations for UHPC and UH-PFRC beams (400°C)
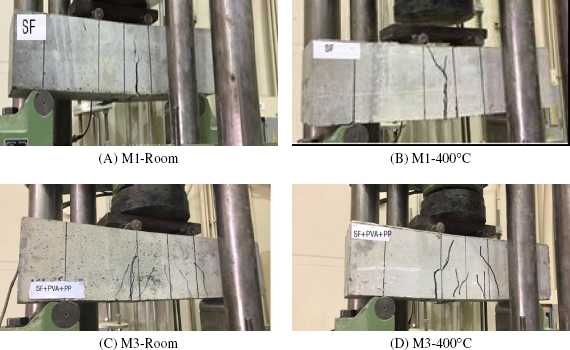
Fig. 14.
Mode of failure of some representative concrete prisms
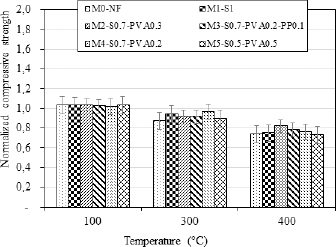
Fig. 15.
Temperature effects on UHPC and UHPFRC normalized compressive strength
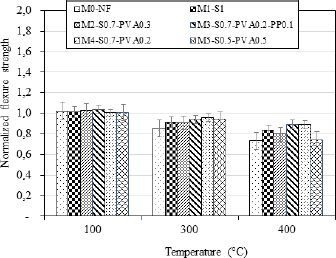
Fig. 16.
Temperature effects on the normalized flexural strength of UHPC and UHPFRC
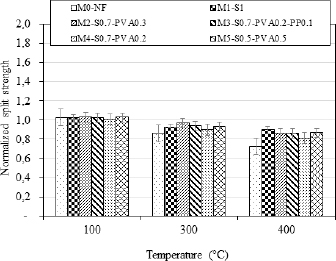
Fig. 17.
Temperature effects on the normalized splitting tensile strength of UHPC and UHPFRC
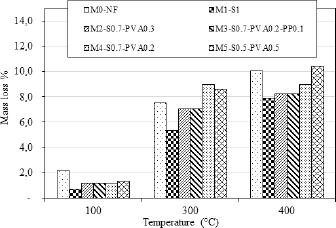
Fig. 18.
Effect of temperature on weight loss for UHPC and UHFRC specimens
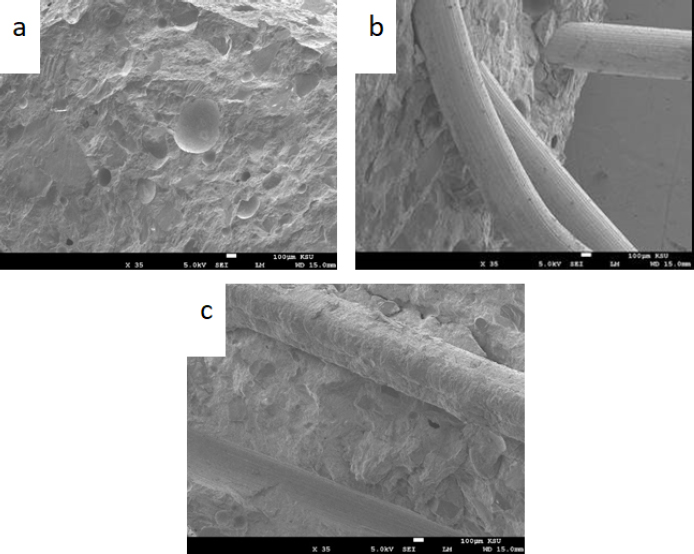
Fig. 19.
Secondary electron SEM images of concrete exposed to room temperature (a) mix M0-NF, (b) M1-S1, and (c) M3-S0.5+PVA0.5
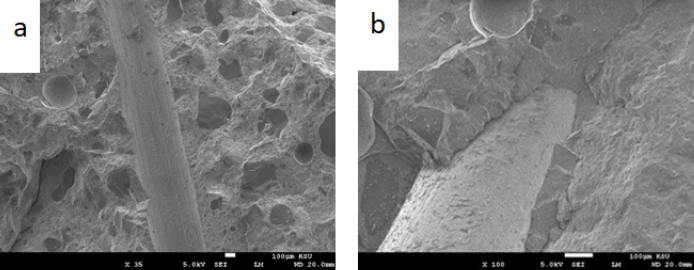
Fig. 20.
Secondary electron SEM images of concrete containing steel fibers (i.e., M1-S1) after exposure to 400°C
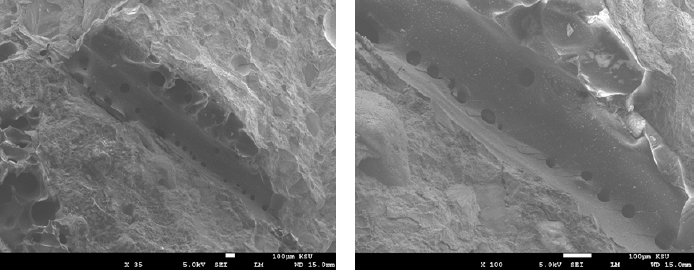
Fig. 21.
Secondary electron SEM images of concrete containing PVA fibers (i.e., M3-S0.7-PVA0.2-PP0.1) after exposure to 400°C