
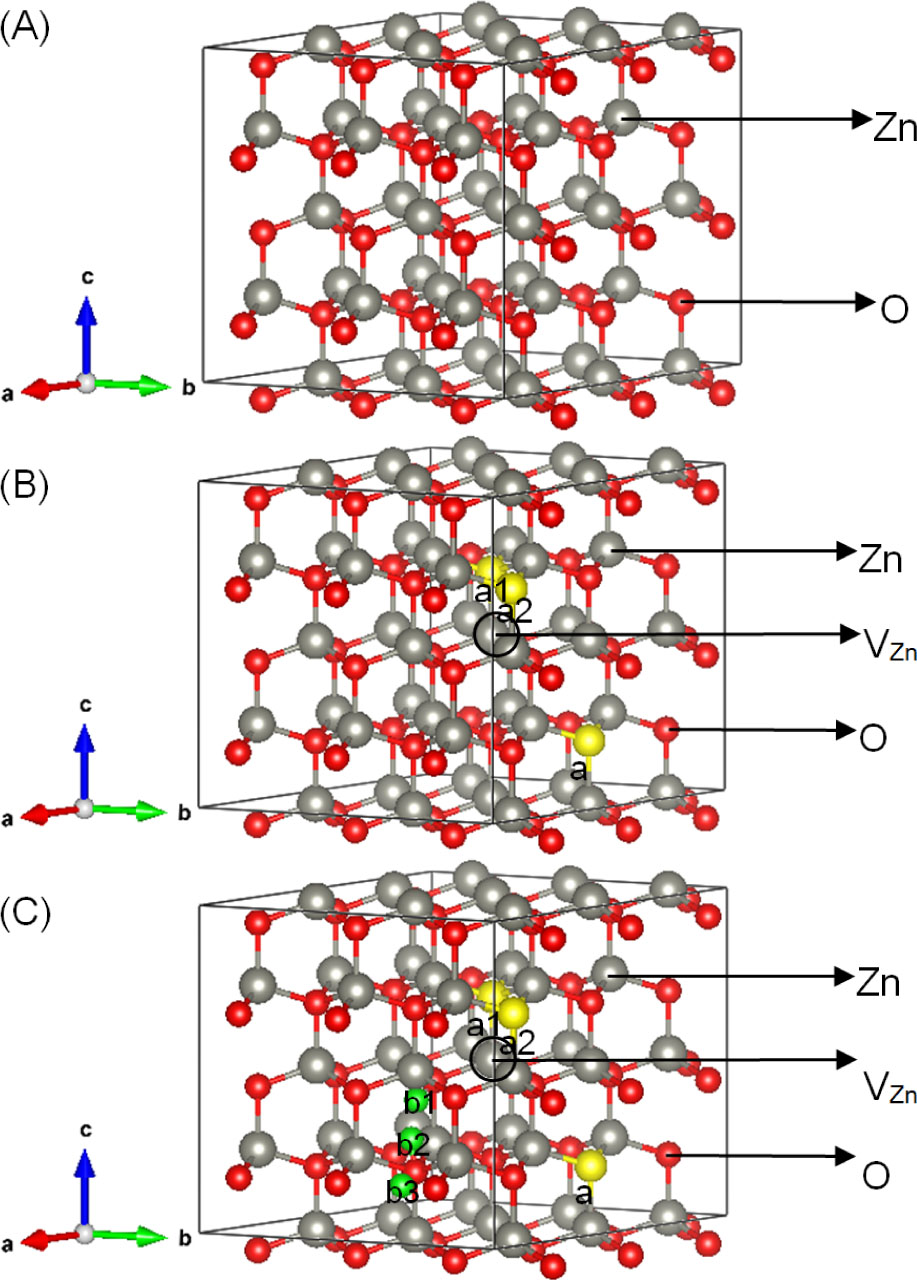
Fig. 1
Model: (A) Zn36O36, (B) Zn35RO35 (R = S/Se/Te), and (C) Zn35RHiO35 (R = S/Se/Te).
Gray, red, yellow, and green represent Zn, O, R (R = S/Se/Te), and H atoms, respectively
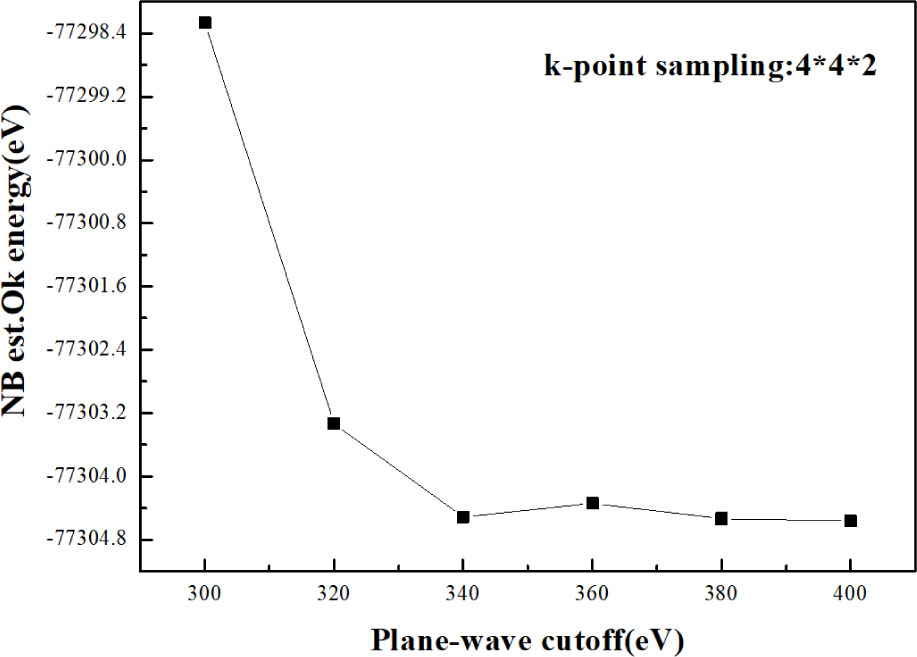
Fig. 2
Relationship between total energy of Zn36O36 and cutoff energy
Table 1
Relative distance d between the replacement atoms and VZn; the reduced lattice constants a and c and volume V of Zn36O36, Zn35RO35 (R = S/Se/Te)a1−a3, and (R = S/Se/Te) doping systems
| Models | dM − VZn (Å) | a (Å) | c (Å) | V (Å3) |
|---|---|---|---|---|
| Zn36O36 | – | a = 3.287 | c = 5.299 | 49.485 |
| 1.992 | a = 3.301 | c = 5.298 | 49.988 | |
| 3.811 | a = 3.303 | c = 4.955 | 50.490 | |
| 4.570 | a = 3.303 | c = 5.334 | 50.385 | |
| 1.992 | a = 3.304 | c = 5.294 | 50.047 | |
| 3.811 | a = 3.307 | c = 5.351 | 50.708 | |
| 4.570 | a = 3.307 | c = 5.338 | 50.584 | |
| 1.992 | a = 3.308 | c = 5.295 | 50.204 | |
| 3.811 | a = 3.316 | c = 5.373 | 51.131 | |
| 4.570 | a = 3.315 | c = 5.344 | 50.927 | |
| 1.992 | a = 3.307 | c = 5.316 | 50.332 | |
| 1.992 | a = 3.332 | c = 5.289 | 50.427 | |
| 1.992 | a = 3.314 | c = 4.968 | 50.546 | |
| 1.992 | a = 3.309 | c = 5.316 | 50.402 | |
| 1.992 | a = 3.334 | c = 5.286 | 50.468 | |
| 1.992 | a = 3.316 | c = 5.317 | 50.607 | |
| 1.992 | a = 3.317 | c = 5.322 | 50.620 | |
| 1.992 | a = 3.345 | c = 5.293 | 50.690 | |
| 1.992 | a = 3.325 | c = 5.322 | 50.825 |
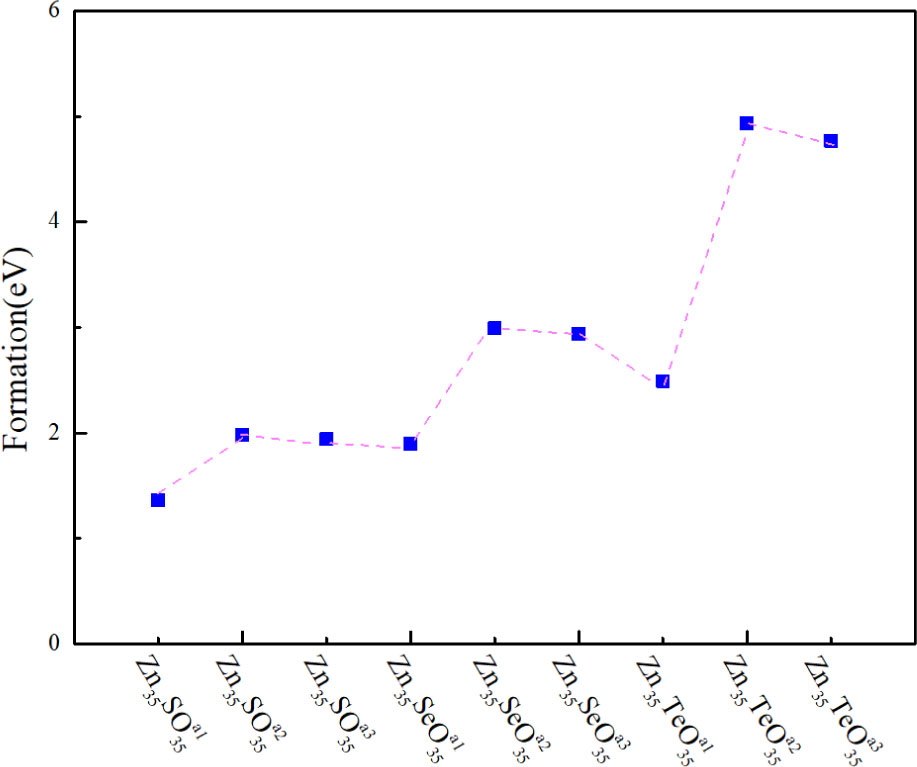
Fig. 3
Formation energies of (R = S/Se/Te) systems with different relative distances between R substitution atoms and VZn
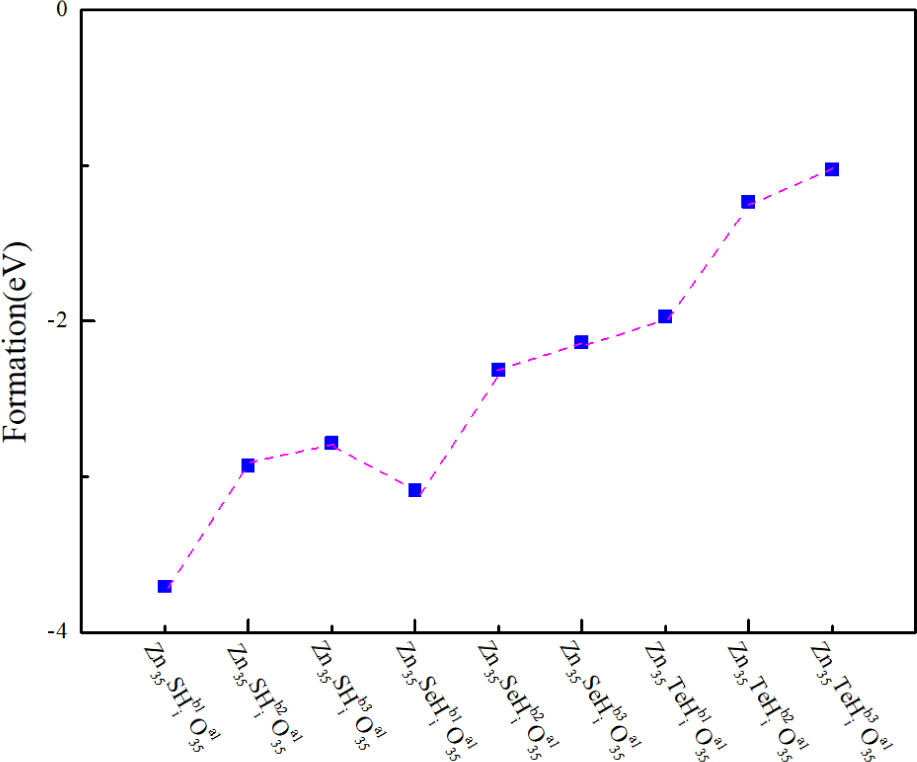
Fig. 4
Formation energies of the (R = S/Se/Te) system with different positions of b1, b2, and b3 in the Hi
Table 2
Effective mass, elastic modulus, deformation potential, and hole mobility of Zn35RO35 (R = S/Se/Te) and Zn35RHiO35 (R = S/Se/Te) systems
| Models | Direction | mh*·mo−1 | c3D (×1011J·m−2) | EI(eV) | μh (cm2·V−1·s−1) |
|---|---|---|---|---|---|
| Zn36O36 | ‖ a | 0.22 | 0 | 0 | 0 |
| 0.21 [35] | 0 | 0 | 0 | ||
| ‖ c | 0.17 | 0 | 0 | 0 | |
| 0.24 [35] | 0 | 0 | 0 | ||
| Zn35SO35 | ‖ a | 6.91 | 54.17 | 5.07 | 103.60 |
| ‖ c | 137.89 | 43.12 | 4.54 | 0.058 | |
| Zn35SeO35 | ‖ a | 35.93 | 68.79 | 2.80 | 6.698 |
| ‖ c | 744.99 | 67.35 | 2.77 | 0.004 | |
| Zn35TeO35 | ‖ a | 7.23 | 123.73 | 44.74 | 2.707 |
| ‖ c | 5.06 | 136.331 | 46.96 | 6.625 | |
| Zn35SHiO35 | ‖ a | 19.70 | 82.69 | 2.96 | 33.795 |
| ‖ c | 10.31 | 57.79 | 2.47 | 170.383 | |
| Zn35SeHiO35 | ‖ a | 12.02 | 95.64 | 20.54 | 2.79 |
| ‖ c | 2.25 | 71.01 | 17.70 | 183.061 | |
| Zn35TeHiO35 | ‖ a | 9.69 | 118.47 | 38.63 | 1.674 |
| ‖ c | 1.74 | 104.50 | 36.28 | 122.634 |
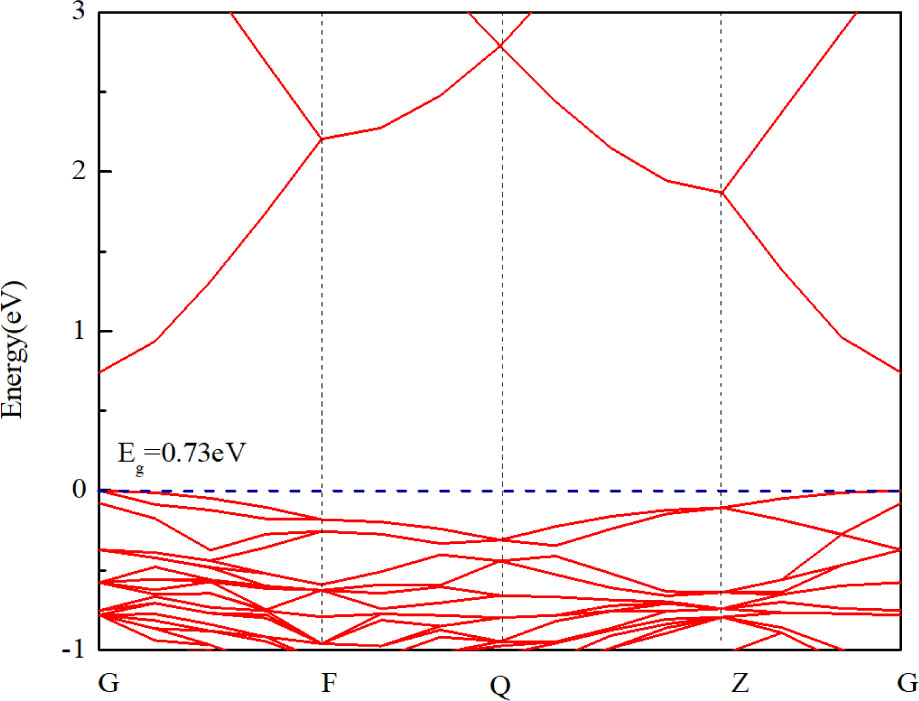
Fig. 5
Band structure of pure Zn36O36
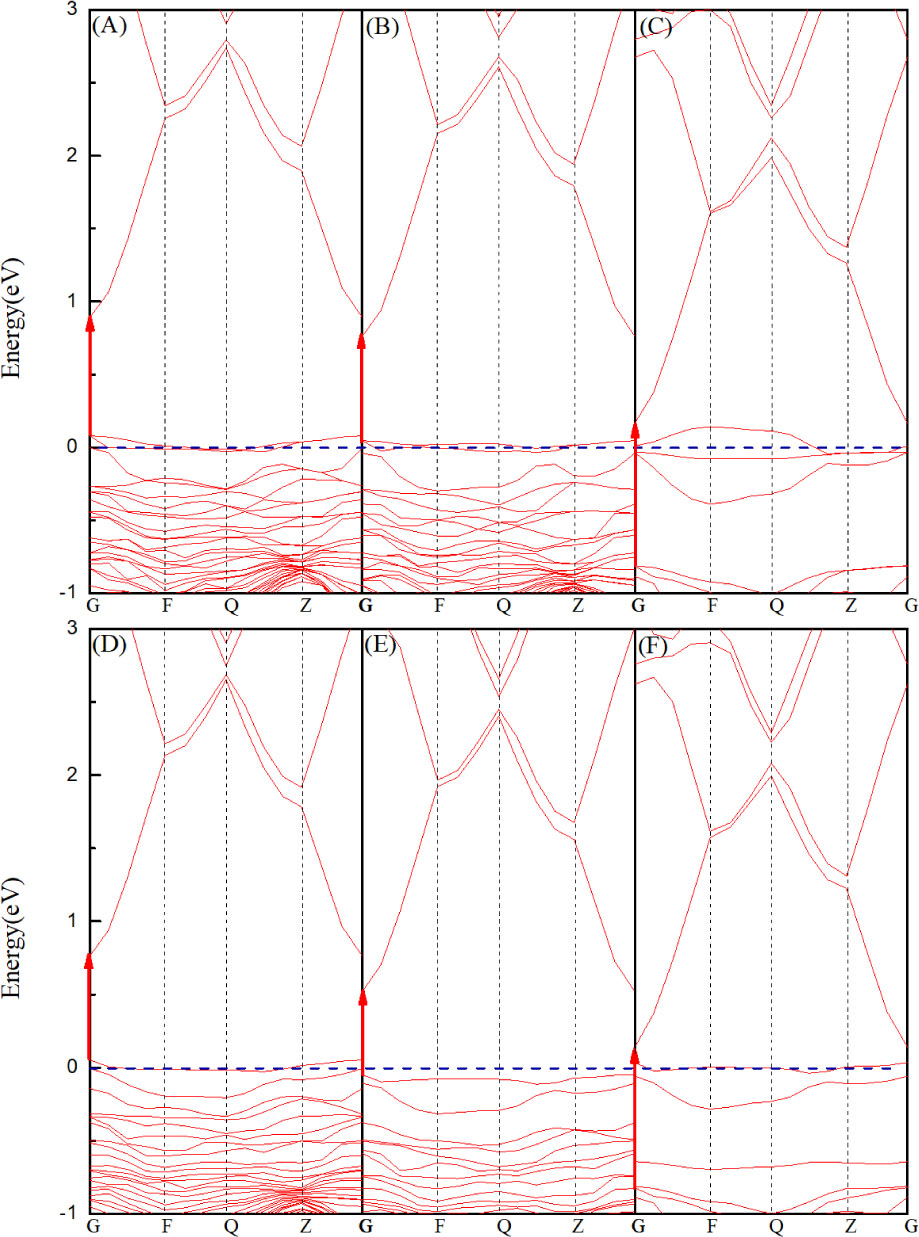
Fig. 6
Band structure distribution: (A) Zn35SO35; (B) Zn35SeO35; (C) Zn35TeO35; (D) Zn35SHiO35; (E) Zn35SeHiO35; and (F) Zn35TeHiO35
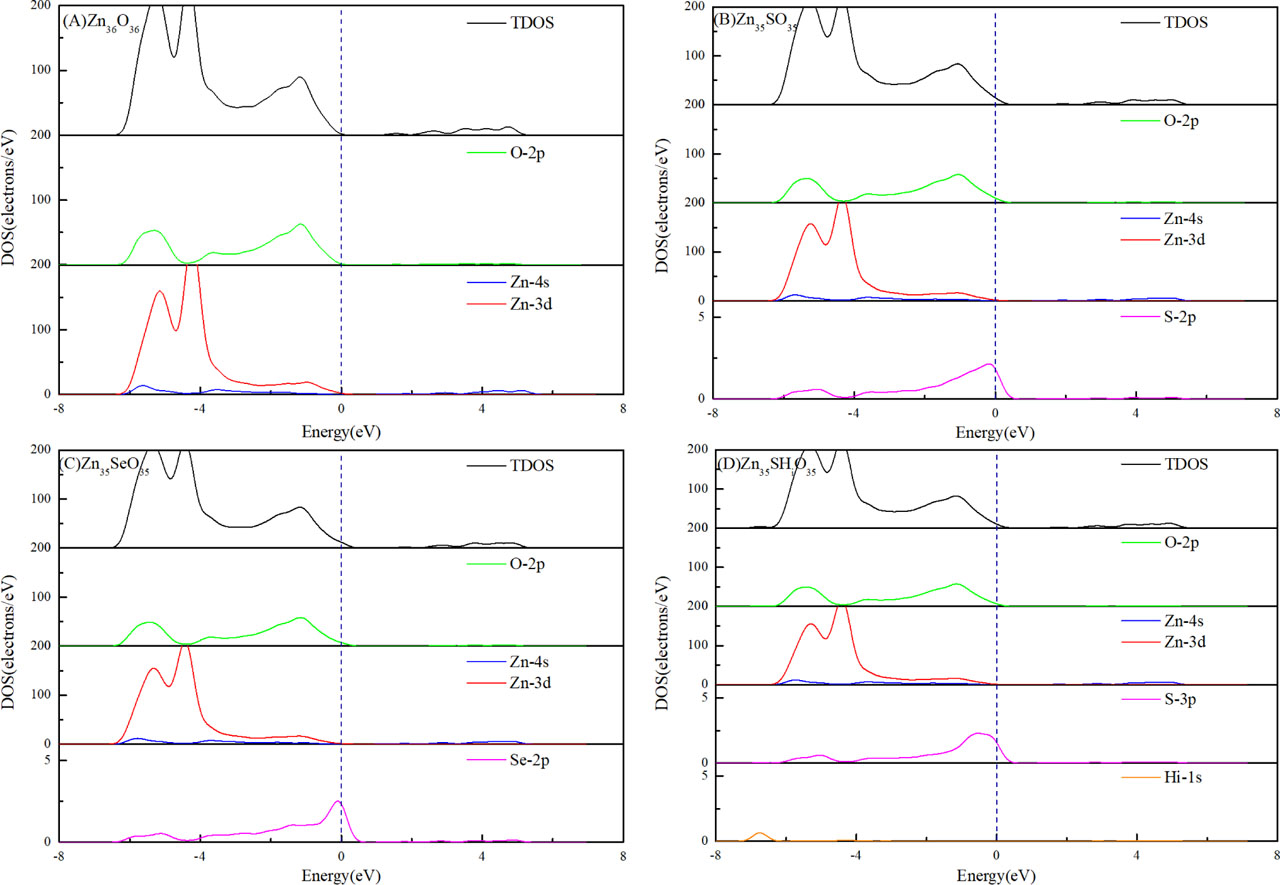
Fig. 7
DOS analysis diagram: (A) Zn36O36, (B) Zn35SO35, (C) Zn35SeO35, and (D) Zn35SHiO35. DOS, density of states