
ZnO exhibits high exciton binding energy (60 meV) [1] and electron mobility [2] at room temperature. It finds wide-ranging applications, including in light-emitting diodes, blue light, UV light-emitting devices [3,4,5], etc. However, the high resistivity and poor stability of ZnO limit its application in the design of intrinsic ZnO optoelectronic devices, and obtaining high-quality p-type ZnO semiconductors remains a significant challenge [6].
Studies have shown that the valence band top remarkably shifts after doping S/Se/Te in ZnO, which provides a great possibility to achieve the p-ZnO [7]. Experimentally, Niu et al. [8] investigated the electrical properties of sulfur on the effect of S/N doped ZnO thin films by radio-frequency (RF) magnetron sputtering. The study showed that p-type semiconductor was actualized in S-doped ZnO. Dib et al. [9] investigated the transport properties of the ZnSxO1−x using the sol–gel method. The results showed that S doping leads to a large increase in the charge carrier concentration in the ZnO system. When x = 0.1, the maximum charge concentration of acceptor carriers is NA = 2.139×1022 cm−3 and the mobility μ = 16.2610×10⁻¹⁰ cm2·V−1·s−1. Cai et al. [10] studied the p-type conductivity of Se–N co-doped ZnO films by RF magnetron sputtering. The study indicated that under the same growth and annealing conditions, ZnO:N has n-type conductivity, whereas ZnO:Se-N has p-type conductivity, and the hole concentration reaches 4×10⁻¹⁶ cm−3. Tang et al. [11] investigated the p-type conductivity of N single-doped and Te–N co-doped ZnO by metal-organic chemical vapor deposition (MOCVD). It is found that the hole carrier concentration of the Te–N co-doped ZnO is remarkably higher than that of N-doped ZnO. Park et al. [12] investigated the p-type conductivity of Te–N co-doped ZnO system by molecular beam epitaxy. It is found that N-doped ZnO exhibits n-type, whereas Te–N co-doped ZnO transforms to p-type, and the hole concentration reaches 4×10⁻¹⁶ cm−3.
Theoretically, Persson et al. [13] used the first-principle approaches to study the effect of p-type ZnO in the ZnO1−xSx system. The results showed that S doping leads to a remarkable upward shift in the valence band top of ZnO and a decrease in bulk ionization energy, which improves the doping efficiency and stability of p-type ZnO. Hou et al. [14] used the first-principle approaches to investigate the effect of triaxial strain on the p-type conductivity of a ZnO (S, Se, Te) system. The research showed that the Zn36RO35 (R = S/Se/Te) systems exhibit p-type conductivity, and the hole mobility increases when −5% compressive strain is applied. There are relatively few theoretical calculations from the literature dealing with the effect of S/Se/Te doped ZnO on electrical conductivity.
Some progress has been made in the study of S/Se/Te doping on the p-type conductivity of ZnO, which can solve the bottleneck problem that severely limits the p-type conductivity of ZnO [6,7,8,9,10,11,12,13,14]. While there are studies in the literature (such as those of Liu et al. [15] and Zeng et al. [16]) delving into the benefits that a Zn vacancy (VZn) can bring in terms of enabling ZnO to achieve p-type conductivity, these, for the most part, lack theoretical calculations.. Second, previous experimental studies [7,8,9,10,11,12,13,14] have ignored the fact that in the process of semiconductor preparation, when the chemical vapor deposition method and the molecular beam epitaxial growth method are used in the vacuum environment, the H-gap impurities will inevitably remain in the ZnO matrix [17]. The study of VZn under experimental conditions poses a challenge. Therefore, it is necessary to systematically study the effects of equivalent element S/Se/Te doping and VZn–H gap (Hi) on the electrical conductivity of ZnO. Hence, this research has practical importance and academic value.
This paper is based on the hexagonal wurtzite structure of ZnO with symmetry
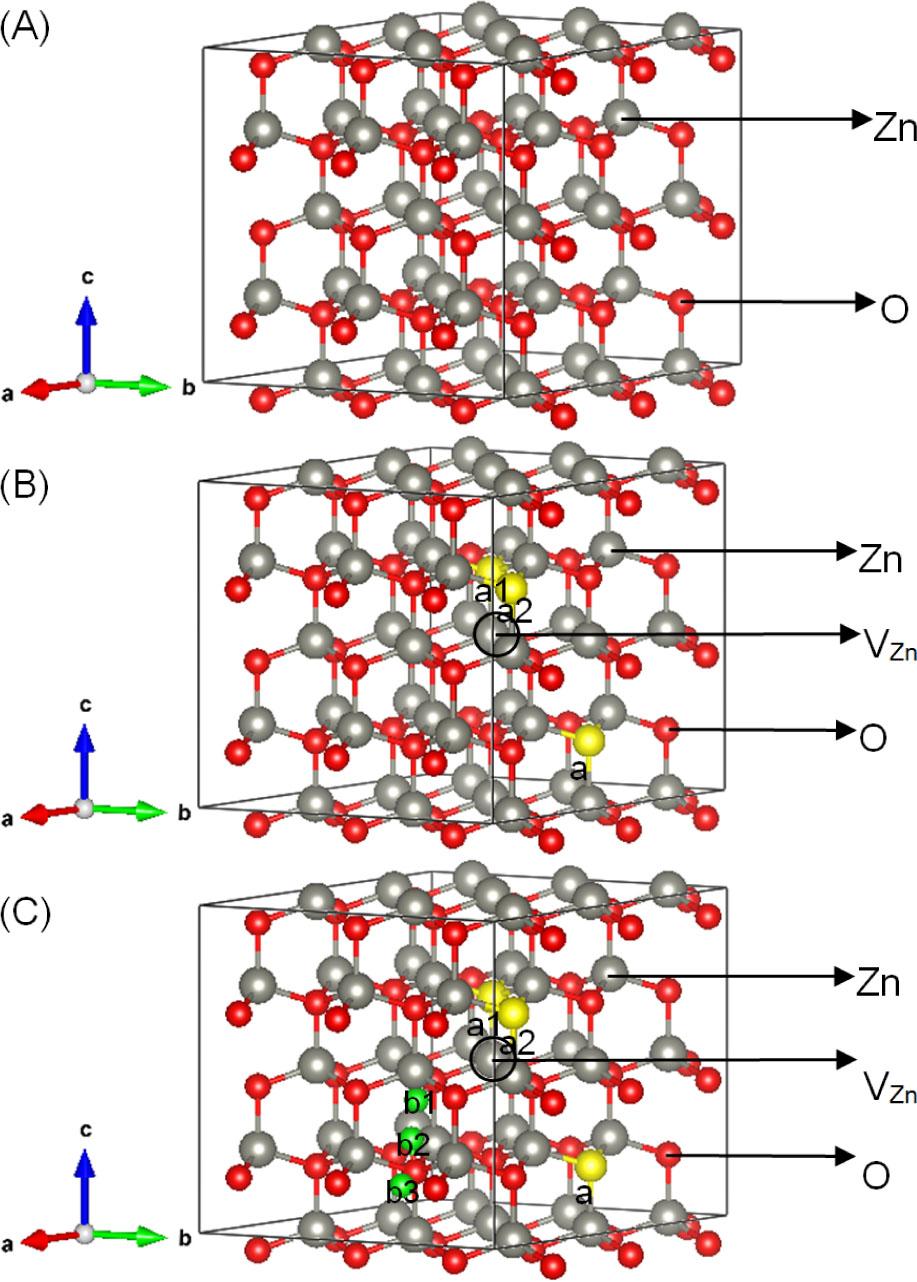
Model: (A) Zn36O36, (B) Zn35RO35 (R = S/Se/Te), and (C) Zn35RHiO35 (R = S/Se/Te).
Gray, red, yellow, and green represent Zn, O, R (R = S/Se/Te), and H atoms, respectively
This paper uses the CASTEP (8.0) module in MS for calculations. Based on density functional theory (DFT) [23], generalized gradient approximation (GGA) was adopted [24], and the plane wave supersoft pseudopotential method based on Perdew–Burke–Ernzerhof (PBE) functional was selected [25]. The plane wave cutoff energy was set to 340 eV. The effect of different cutoff energies on the energy convergence of undoped Zn36O36 was tested. Figure 2 indicates that when the cutoff energy reaches 340 eV, the energy of the system converges and tends to be stable, and so the choice of a cutoff energy of 340 eV used in this paper may be said to be reasonable. This is consistent with previous calculations of the energy cutoff radius [26, 27]. The k point sampling of the first Brillouin zone was 4×4×2. The maximum interatomic force, maximum internal stress, and tolerance shift convergence accuracy were 0.01 eV·Å−1, 0.02 GPa, and 0.0005 Å, respectively. The electron density is not spin polarized, and the charge was set to values adapted to a given case. The valence electron configuration of each atom is: S–3s23p4, Se–4s24p4, Te–5s25p4, Zn–3d104s2, O–2s22p4, and H–1s1.
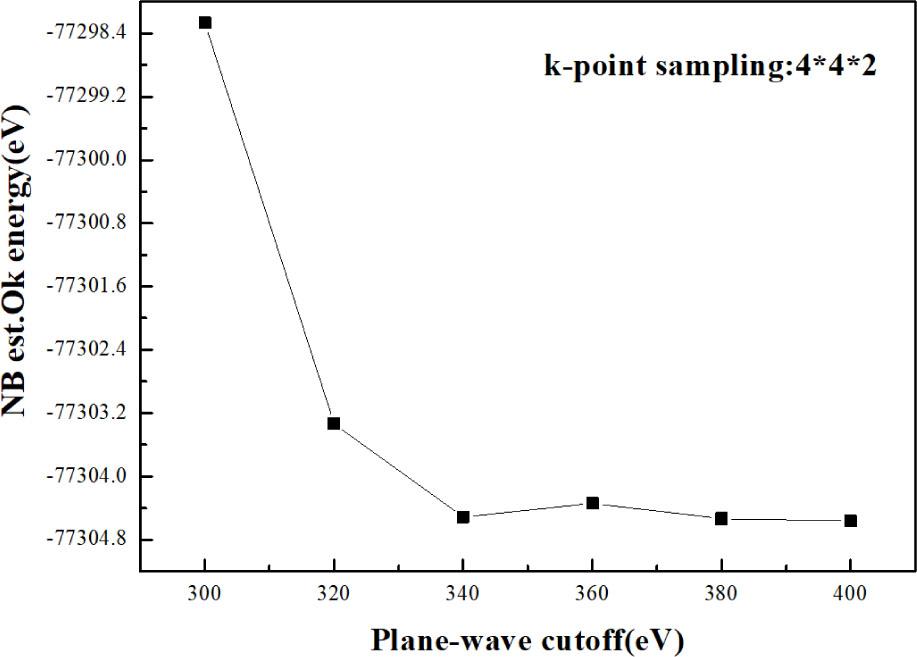
Relationship between total energy of Zn36O36 and cutoff energy
The doped Zn36O36, Zn35RO35 (R = S/Se/Te), and Zn35RHiO35 (R = S/Se/Te) systems were geometrically optimized, and the optimized results are listed in Table 1. The calculated lattice constants of the Zn36O36 system are in good agreement with the experimental values of a = b = 3.258 Å and c = 5.220 Å [28]. The rationality underlying the choice of parameters employed in this study is verified.
Relative distance d between the replacement atoms and VZn; the reduced lattice constants a and c and volume V of Zn36O36, Zn35RO35 (R = S/Se/Te)a1−a3, and
| Models | dM − VZn (Å) | a (Å) | c (Å) | V (Å3) |
|---|---|---|---|---|
| Zn36O36 | – | a = 3.287 | c = 5.299 | 49.485 |
|
| 1.992 | a = 3.301 | c = 5.298 | 49.988 |
|
| 3.811 | a = 3.303 | c = 4.955 | 50.490 |
|
| 4.570 | a = 3.303 | c = 5.334 | 50.385 |
|
| 1.992 | a = 3.304 | c = 5.294 | 50.047 |
|
| 3.811 | a = 3.307 | c = 5.351 | 50.708 |
|
| 4.570 | a = 3.307 | c = 5.338 | 50.584 |
|
| 1.992 | a = 3.308 | c = 5.295 | 50.204 |
|
| 3.811 | a = 3.316 | c = 5.373 | 51.131 |
|
| 4.570 | a = 3.315 | c = 5.344 | 50.927 |
|
| 1.992 | a = 3.307 | c = 5.316 | 50.332 |
|
| 1.992 | a = 3.332 | c = 5.289 | 50.427 |
|
| 1.992 | a = 3.314 | c = 4.968 | 50.546 |
|
| 1.992 | a = 3.309 | c = 5.316 | 50.402 |
|
| 1.992 | a = 3.334 | c = 5.286 | 50.468 |
|
| 1.992 | a = 3.316 | c = 5.317 | 50.607 |
|
| 1.992 | a = 3.317 | c = 5.322 | 50.620 |
|
| 1.992 | a = 3.345 | c = 5.293 | 50.690 |
|
| 1.992 | a = 3.325 | c = 5.322 | 50.825 |
Table 1 showed that the a, c, and V of Zn35RO35 (R = S/Se/Te) and Zn35RHiO35 (R = S/Se/Te) were larger than those of Zn36O36. One reason for this finding is attributable to the radius effect: the S/Se/Te ionic radius (2.14/2.24/2.42 Å) [29] is larger than the O ionic radius (1.71 Å) [29]. The second reason is the interionic force: the repulsive force between VZn and O, R (R = S/Se/Te) is greater than the attractive force between VZn and Zn in the Zn35RO35 (R = S/Se/Te) systems; the repulsive forces between H and VZn, between VZn and O, and between VZn and R (R = S/Se/Te) are greater than the attraction force between O and H, VZn and H, and H and R (R = S/Se/Te) in the Zn35RHiO35 (R = S/Se/Te) systems. Therefore, the volume of the Zn35RO35 (R = S/Se/Te) and Zn35RHiO35 (R = S/Se/Te) systems increases. Table 1 shows that compared with the
The formation energies of all the doped systems were calculated to analyze the stability of doped systems. The calculation formula is expressed as the following in the literature [30, 31]:
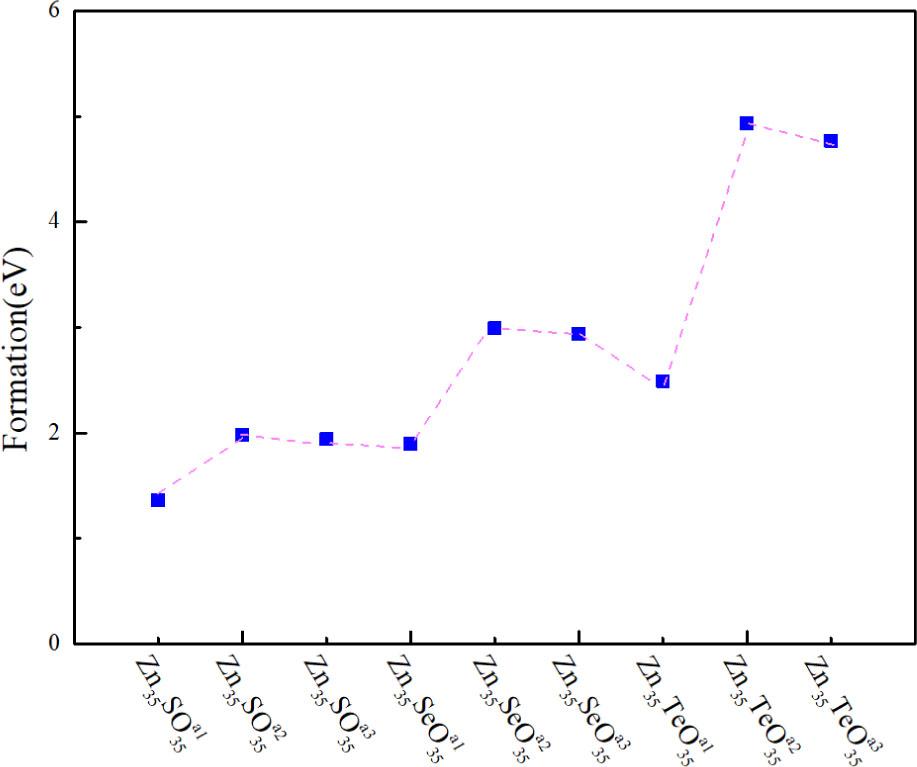
Formation energies of
The system with the lowest formation energy in the Zn35RHiO35 (R = S/Se/Te) system was selected, and the formation energies of the b1, b2, and b3 positions of the Hi were calculated to explore the effect of the Hi position on the stability of the ZnO. The results are shown in Figure 4. The figure shows that the Ef of the Zn35RHiO35 (R = S/Se/Te) system also increased gradually with the increase in the distance between Hi and VZn. The formation energy of the
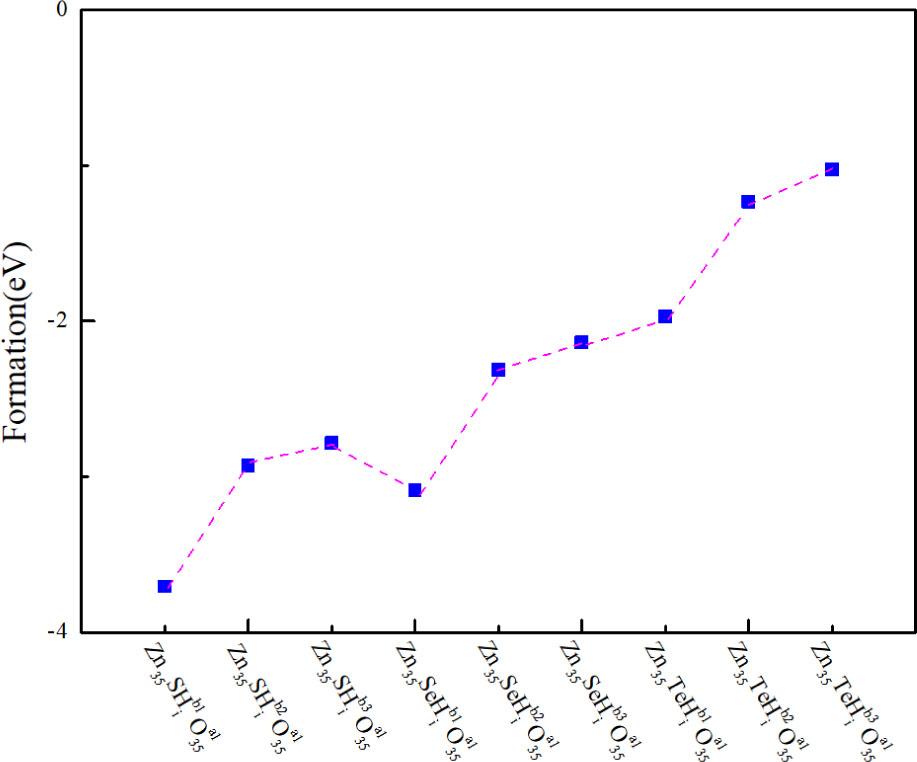
Formation energies of the
Considering the structural stability of the system, the most stable
Mobility is an important parameter used to measure the conductivity of a system. The p-type conductivity of the system is proportional to the hole mobility. A higher hole mobility indicates that the p-type conductivity of a system is better. The hole mobility formula [33, 34] is:
Effective mass, elastic modulus, deformation potential, and hole mobility of Zn35RO35 (R = S/Se/Te) and Zn35RHiO35 (R = S/Se/Te) systems
| Models | Direction | mh*·mo−1 | c3D (×1011J·m−2) | EI(eV) | μh (cm2·V−1·s−1) |
|---|---|---|---|---|---|
| Zn36O36 | ‖ a | 0.22 | 0 | 0 | 0 |
| 0.21 [35] | 0 | 0 | 0 | ||
| ‖ c | 0.17 | 0 | 0 | 0 | |
| 0.24 [35] | 0 | 0 | 0 | ||
| Zn35SO35 | ‖ a | 6.91 | 54.17 | 5.07 | 103.60 |
| ‖ c | 137.89 | 43.12 | 4.54 | 0.058 | |
| Zn35SeO35 | ‖ a | 35.93 | 68.79 | 2.80 | 6.698 |
| ‖ c | 744.99 | 67.35 | 2.77 | 0.004 | |
| Zn35TeO35 | ‖ a | 7.23 | 123.73 | 44.74 | 2.707 |
| ‖ c | 5.06 | 136.331 | 46.96 | 6.625 | |
| Zn35SHiO35 | ‖ a | 19.70 | 82.69 | 2.96 | 33.795 |
| ‖ c | 10.31 | 57.79 | 2.47 | 170.383 | |
| Zn35SeHiO35 | ‖ a | 12.02 | 95.64 | 20.54 | 2.79 |
| ‖ c | 2.25 | 71.01 | 17.70 | 183.061 | |
| Zn35TeHiO35 | ‖ a | 9.69 | 118.47 | 38.63 | 1.674 |
| ‖ c | 1.74 | 104.50 | 36.28 | 122.634 |
Table 2 shows that the hole mobilities of the Zn35RO35 (R = S/Se/Te) and Zn35RHiO35 (R = S/Se/Te) systems are anisotropic. This result is attributable to the fact that ZnO has unipolarity, and therefore, the mobility of the system is different along different transport directions. In the Zn35RO35 (R = S/Se/Te) and Zn35RHiO35 (R = S/Se/Te) systems, the hole mobilitiy of the Zn35SO35 system along the a-axis was the highest, and the hole mobilities of the Zn35SeHiO35 system along the c-axis were the highest. Table 2 displays that in tandem with the unintentional incorporation of Hi, the hole mobility of the doped system decreases along the a direction and increases along the c direction. The results showed that the unintentional incorporation of the Hi can greatly increase the mobility of the doping system along the c direction, but it is not conducive to the mobility along the a direction.
The calculated band structure of pure Zn36O36 system is shown in Figure 5. The bandgap of the pure Zn36O36 system is 0.73 eV, which is close to the calculated result available from the literature [37], but inconsistent with the experimental value (3.37 eV). This is because the energy of Zn–3d is overestimated when the architecture is calculated using GGA, resulting in an underestimation of the bandgap [38]. However, this error has little effect on the analysis of the relative physical quantities of the ZnO system.
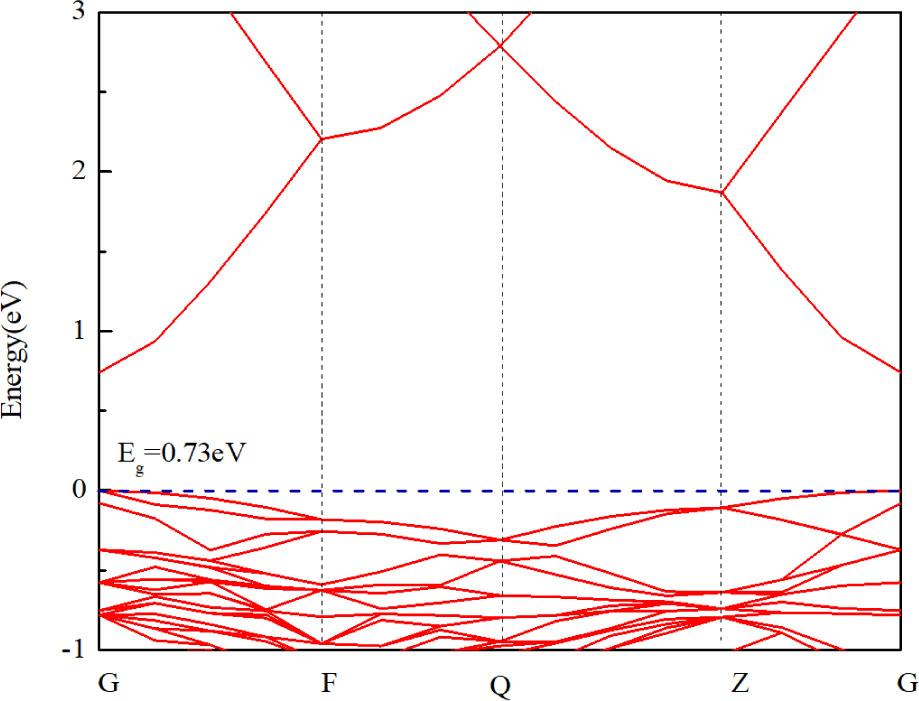
Band structure of pure Zn36O36
The calculated band structures of the Zn35RO35 (R = S/Se/Te) and Zn35RHiO35 (R = S/Se/Te) systems are shown in Figures 6A–6F.
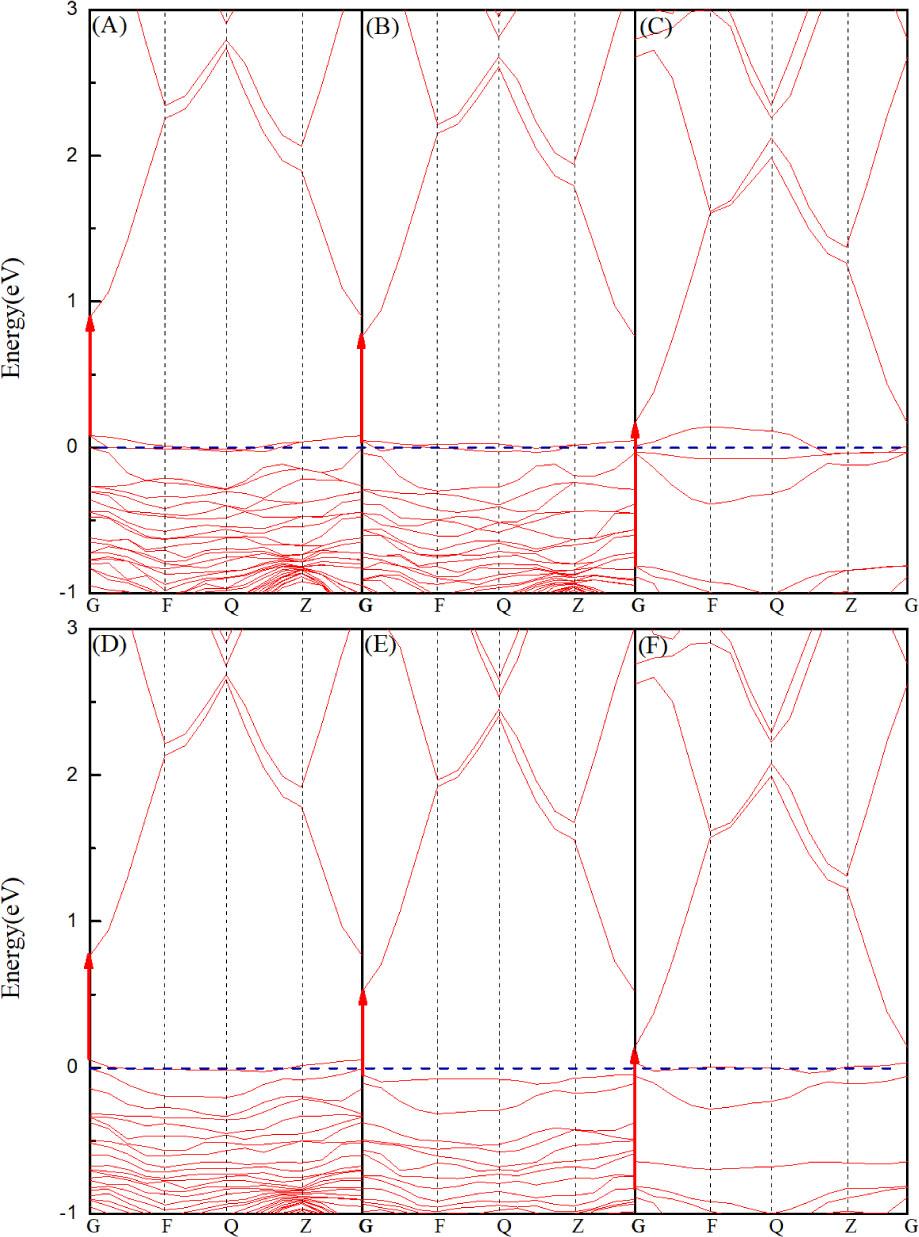
Band structure distribution: (A) Zn35SO35; (B) Zn35SeO35; (C) Zn35TeO35; (D) Zn35SHiO35; (E) Zn35SeHiO35; and (F) Zn35TeHiO35
According to Figures 6A–6F, the valence band maximum (VBM) and conduction band minimum (CBM) of the doped systems correspond to the same high symmetry point, which indicates that they are all direct bandgap semiconductors. The figures indicate that R (R = S/Se/Te) and Hi lead to remarkable changes in the valence and conduction bands of the system. Among them, the VBM and CBM of the Zn35SO35, Zn35SeO35, and Zn35SHiO35 systems moved up, the Fermi level entered the valence band, and the systems were the p-type semiconductor. However, the VBM and CBM of the Zn35TeO35, Zn35SeHiO35, and Zn35TeHiO35 systems moved down, and the Fermi level was located between the valence and conduction bands, indicating that no p-type degeneracy had occurred. Therefore, studying the electrical conductivities of the Zn35TeO35, Zn35SeHiO35, and Zn35TeHiO35 systems will be meaningless; accordingly, these three systems were not further studied.
The total density of states (DOS) and partial density of states (PDOS) of the Zn36O36, Zn35SO35, Zn35SeO35, and Zn35SHiO35 systems were calculated to study the effect of doping defects on the hole concentration of the ZnO system (Figures 7A–7D).
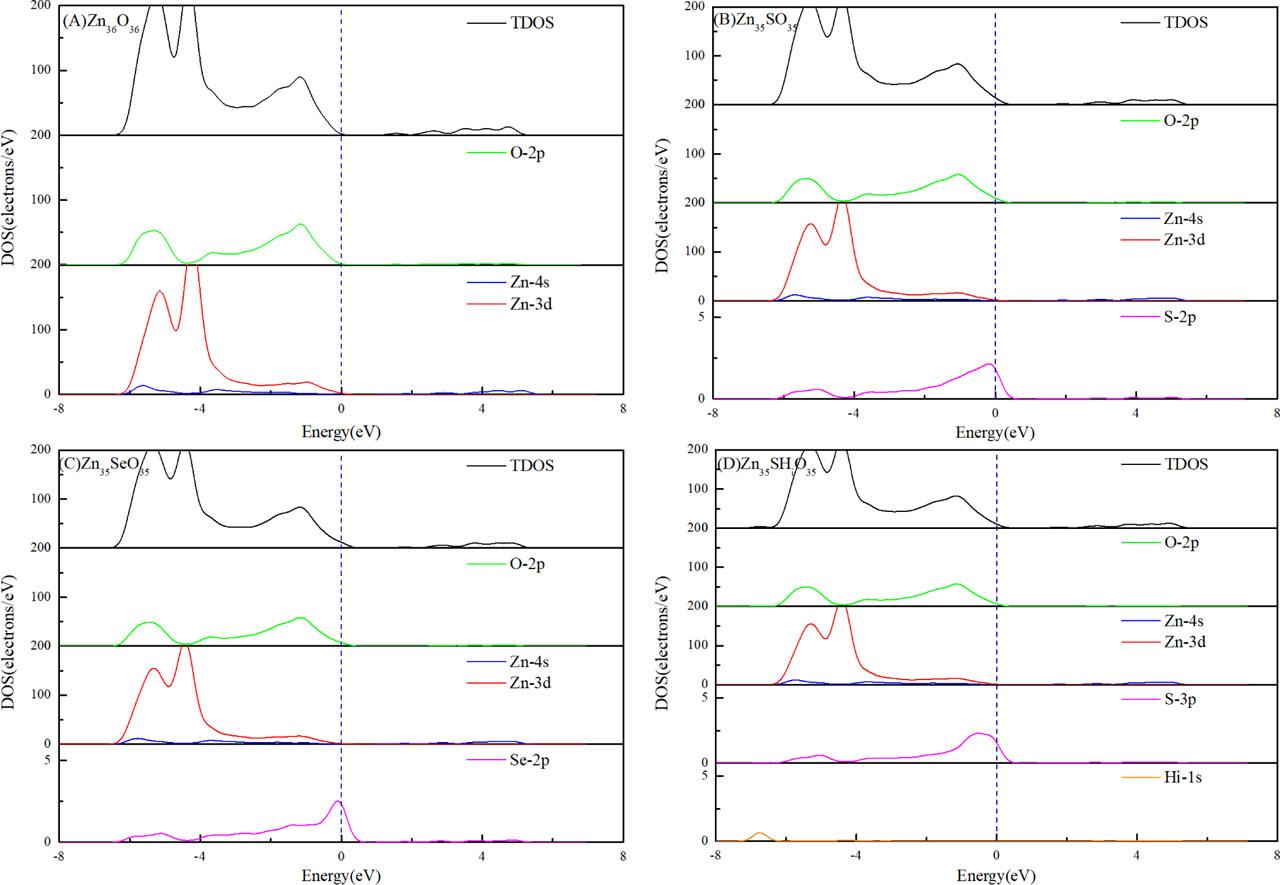
DOS analysis diagram: (A) Zn36O36, (B) Zn35SO35, (C) Zn35SeO35, and (D) Zn35SHiO35. DOS, density of states
Figures 7A–7D illustrate that the O–2p state in the Zn36O36 system determines the VBM, and the Zn–4s state determines the CBM. Its Fermi level did not enter the valence band and was not a p-type degeneracy semiconductor. The Fermi levels of the Zn35SO35, Zn35SeO35, and Zn35SHiO35 systems entered the valence band, which indicates that they are all p-type semiconductors. This is consistent with the analysis results in Section 3.3.
Figures 7B and 7C indicate that the upper valence bands of the Zn35SO35 and Zn35SeO35 systems in the range of −3 eV to 0 eV were formed by the hybridization of O–2p and a small amount of Zn–3d state orbital. The lower valence band from −6 eV to −3 eV was formed by the hybridization of Zn–3d and a small amount of O–2p orbitals. The electrons in the O–2p and S–3p/Se–4p states occupy the vicinity of the Fermi level, and p–p state coupling occurs and the VBM moves up. This is because the atomic number of O group elements increases, which leads to the rise of the p-state energy level and the rise of the VBM. The carriers were degenerated, and the system exhibited p-type conductivity. The calculation results showed that S/Se doping is beneficial to the transition of the ZnO system from a natural n-type semiconductor to a p-type semiconductor.
Figure 7D shows that the valence band of the Zn35SHiO35 system was formed by the coupling of O–2p, Zn–3d, and S–2p state orbits. Near the Fermi level, p–p state coupling occurs between the p-state orbital of S and the p-state orbital of O, the VBM moves up, and the Fermi level enters the valence band. The reason is the same as above. Notably, Figure 7D shows that the H–1s state contributes to the DOS near −7 eV. This result indicates that the doping of Hi affects the low-valence band region and does not contribute much to the electronic states near the Fermi level.
Another reference factor that cannot be ignored when exploring the conductivity of p-type semiconductors is the hole concentration. In this paper, as shown in Figures 7B–7D, Origin 8.5 software was used to integrate the part of the DOS beyond the Fermi level, and the hole concentration Pi is equal to the integral value divided by the total volume of the doped system. The calculation results are shown in Table 3.
Hole concentrations of the Zn36O36, Zn35SO35, Zn35SeO35, and Zn35SHiO35 systems
| Models | Pi (×1021 cm−3) |
|---|---|
| Zn36O36 | 0 |
| Zn35SO35 | 2.80 |
| Zn35SeO35 | 2.42 |
| Zn35SHiO35 | 1.74 |
Table 3 shows that the hole concentrations of the Zn35SO35 and Zn35SeO35 systems were considerably higher than that of the Zn35SHiO35 system. The result was due to VZn as the acceptor, and the donor Hi needs to suppress and compensate for VZn. Therefore, the hole concentration of the Zn35SHiO35 system decreased. Among the doped systems, the Zn35SO35 system had the highest hole concentration of 2.80×1021 cm−3 and the best conductivity.
The conductivity calculation formula of a p-type semiconductor is expressed in the literature [39] as the following:
Conductivities of the Zn36O36, Zn35SO35, Zn35SeO35, and Zn35SHiO35 systems
| Models | σi (×102 S·cm−1) | |
|---|---|---|
| G→ F | G→ Z | |
| Zn36O36 | 0 | 0 |
| Zn35SO35 | 464.39 | 0.26 |
| Zn35SeO35 | 27.08 | 0.014 |
| Zn35SHiO35 | 94.04 | 474.11 |
Table 4 shows that the conductivity of the pure Zn36O36 system is 0. Compared with the conductivity of the Zn36O36 system, the conductivities of the Zn35SO35, Zn35SeO35, and Zn35SHiO35 systems were remarkably higher. The calculation results showed that the Zn35SO35, Zn35SeO35, and Zn35SHiO35 systems were all beneficial in terms of improving the conductivity of the ZnO. The comparison of the Zn35SO35 and Zn35SeO35 systems showed that the conductivity of the S-doped system is remarkably larger than that of the Se-doped system, indicating that S doping is more beneficial in terms of improving the p-type conductivity of ZnO. The comparison of the Zn35SO35 and Zn35SHiO35 systems revealed that Hi doping reduces the conductivity of the doped system along the G→ F direction and increases the conductivity of the doped system along the G→ Z direction, indicating that Hi doping can effectively improve the transport performance of the system along the G→ Z direction. Interestingly, in all the doped systems, the conductivities of the Zn35SO35 and Zn35SHiO35 systems were the largest along the G→ F and G→ Z directions, respectively.
In this paper, the first-principle effects of S/Se/Te doping and the coexistence of VZn and Hi in ZnO were investigated. The study found that Te doping cannot achieve the p-type degeneracy of the ZnO system, which has no research significance, and S/Se doping is beneficial to the p-type degeneracy of the ZnO system, remarkably improving the hole mobility and electrical conductivity. The Zn35SO35, Zn35SeO35, and Zn35SHiO35 systems all have good p-type conductivity. Among them, the Zn35SO35 system has the highest hole concentration along the G→ F direction at 2.80×1021 cm−3, and the best conductivity. The conductivity of the Zn35SHiO35 system was the largest along the G→ Z direction. This result plays a guiding role in obtaining higher-quality p-type ZnO.