
Table 1
Chemical composition of S355JR substrate and Metcoclad 625 powder
| Material designation | C | Mn | Si | P | S | Cr | Ni | Mo | Nb | Al | Cu | Fe |
|---|---|---|---|---|---|---|---|---|---|---|---|---|
| wt.% | ||||||||||||
| S355JR | 0.2 | 1.5 | 0.2–0.5 | Max. 0.04 | Max. 0.04 | Max. 0.3 | Max. 0.3 | - | - | Max. 0.02 | Max. 0.03 | Balance |
| Oerlikon Metcoclad 625 | - | - | - | - | - | 20.0–23.0 | 58.0–63.0 | 8.0–10.0 | 3.0–5.0 | - | - | Max 5.0 |
Table 2
Laser cladding parameters
| Designation | Powder TiC content (vol.%) | Laser power (W) | Speed (m/min) | Powder feed rate (g/mm) |
|---|---|---|---|---|
| M1 M2 | 0 | 2.100 | 0.25 | 0.04 0.05 |
| C1 C2 | 10 | 0.04 0.05 | ||
| C3 C4 | 20 | 0.04 0.05 | ||
| C5 C6 | 40 | 0.04 0.05 |
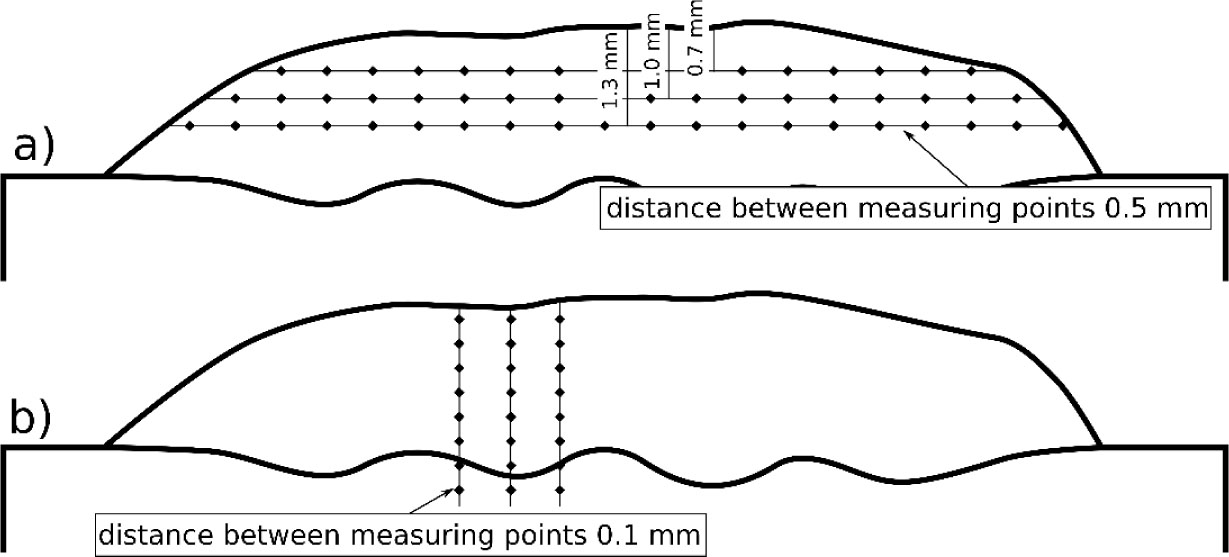
Fig. 1
Vickers microhardness measuring lines scheme: (A) measurements across the beads and (B) measurements from the surface to base material

Fig. 2
Surface view of coatings after penetrant testing: (A) C5 and (B) C6 (designations according to Table 2)
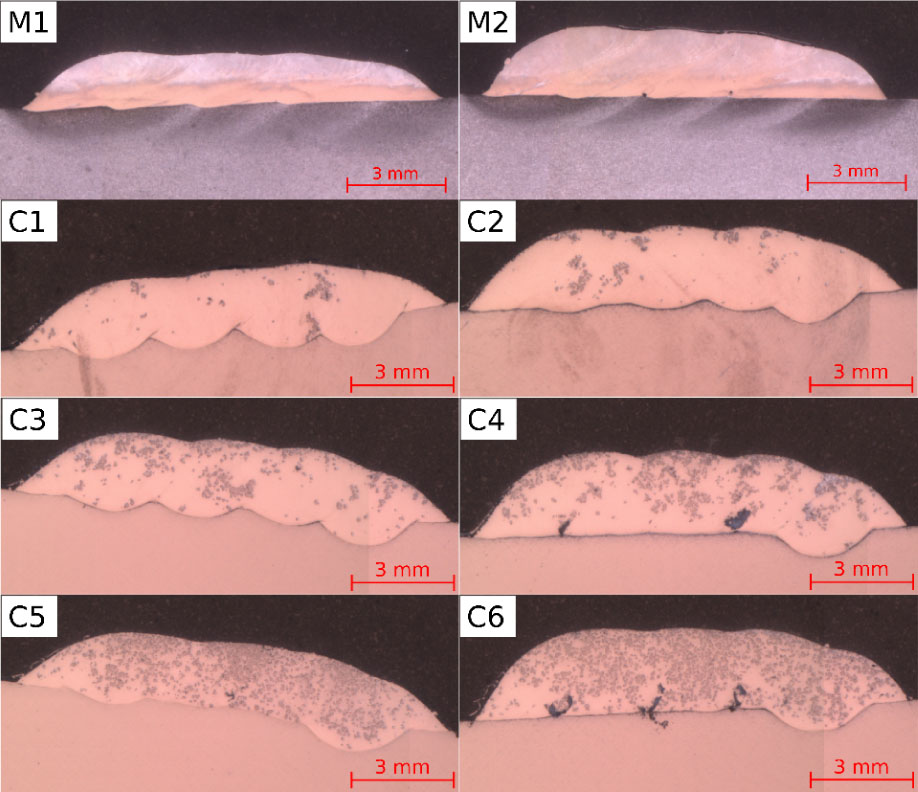
Fig. 3
Macrographs of laser-cladded coatings (designations according to Table 2)
Table 3
Thickness, dilution, and TiC fraction measurement results
| Designation (Table 2) | Thickness (mm) | Dilution (%) | Measured TiC fraction (vol.%) |
|---|---|---|---|
| M1 | 1.6 | 3.3 | - |
| M2 | 2.1 | 2.1 | - |
| C1 | 1.7 | 25.5 | 8.8 |
| C2 | 2.1 | 12.6 | 9.8 |
| C3 | 1.8 | 17.5 | 18.3 |
| C4 | 2.2 | 9.8 | 19.6 |
| C5 | 1.9 | 14.6 | 38.6 |
| C6 | 2.3 | 7.5 | 39.7 |
Table 4
Average chemical composition of coatings
| Designation (Table 2) | Ni | Cr | Mo | Nb | Fe | Ti |
|---|---|---|---|---|---|---|
| wt.% | ||||||
| M1 | 60.7 ± 1.6 | 19.8 ± 0.5 | 10.2 ± 0.8 | 4.6 ± 0.1 | 4.7 ± 1.1 | - |
| M2 | 63.6 ± 0.6 | 20.7 ± 0.3 | 9.5 ± 0.5 | 4.4 ± 0.6 | 1.8 ± 0.3 | - |
| C1 | 49.1 ± 1.1 | 16.2 ± 0.4 | 8.1 ± 0.6 | 4.7 ± 0.4 | 18.0 ± 1.0 | 2.7 ± 0.5 |
| C2 | 54.1 ± 4.7 | 17.6 ± 1.4 | 9.3 ± 1.1 | 4.2 ± 0.9 | 7.9 ± 2.6 | 3.5 ± 1.1 |
| C3 | 50.3 ± 1.3 | 16.6 ± 0.2 | 9.7 ± 1.4 | 3.9 ± 0.3 | 14.4 ± 0.8 | 5.4 ± 2.1 |
| C4 | 55.1 ± 1.9 | 18.1 ± 0.5 | 10.1 ± 1.3 | 5.1 ± 0.2 | 5.1 ± 1.6 | 6.4 ± 1.3 |
| C5 | 44.1 ± 2.9 | 14.1 ± 2.2 | 7.4 ± 0.9 | 4.3 ± 0.5 | 14.5 ± 3.9 | 14.6 ± 3.8 |
| C6 | 47.0 ± 4.9 | 16.0 ± 1.8 | 8.6 ± 1.4 | 4.8 ± 0.8 | 3.3 ± 1.9 | 19.7 ± 8.5 |
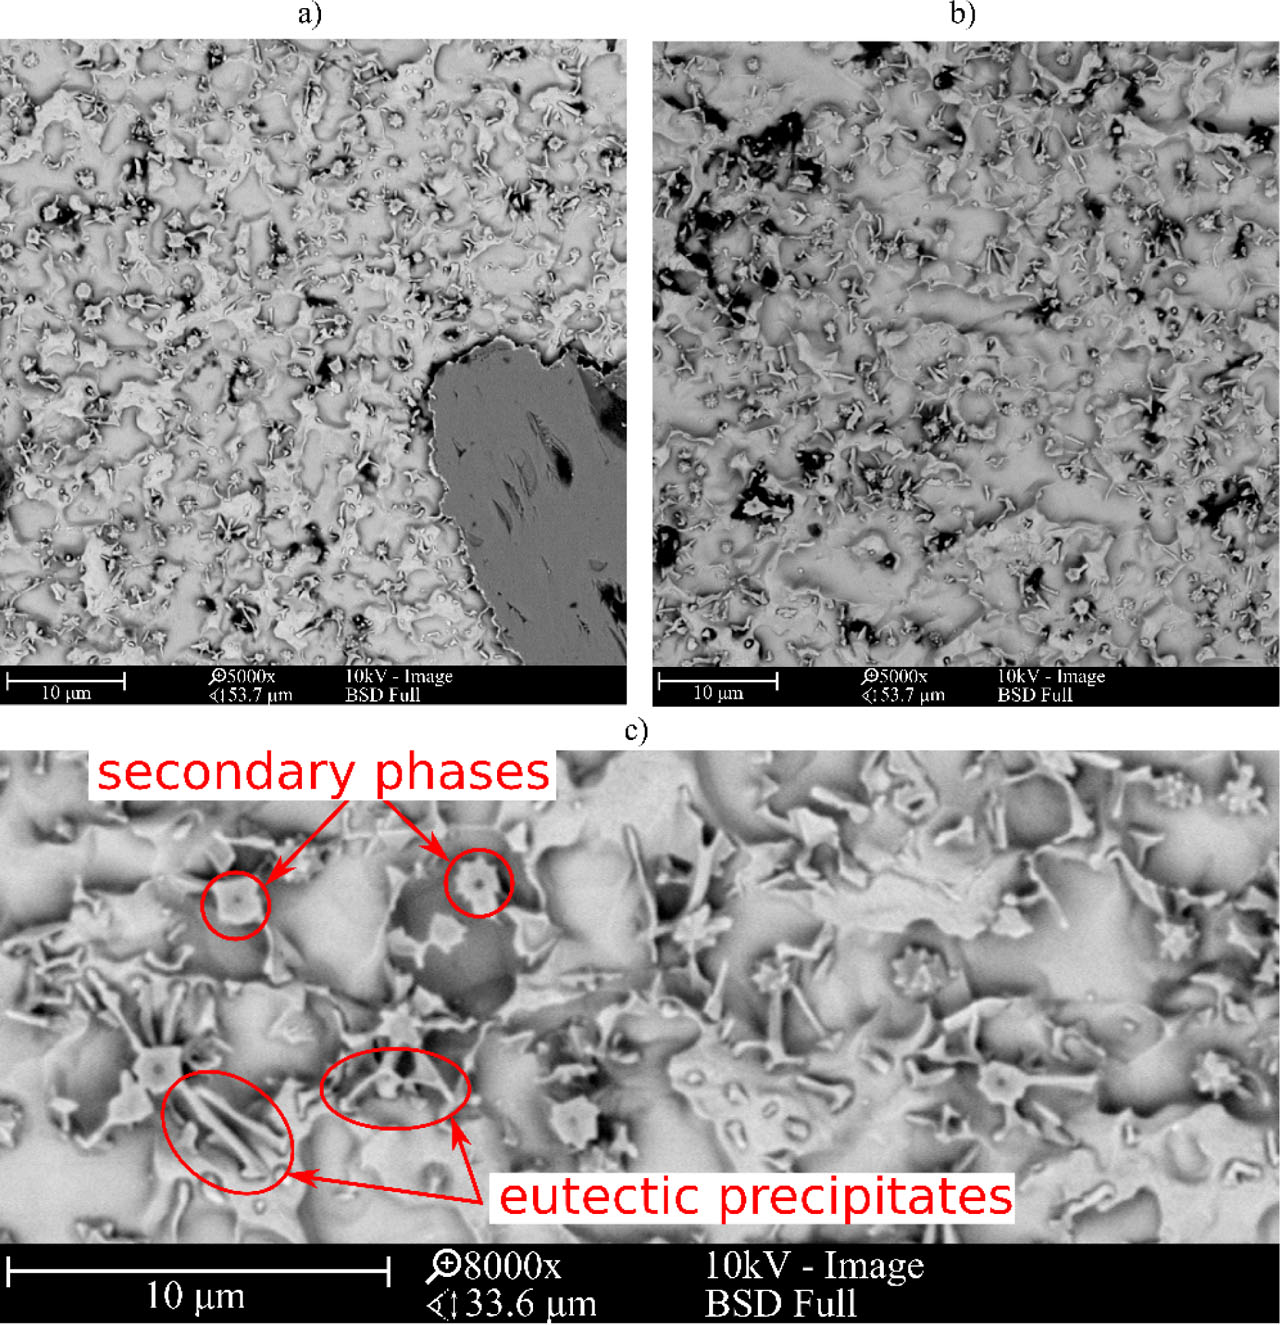
Fig. 4
Microstructure of central bead areas of composite Inconel 625/TiC coatings: (A) C1, (B) C2, and (C) C4 (designation according to Table 3). TiC, titanium carbide
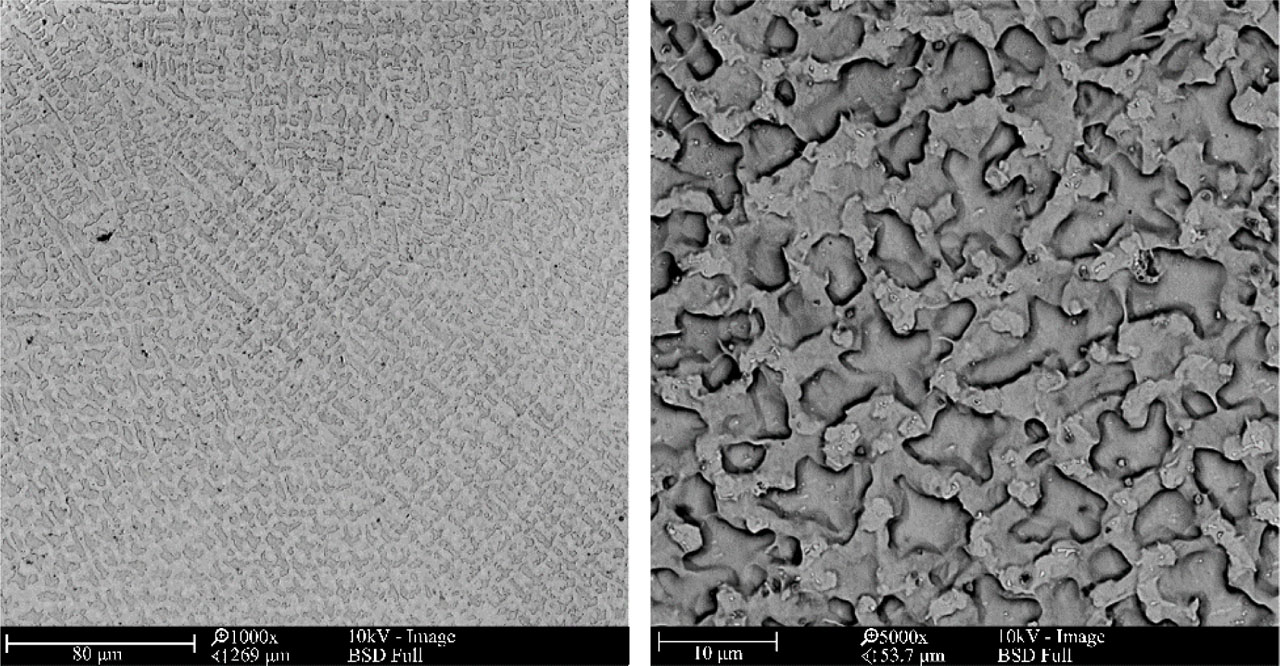
Fig. 5
Microstructure of metallic Inconel 625 coatings
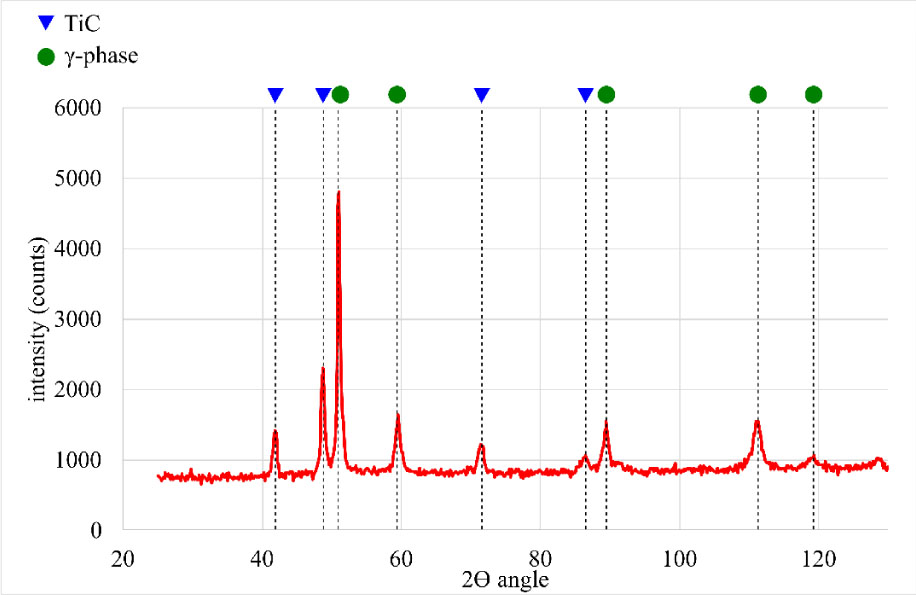
Fig. 6
XRD results of the respective composite Inconel 625/TiC coating. TiC, titanium carbide; XRD, X-ray diffraction
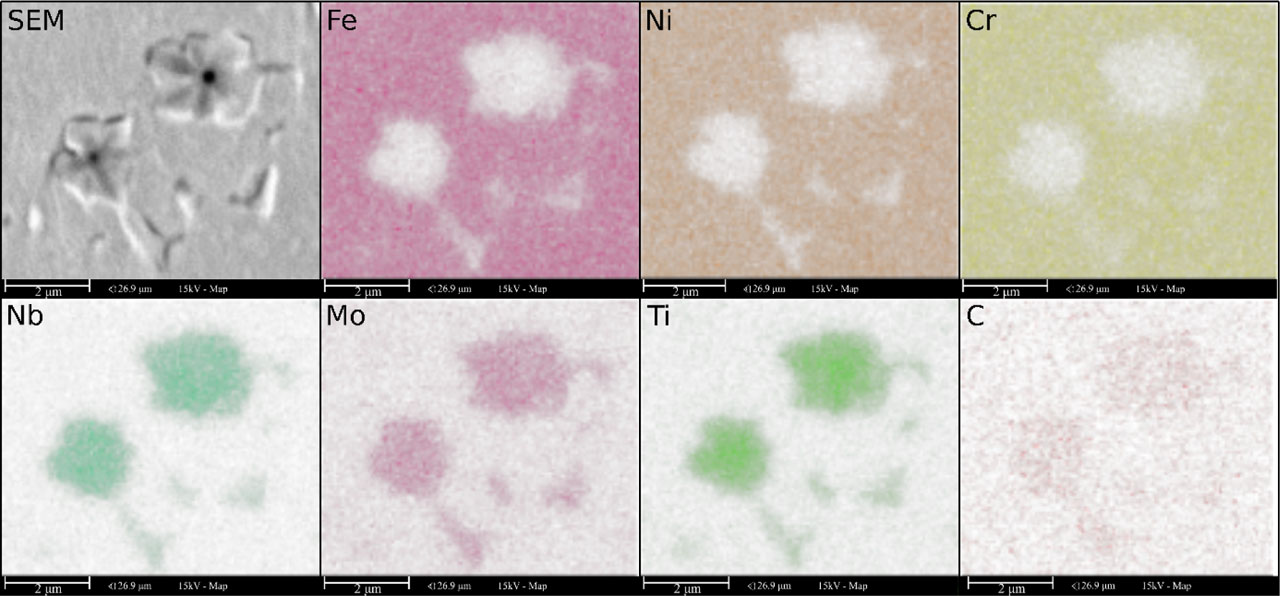
Fig. 7
EDS maps of composite Inconel 625/TiC coating matrix. EDS, energy-dispersive spectroscopy; SEM, scanning electron microscope; TiC, titanium carbide
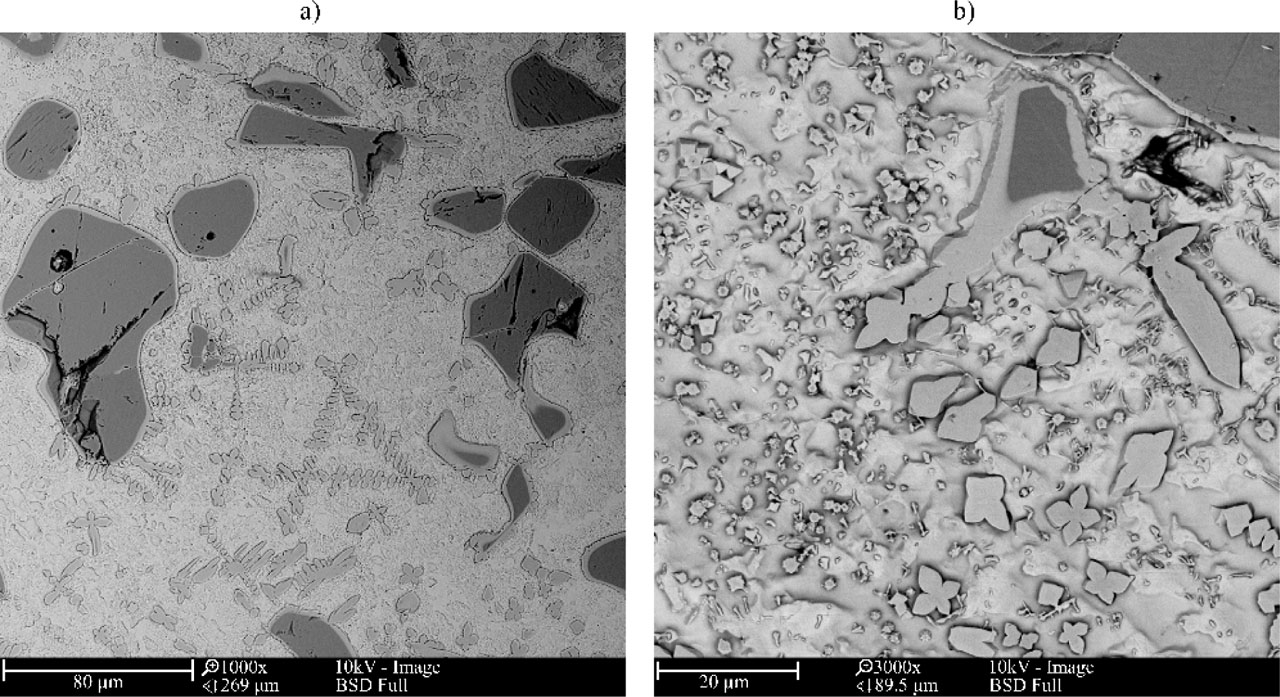
Fig. 8
Microstructure of overlap areas of composite Inconel 625/TiC coatings, magnification a) 1000x, b) 3000x TiC, titanium carbide
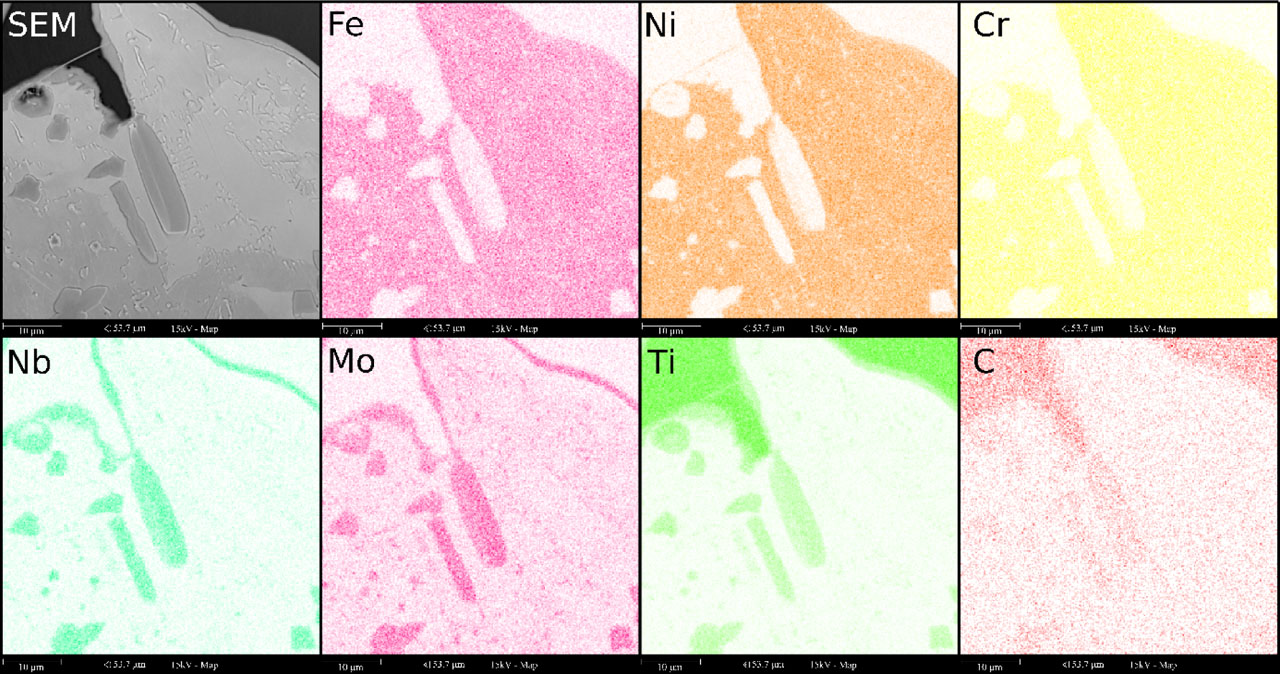
Fig. 9
EDS maps of the overlap area of composite Inconel 625/TiC coatings. EDS, energy-dispersive spectroscopy; SEM, scanning electron microscope; TiC, titanium carbide
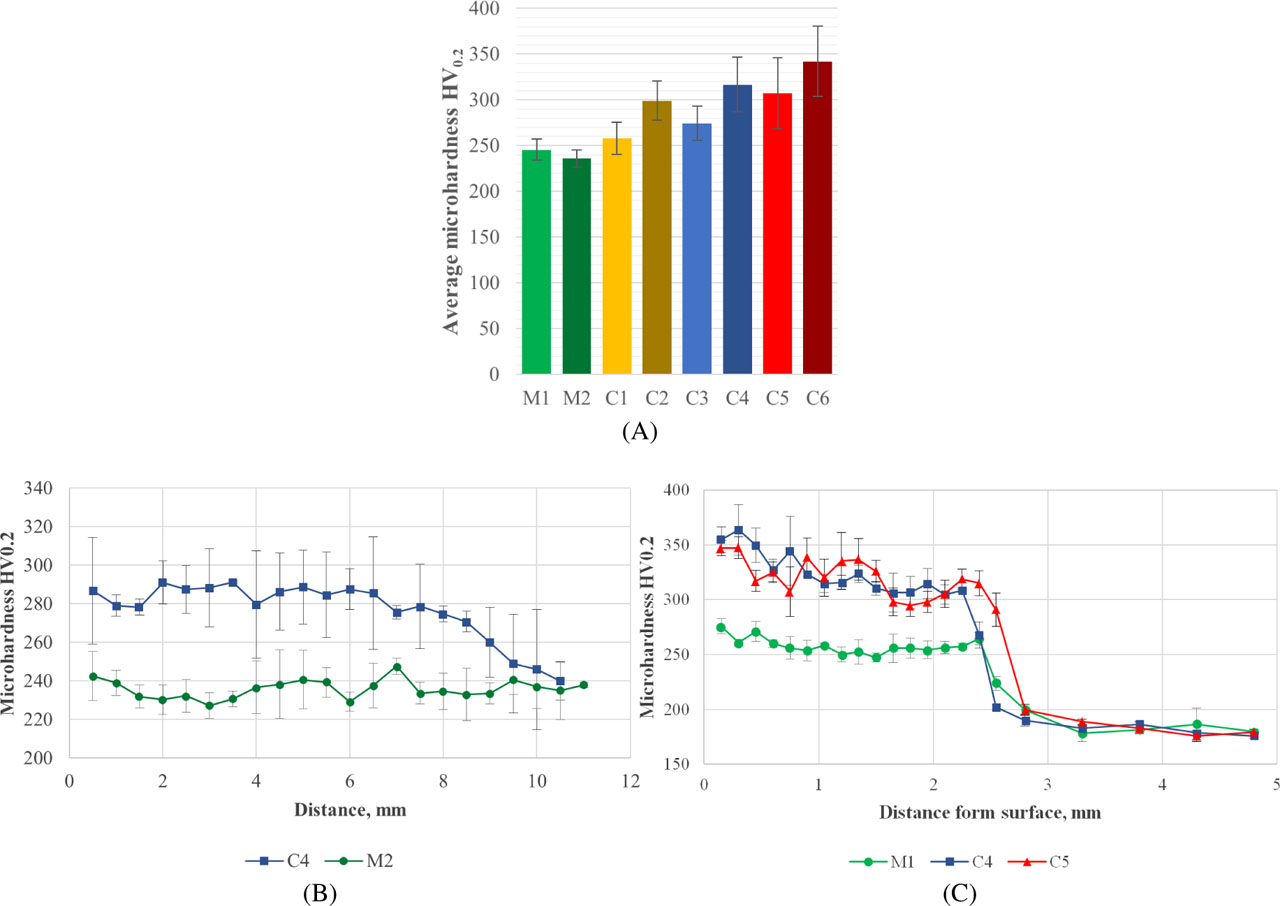
Fig. 10
Vickers microhardness results: (A) average microhardness, (B) microhardness distribution across the beads, and (C) microhardness distribution from the surface to the base material (designation according to Table 3)
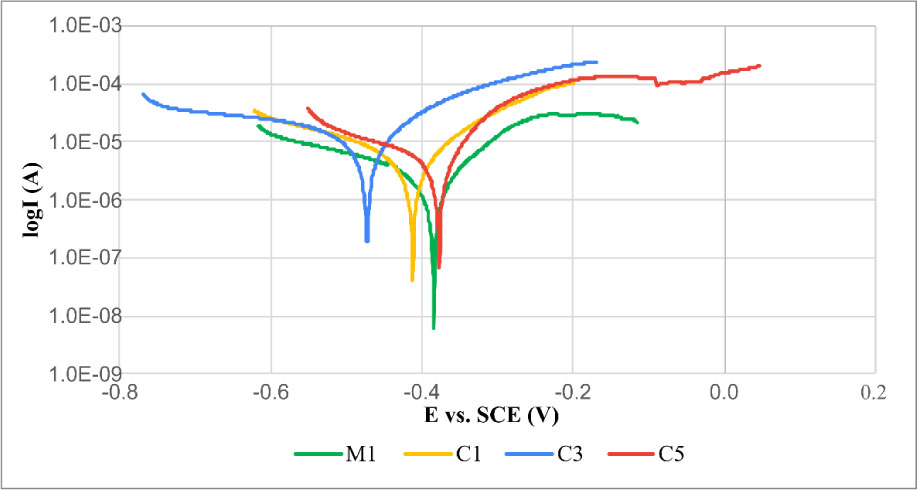
Fig. 11
Potentiodynamic polarization curves of M1, C1, C3, and C5 laser cladded coatings (designation according to Table 3). SCE, saturated calomel electrode
Table 5
Electrochemical parameters of laser-cladded coatings (designation according to Table 2)
| Designation | jcorr (μA/cm2) | Ecorr (V) |
|---|---|---|
| M1 | 8.0 | −0.384 |
| C1 | 12.0 | −0.412 |
| C3 | 83.0 | −0.473 |
| C5 | 8.9 | −0.377 |
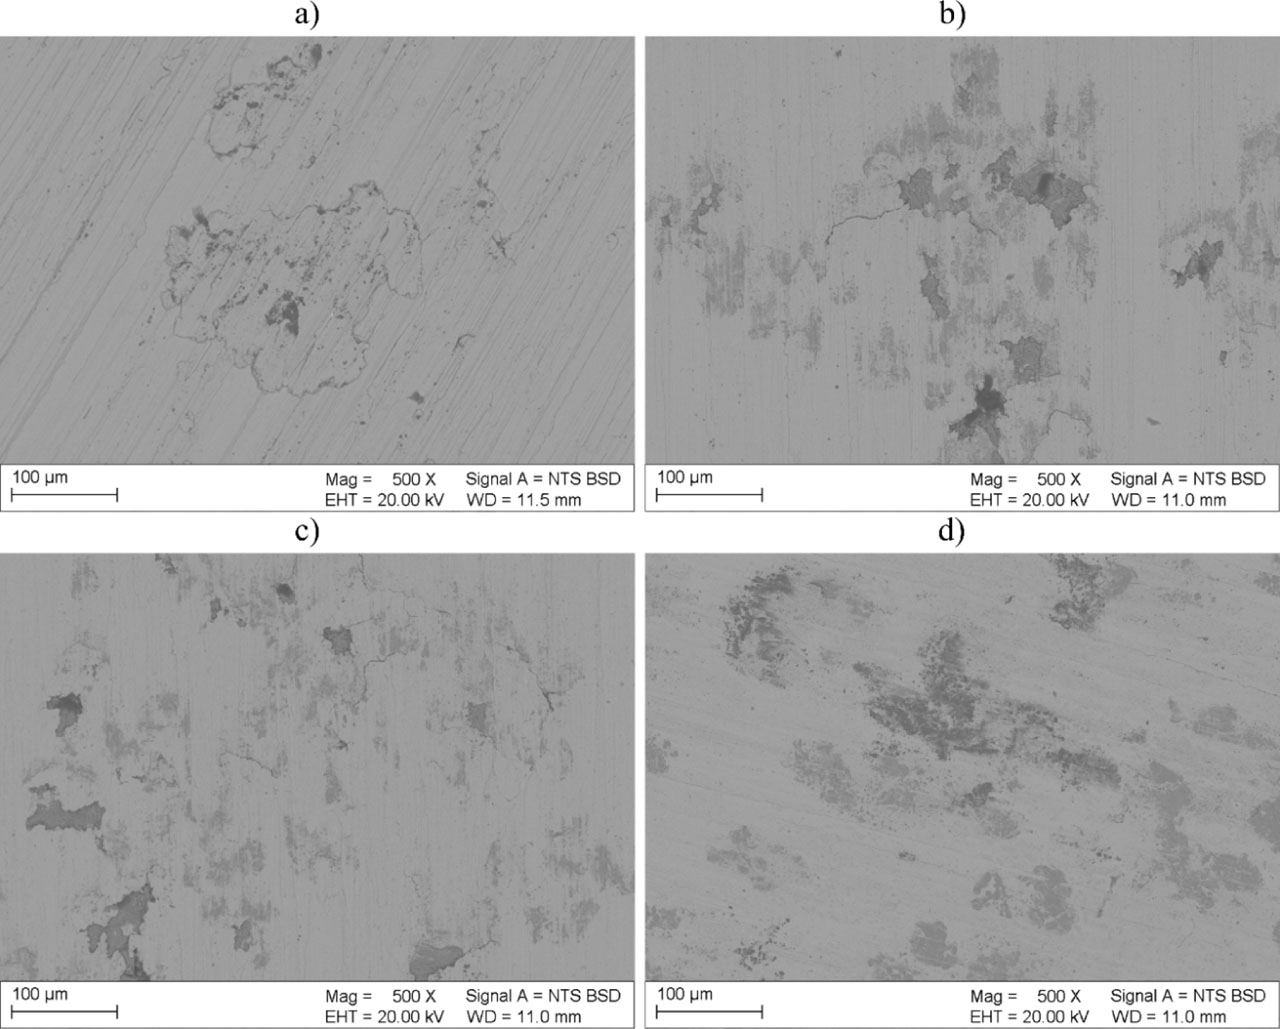
Fig. 12
Morphologies of corrosion damage after potentiodynamic polarization tests, SEM, and coatings: (A) M1, (B) C1, (C) C3, and (D) C5. SEM, scanning electron microscope; EHT, electron high tension voltage; BSD, backscattered electron detector; WD, working distance