
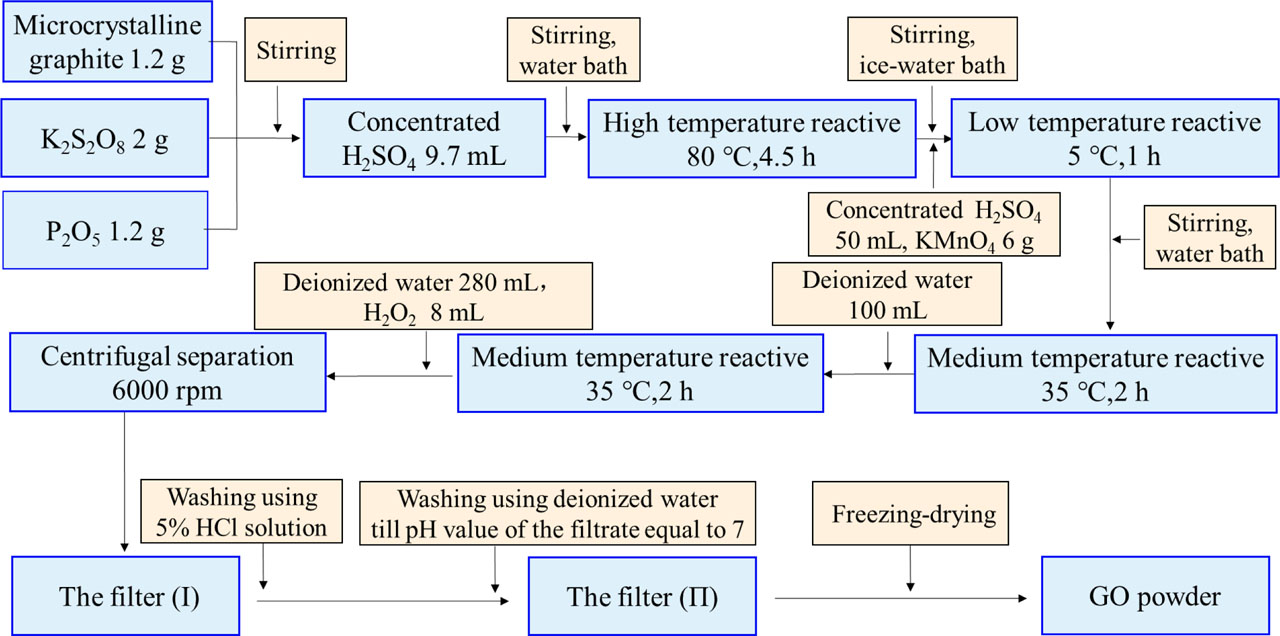
Fig. 1
The schematic diagram of GO preparation process. GO, graphene oxide
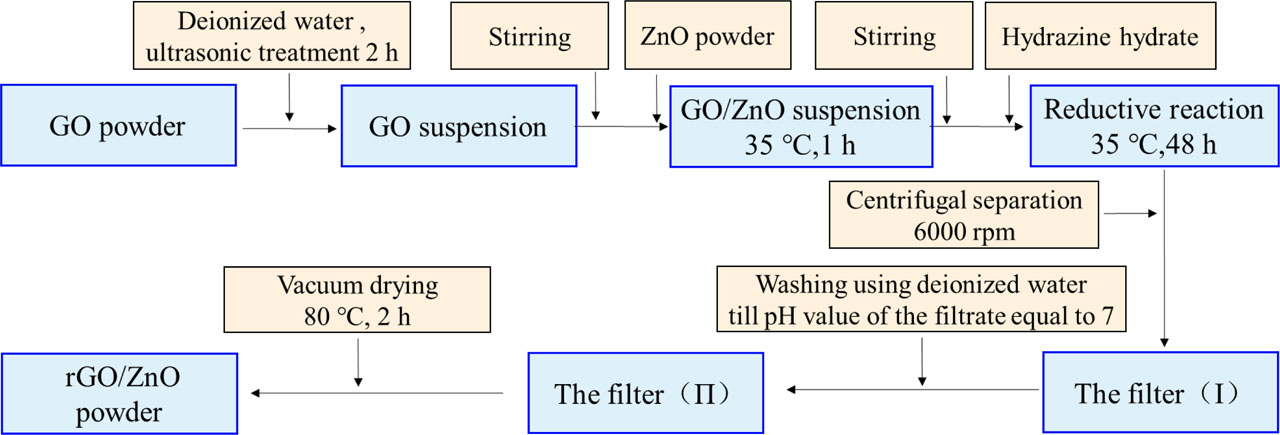
Fig. 2
Schematic diagram of the rGO/ZnO composite powder preparation process. GO, graphene oxide; rGO, reduced graphene oxide
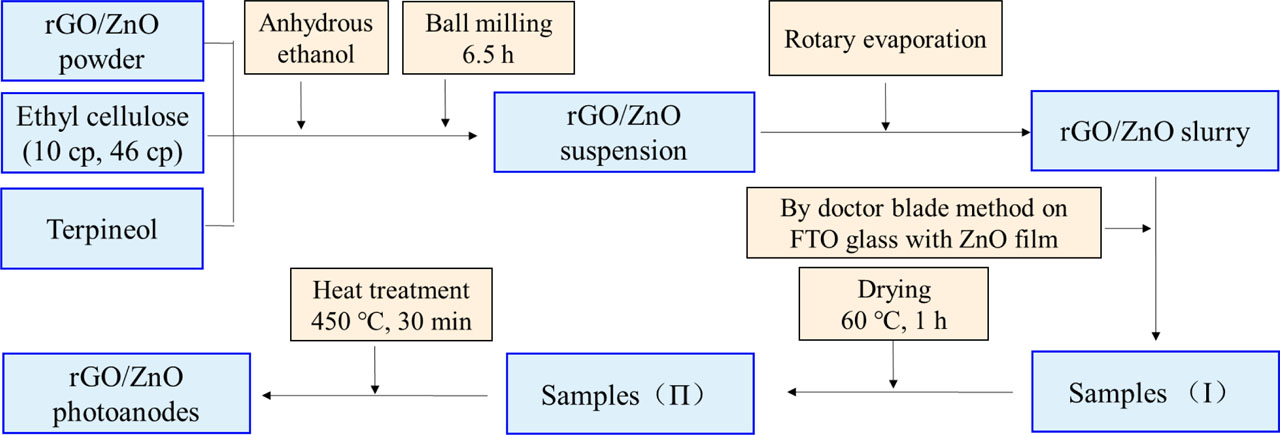
Fig. 3
Schematic diagram of the rGO/ZnO photoanodes preparation process. GO, graphene oxide; rGO, reduced graphene oxide
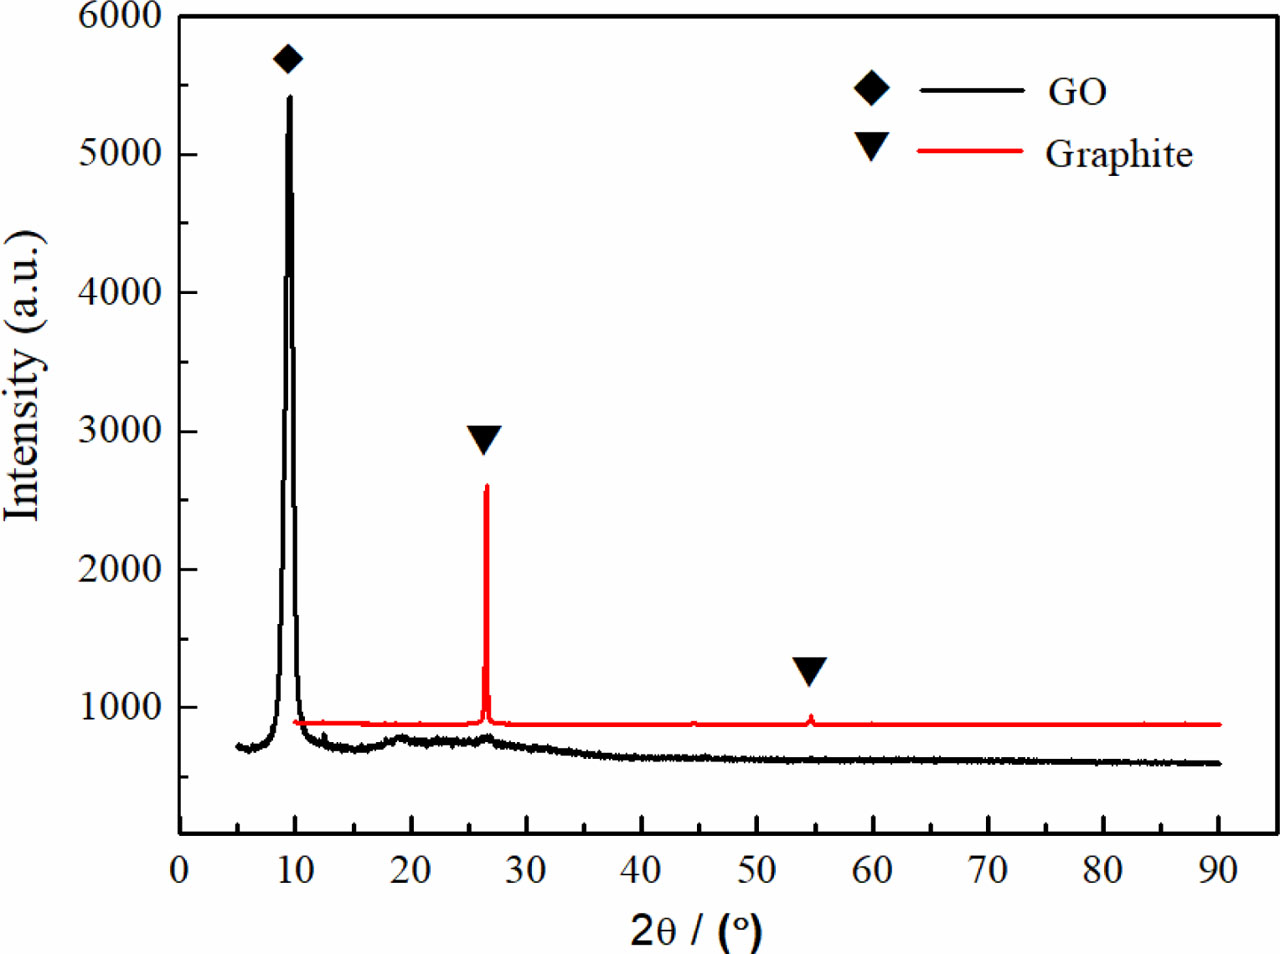
Fig. 4
XRD patterns of the samples prepared by the improved Hummers method. GO, graphene oxide
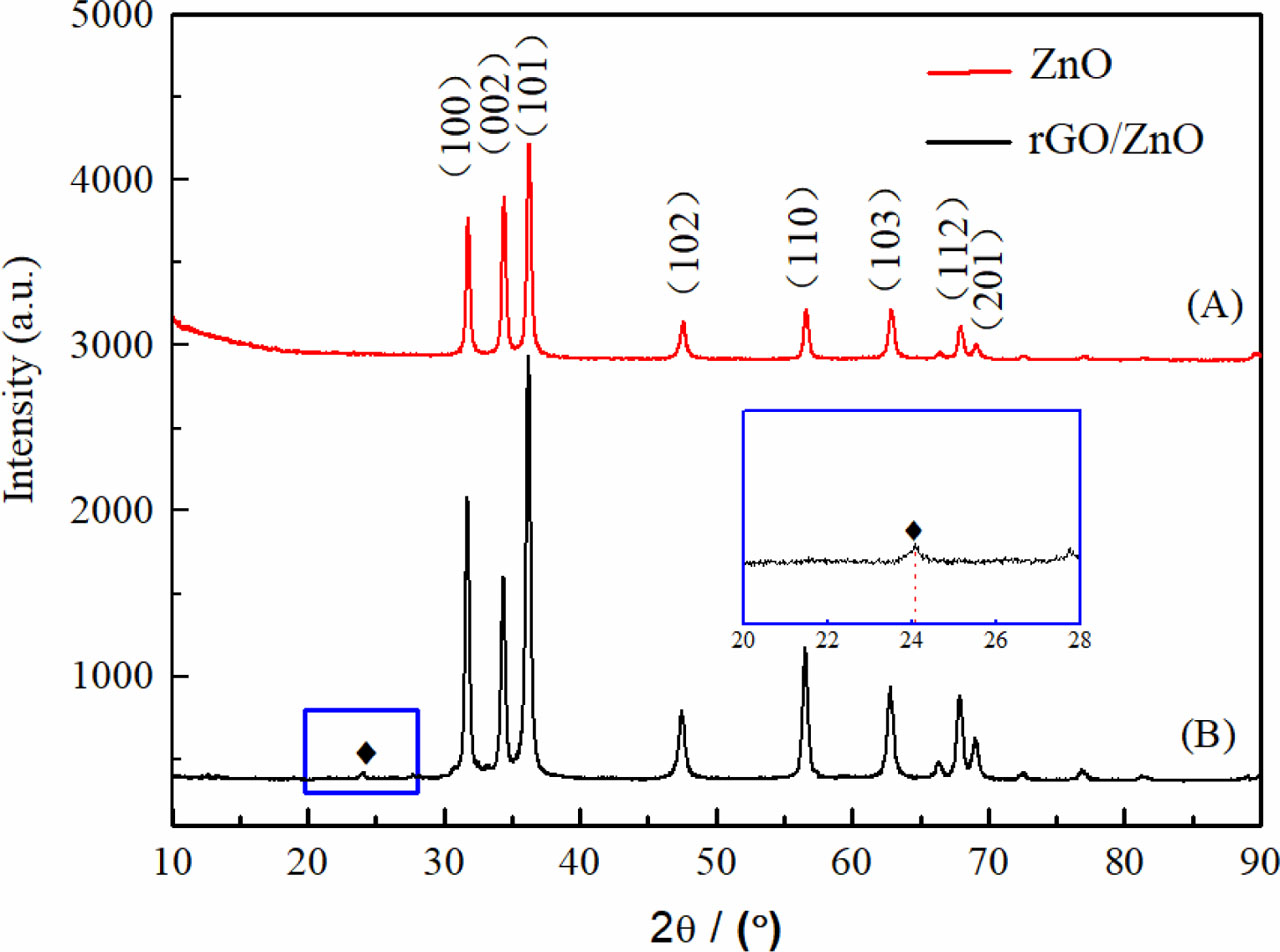
Fig. 5
XRD patterns (A) ZnO prepared by solution combustion method, (B) rGO/ZnO with 1.25% rGO prepared by the chemical reduction method. rGO, reduced graphene oxide
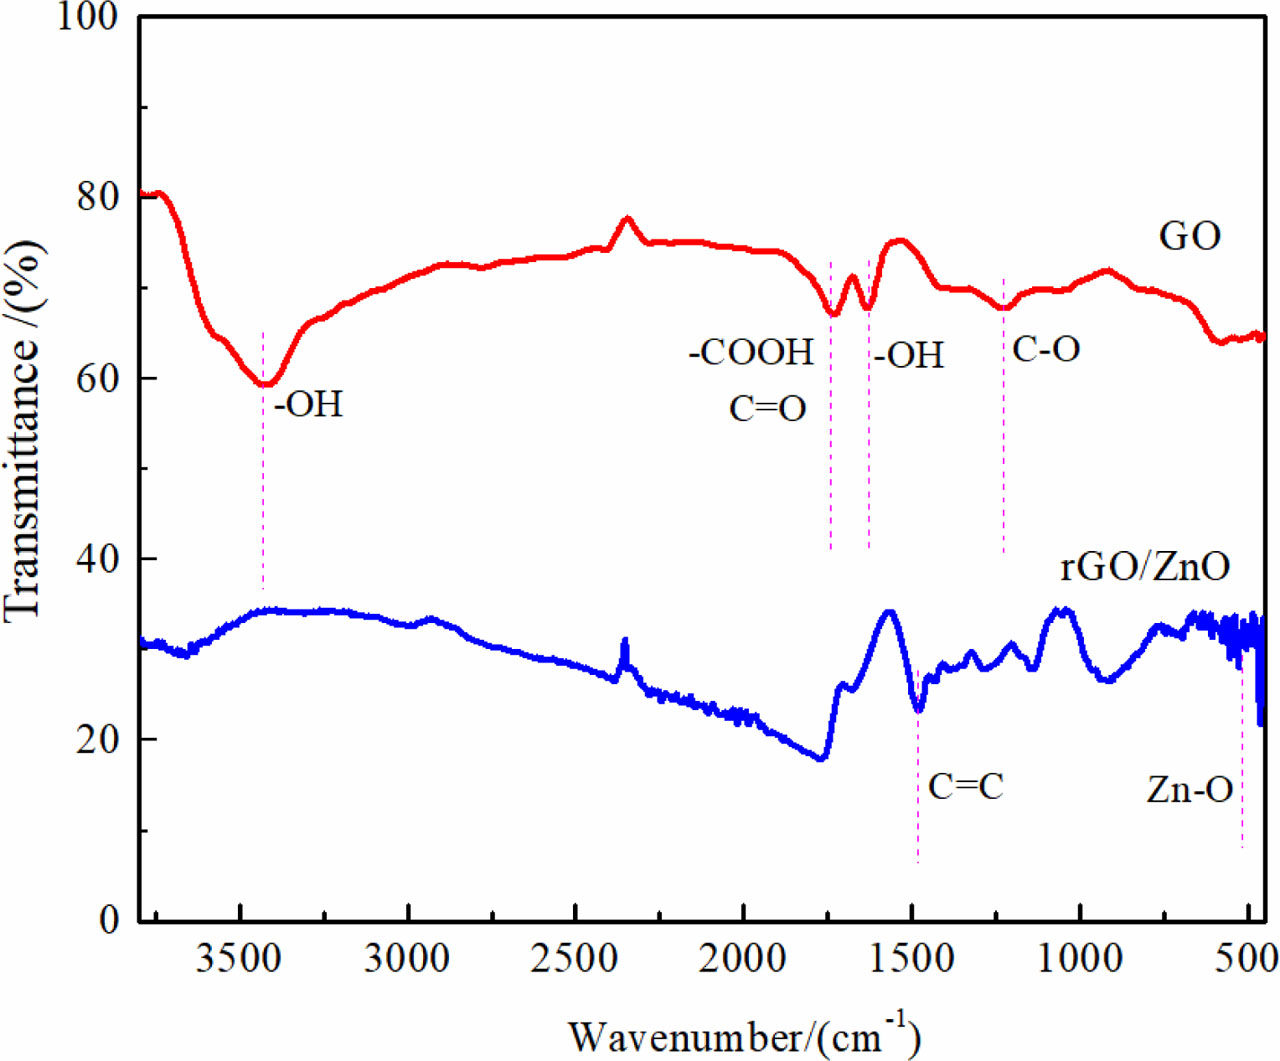
Fig. 6
FT-IR spectra of GO prepared the improved Hummers, and rGO/ZnO with 1.25% rGO prepared by chemical reduction method. GO, graphene oxide; rGO, reduced graphene oxide
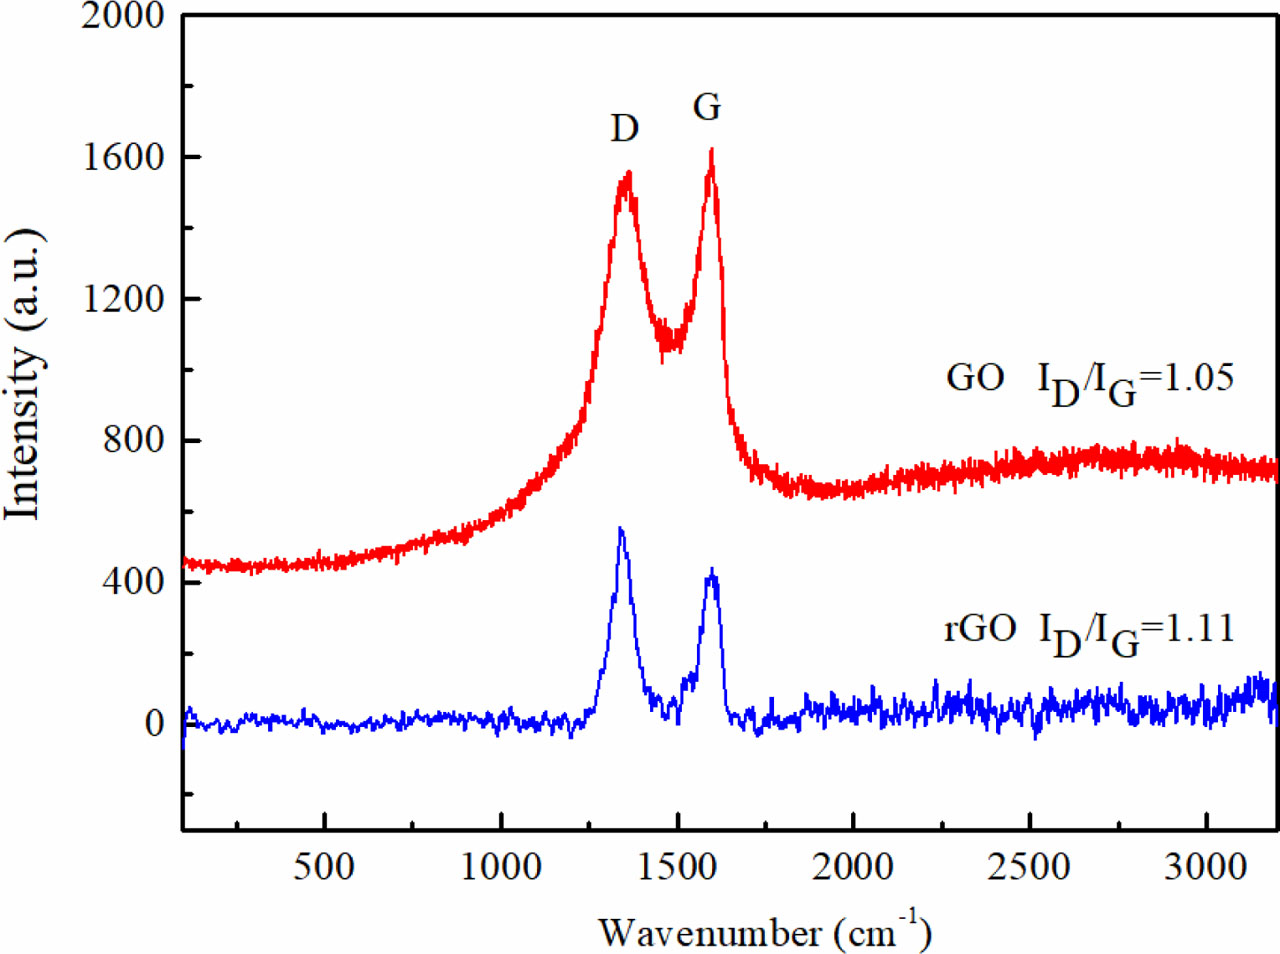
Fig. 7
Raman spectra of GO and rGO prepared by the improved Hummers and the chemical reduction methods, respectively. GO, graphene oxide; rGO, reduced graphene oxide
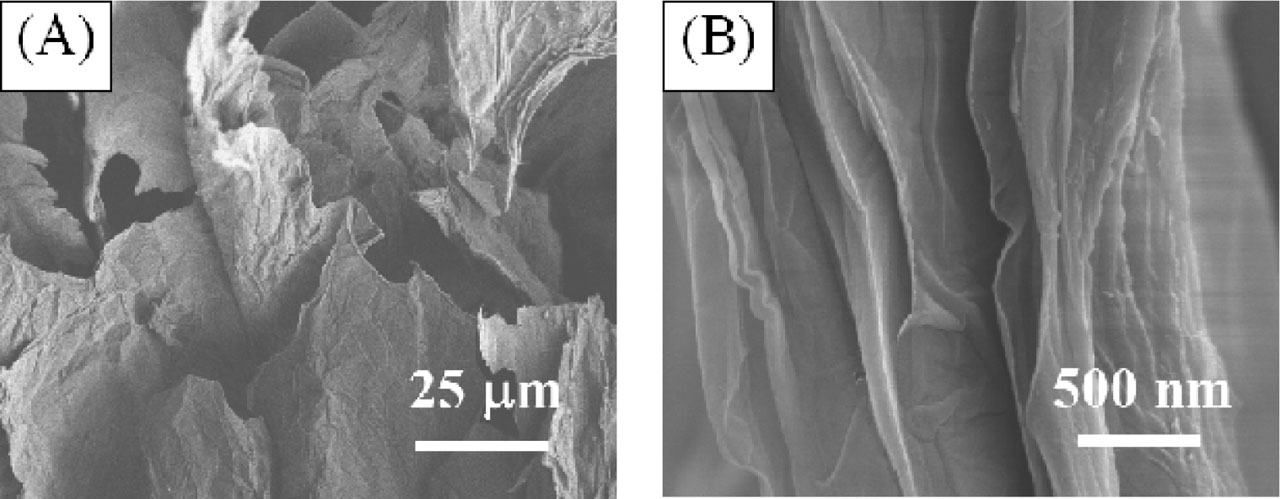
Fig. 8
SEM images of GO prepared by the improved Hummers method: (A) low-magnification and (B) high-magnification. GO, graphene oxide
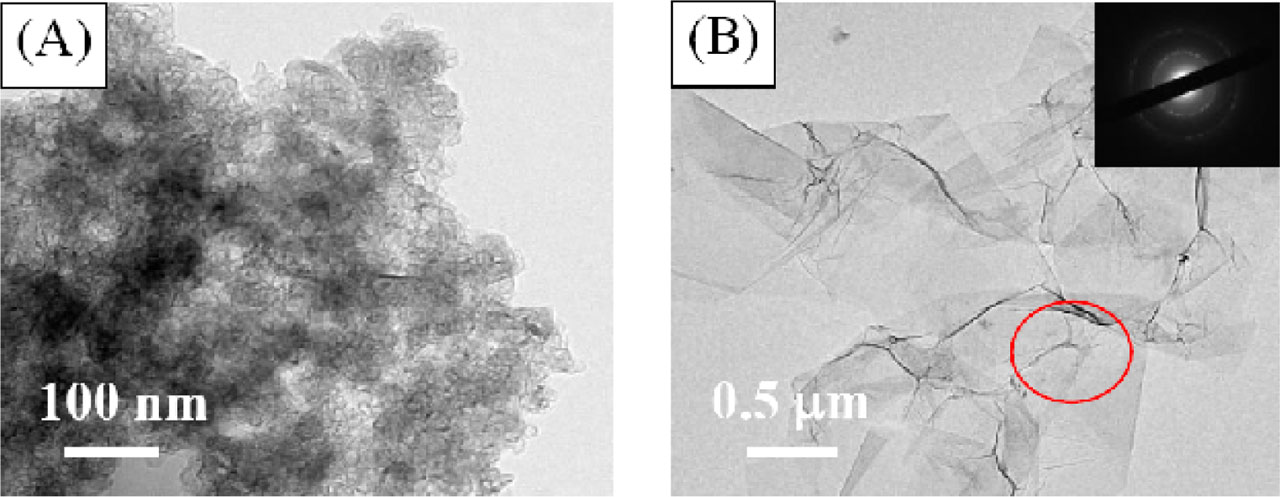
Fig. 9
TEM images (A) and its SAED of GO (B) prepared by the improved Hummers method. GO, graphene oxide
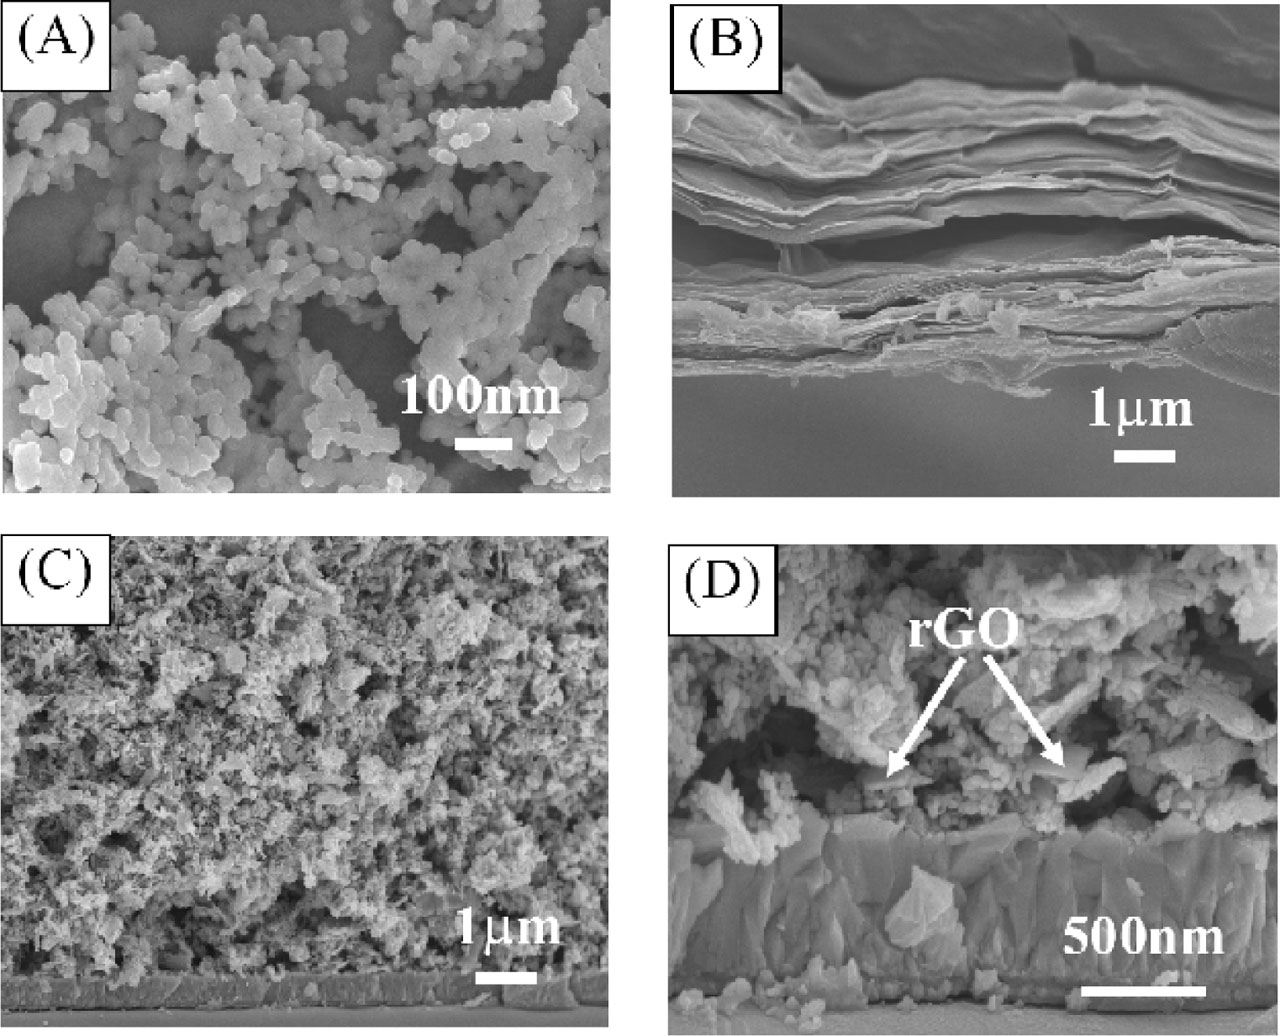
Fig. 10
(A) SEM images of the as-synthesized ZnO by solution combustion, (B) rGO, (C) the cross section of rGO/ZnO photoanode at low-magnification, and (D) high-magnification. Note: rGO adding content 1.25%. rGO, reduced graphene oxide
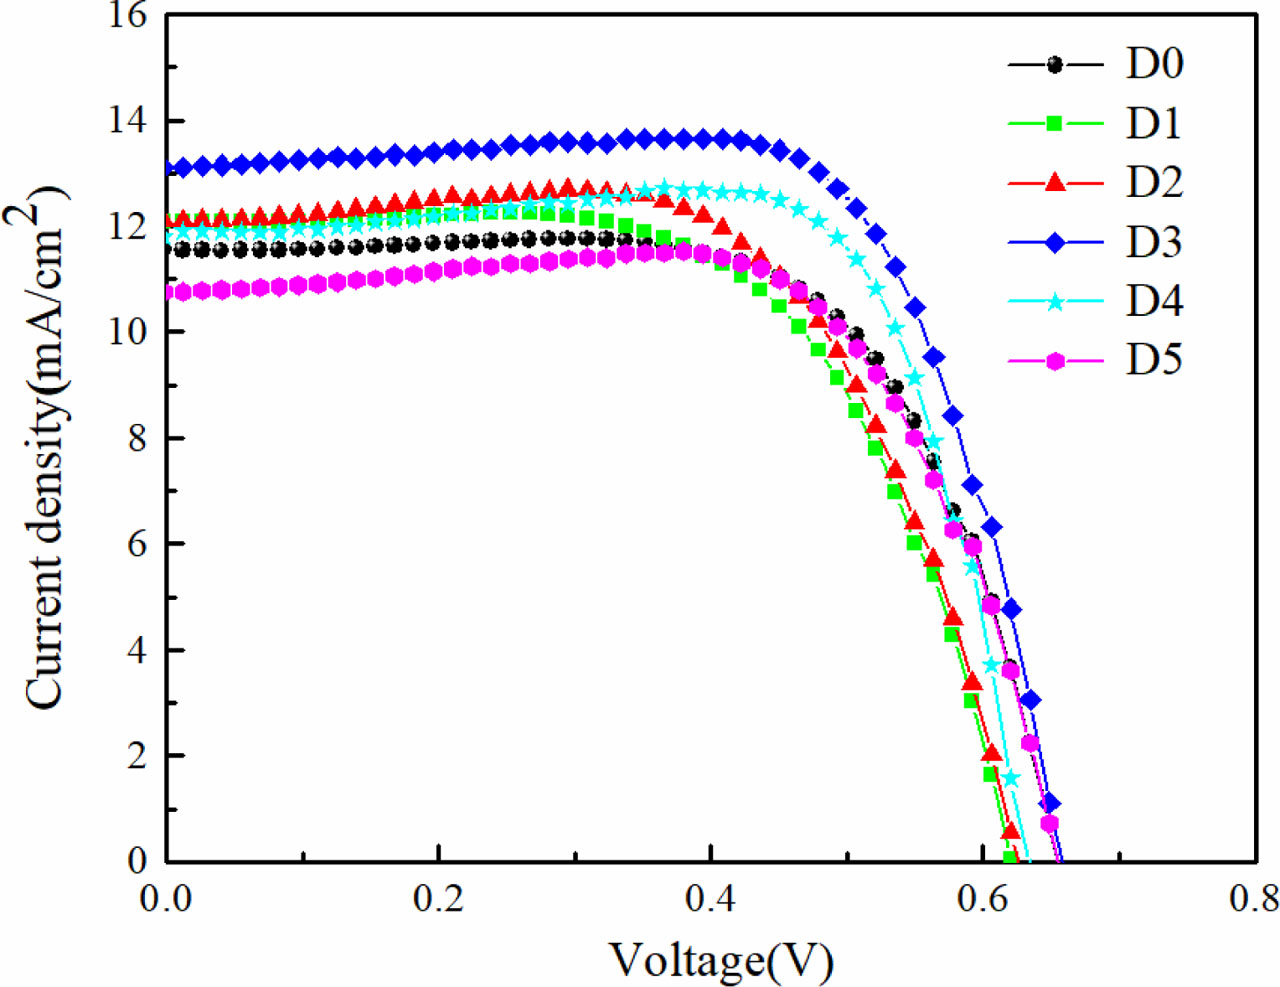
Fig. 11
J-V curves of DSSCs assembled by rGO/ZnO as the photoanodes by adding different contents of rGO. DSSCs, dye-sensitized solar cells; rGO, reduced graphene oxide
Table 1
Performance parameters of DSSCs assembled by rGO/ZnO as the photoanodes by adding different contents of rGO
| Samples | Adding content/wt.% | Voc/V | Jsc/mA/cm2 | FF/% | PCE/% |
|---|---|---|---|---|---|
| D0 | 0 | 0.63 | 12.73 | 64.70 | 5.20 |
| D1 | 0.25 | 0.63 | 12.76 | 66.82 | 5.27 |
| D2 | 0.75 | 0.65 | 12.83 | 66.94 | 5.42 |
| D3 | 1.25 | 0.66 | 13.11 | 72.71 | 6.27 |
| D4 | 1.75 | 0.63 | 11.79 | 69.92 | 5.51 |
| D5 | 2.25 | 0.65 | 10.83 | 69.60 | 5.10 |
[i] DSSCs, dye-sensitized solar cells; PCE, photoelectric conversion efficiency; rGO, reduced graphene oxide.
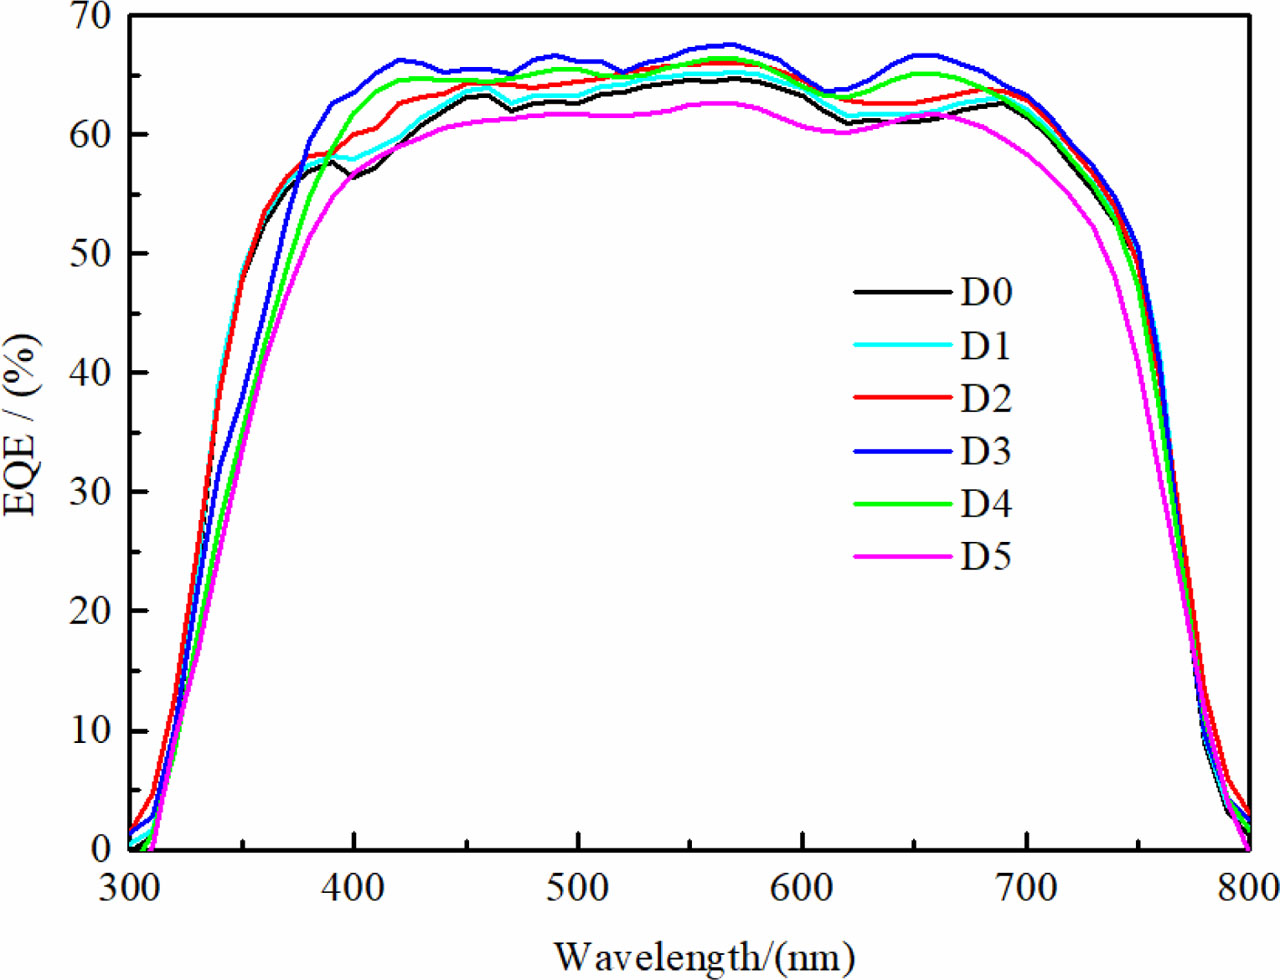
Fig. 12
EQE curves of D0, D1, D2, D3, D4, and D5. EQE, external quantum efficiency
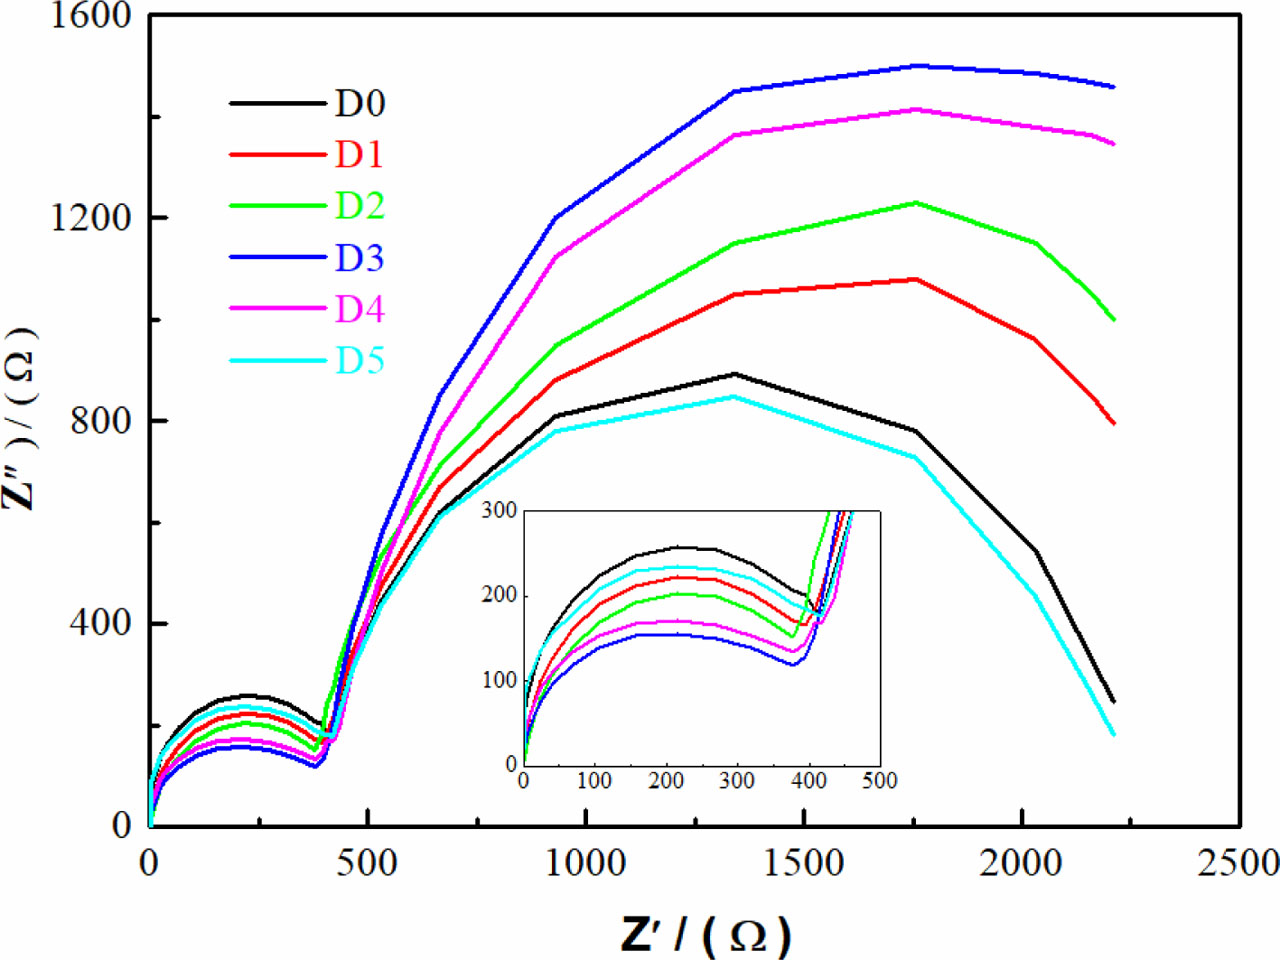
Fig. 13
Nyquist curves of D0, D1, D2, D3, D4, and D5 under dark conditions