
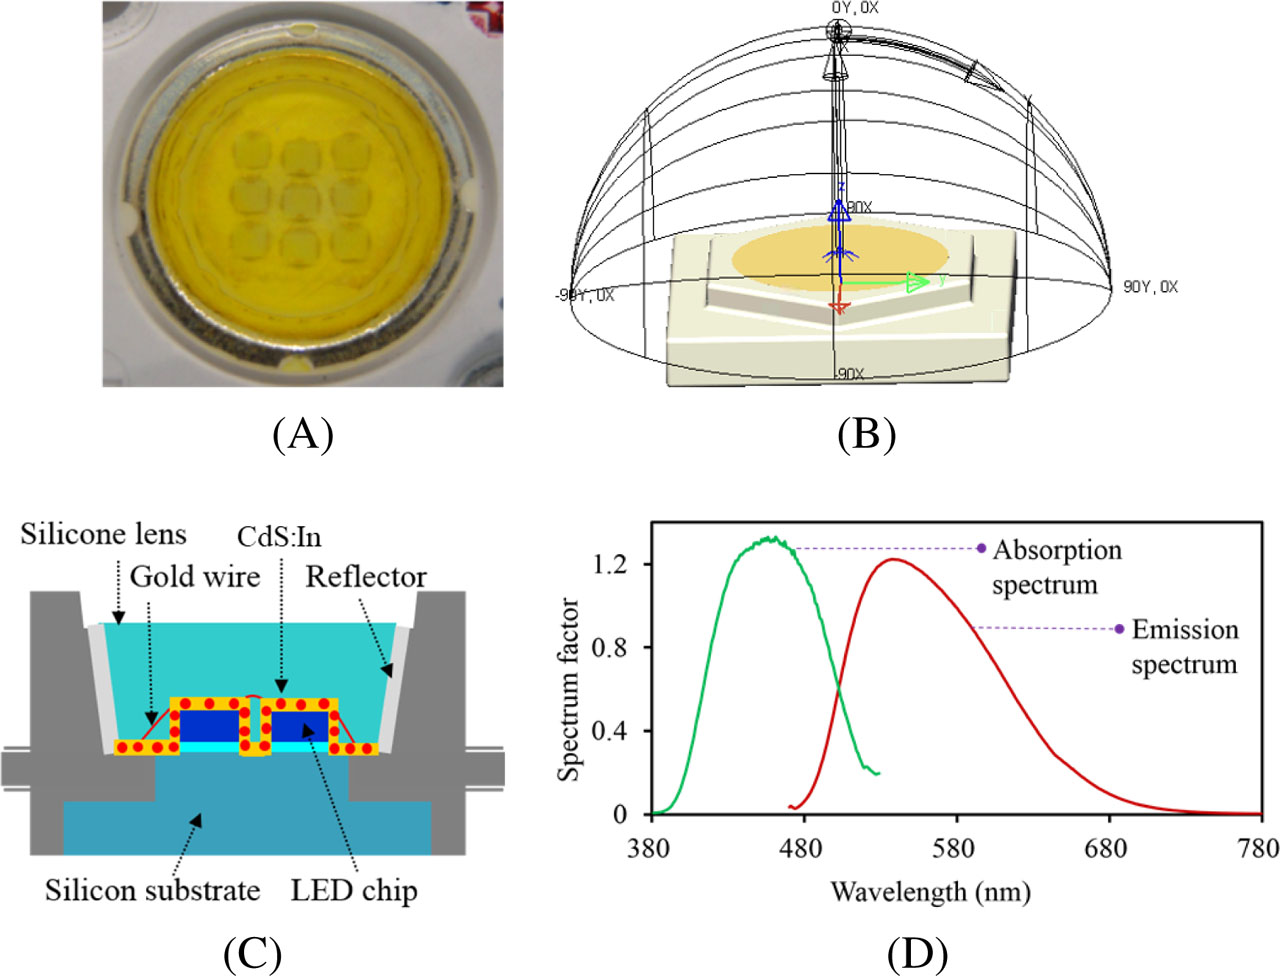
Fig. 1
(A) Photograph of the WLEDs, (B) illustration of WLEDs, (C) simulation of WLEDs, (D) the measured spectra of YAG:Ce3+ phosphor
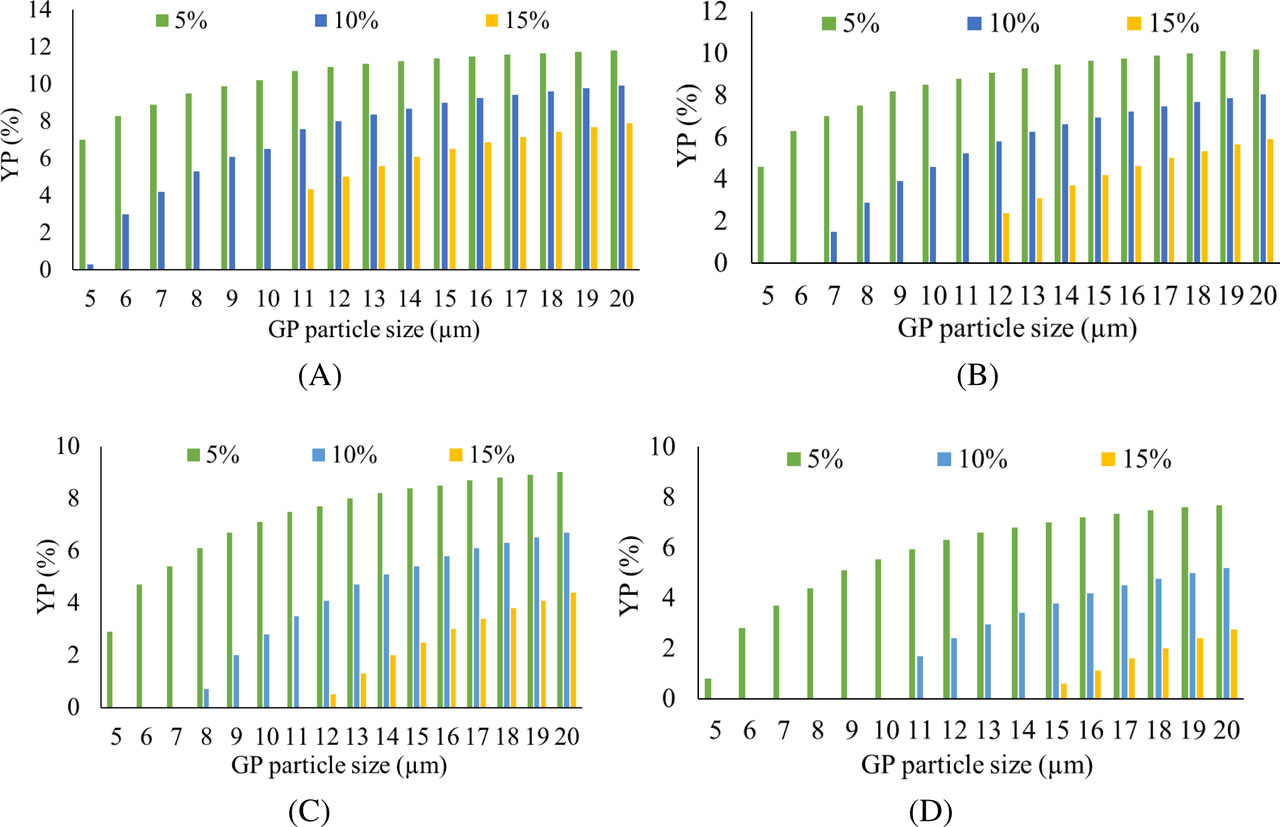
Fig. 2
Simulated results of yellow-phosphor concentration when varying green-phosphor CdS:In concentration with increasing particle size: (A) 5000 K; (B) 5700 K; (C) 6500 K; (D) 8000 K
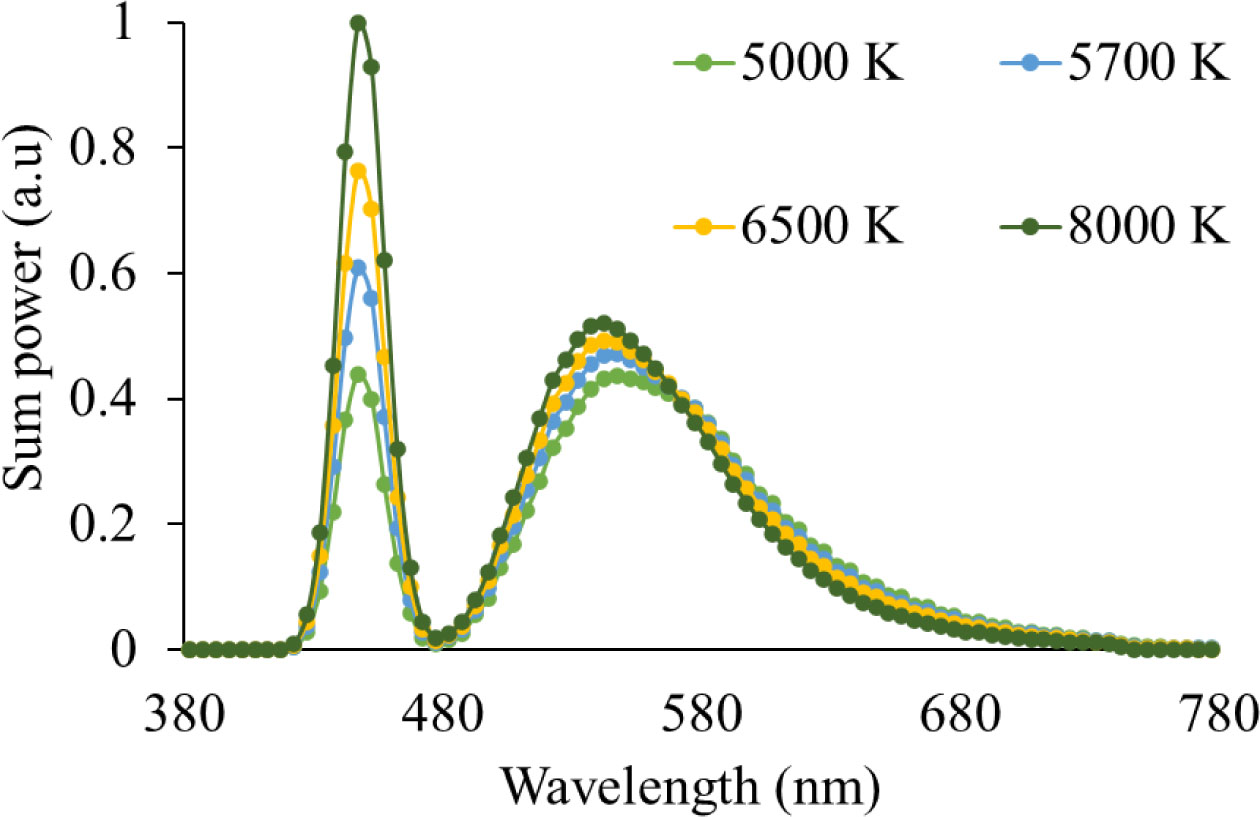
Fig. 3
The simulated WLEDs’ emission power when adding CdS:In phosphor
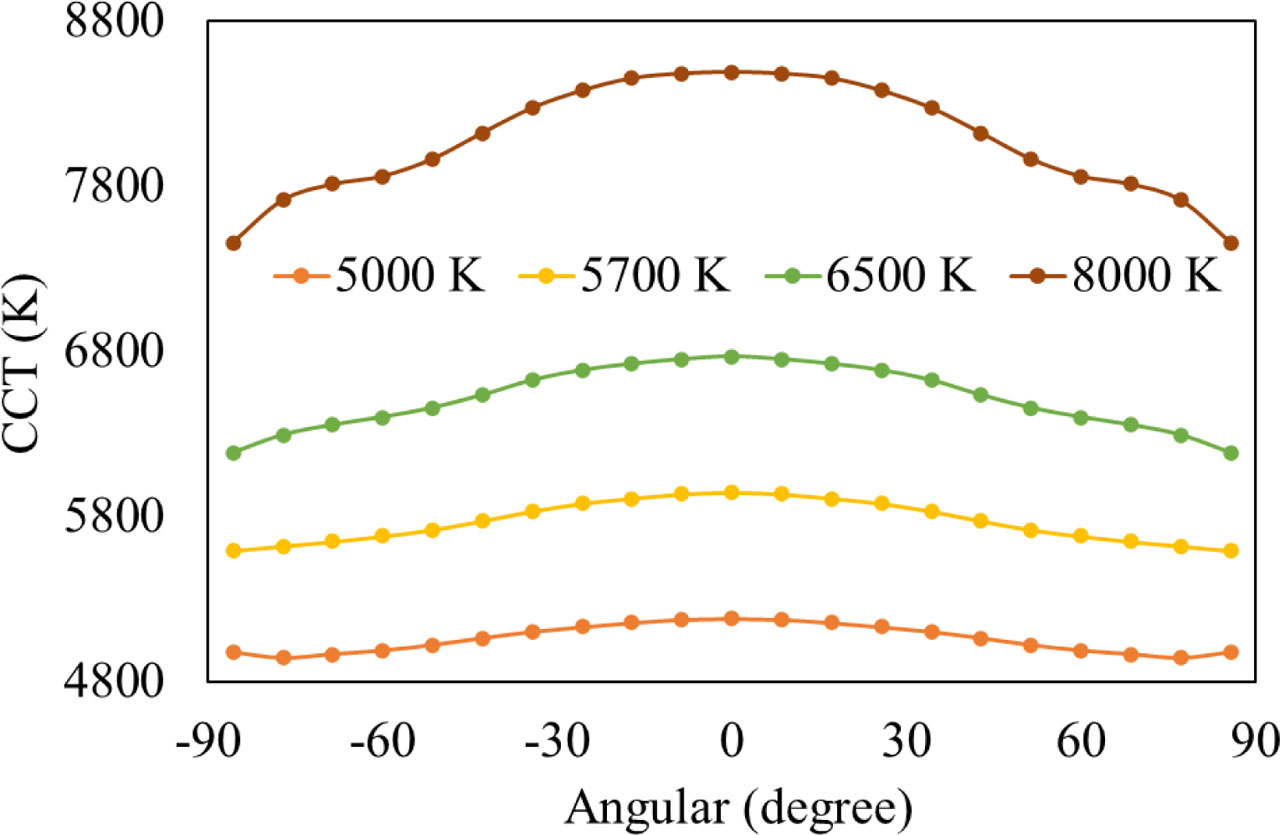
Fig. 4
The simulated angular-dependent CCTs when adding CdS:In green phosphor. CCT, correlated color temperature
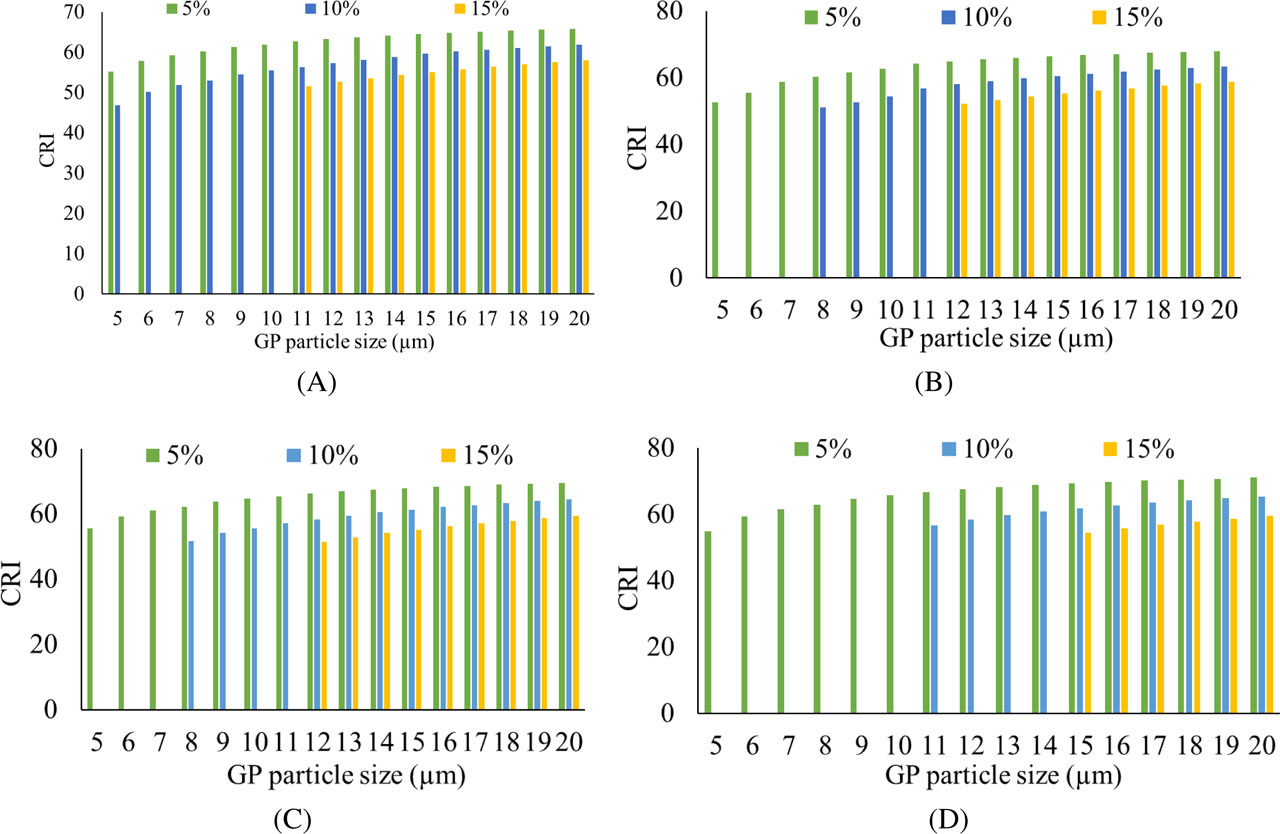
Fig. 5
Simulated CRI values when varying green-phosphor CdS:In concentration with increasing particle size: (A) 5000 K; (B) 5700 K; (C) 6500 K; (D) 8000 K. CRI, color rendering index
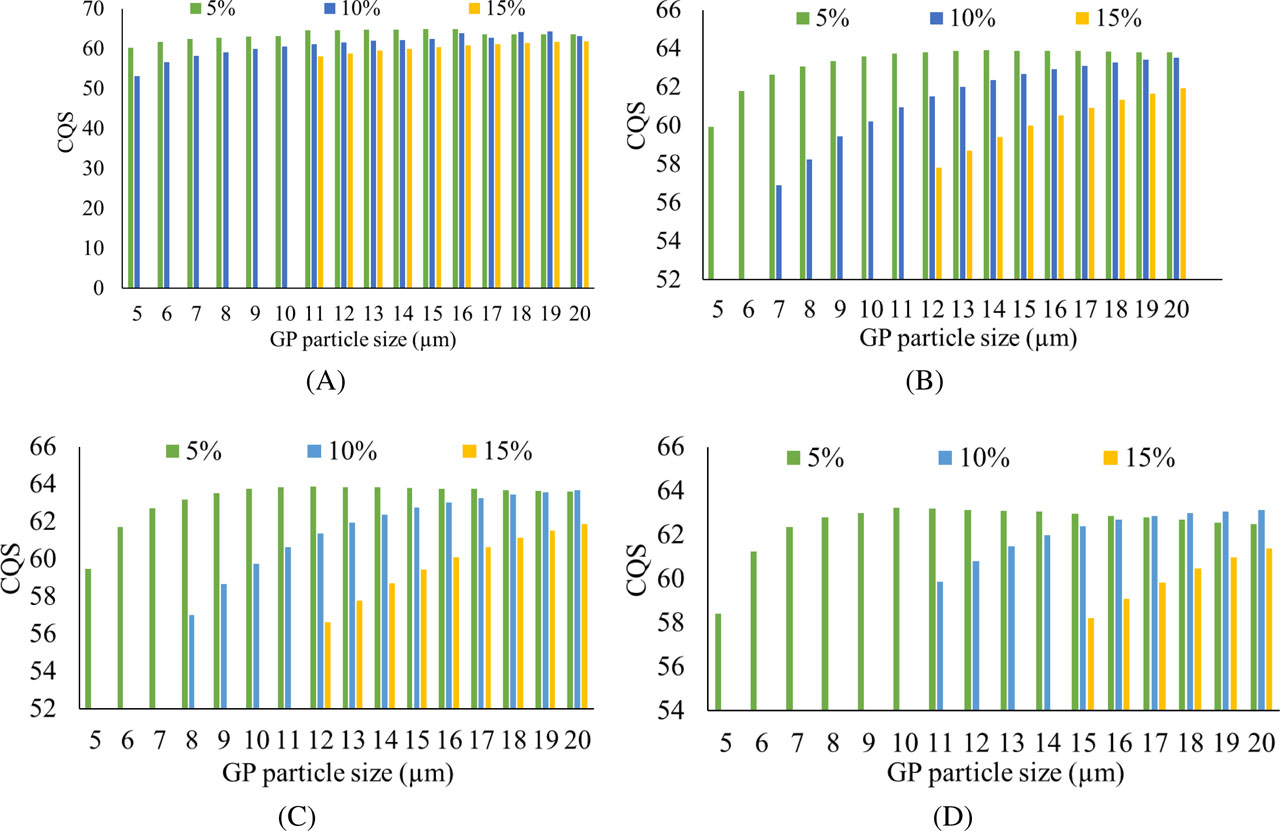
Fig. 6
Simulated CQS values when varying green-phosphor CdS:In concentration with increasing particle size: (A) 5000 K; (B) 5700 K; (C) 6500 K; and (D) 8000 K. CQS, color quality scale
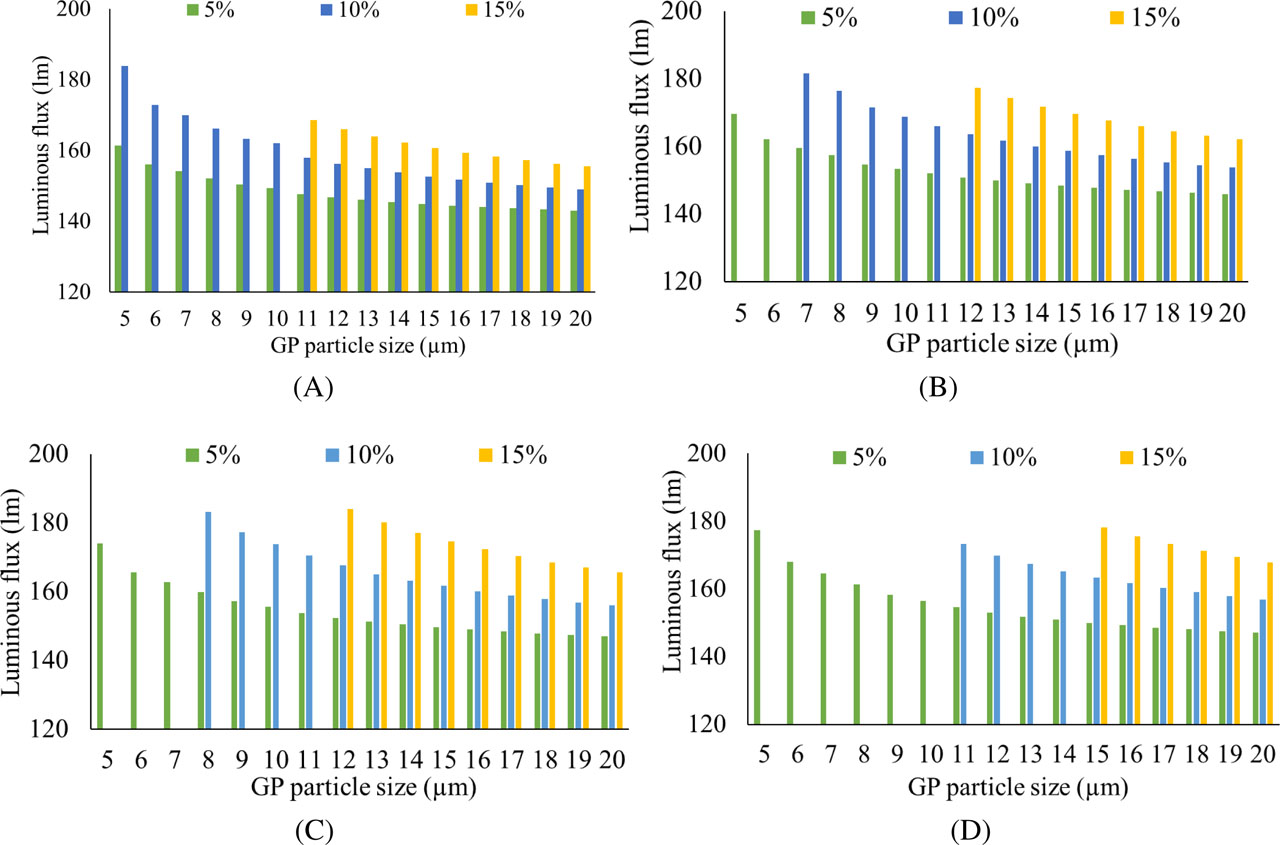
Fig. 7
Simulated luminous flux when varying green-phosphor CdS:In concentration with increasing particle size: (A) 5000 K; (B) 5700 K; (C) 6500 K; (D) 8000 K