
Table 1
The green phosphor Zn2GeO4:Mn2+ composition
| Ingredients | Mole (%) | By weight (g) |
|---|---|---|
| ZnO | 90 | 73.2 |
| MgF2 | 5 | 3.1 |
| MnCO3 | 5 | 5.8 |
| GeO2 | 55 | 57.5 |
Table 2
The red phosphor LiLaO2:Eu3+ composition
| Ingredients | Mole (%) | By weight (g) |
|---|---|---|
| La2O3 | 95 (of La) | 155 |
| Eu2O3 | 5 (of Eu) | 8.8 |
| Li2CO3 | 101 (of Li) | 37.4 |
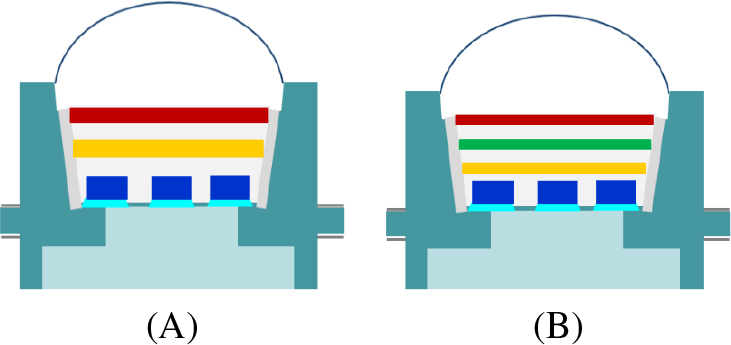
Fig. 1
Schematic diagrams of (A) DL remote phosphor configuration, (B) TL remote phosphor configuration. DL, double-layer; TL, triple-layer
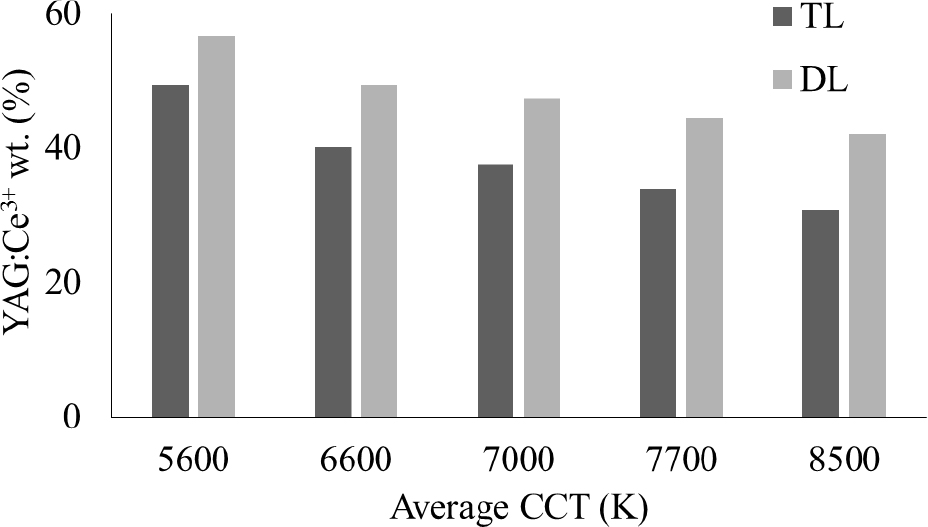
Fig. 2
Changes in yellow YAG:Ce3+ phosphor concentration in two remote phosphor structures at five CCTs
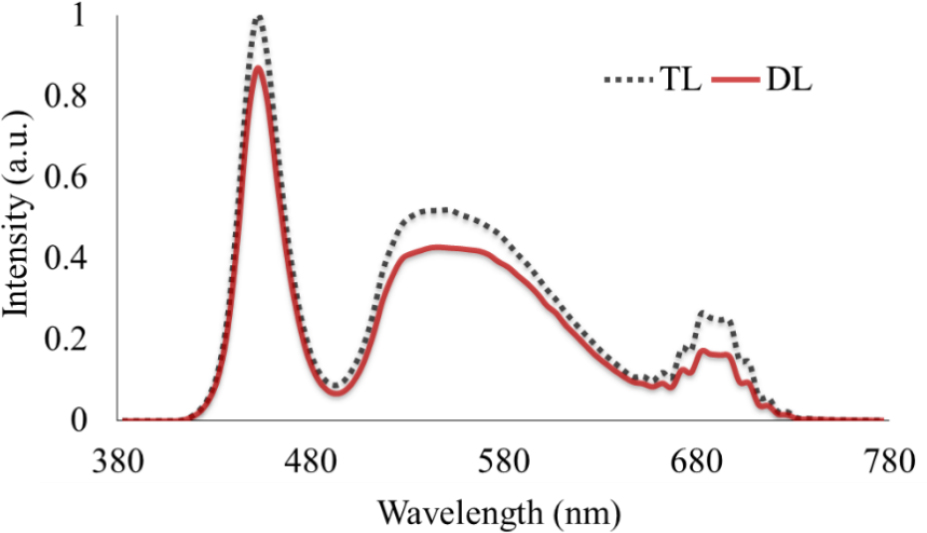
Fig. 3
Emission spectra of DL and TL phosphor structures. DL, double-layer; TL, triple-layer
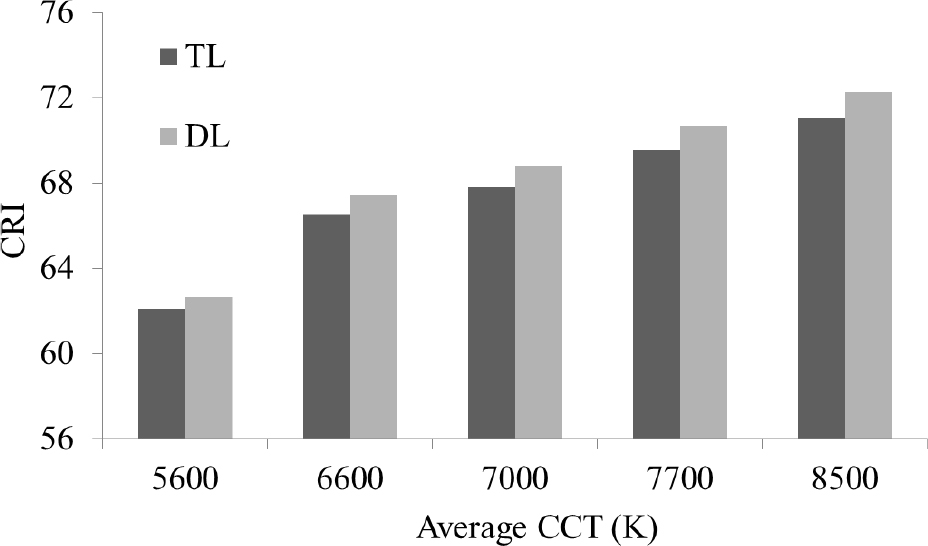
Fig. 4
CRI values of DL and TL phosphor configurations at each CCT. CRI, color rendering index; CCT, correlated color temperature; DL, double-layer; TL, triple-layer
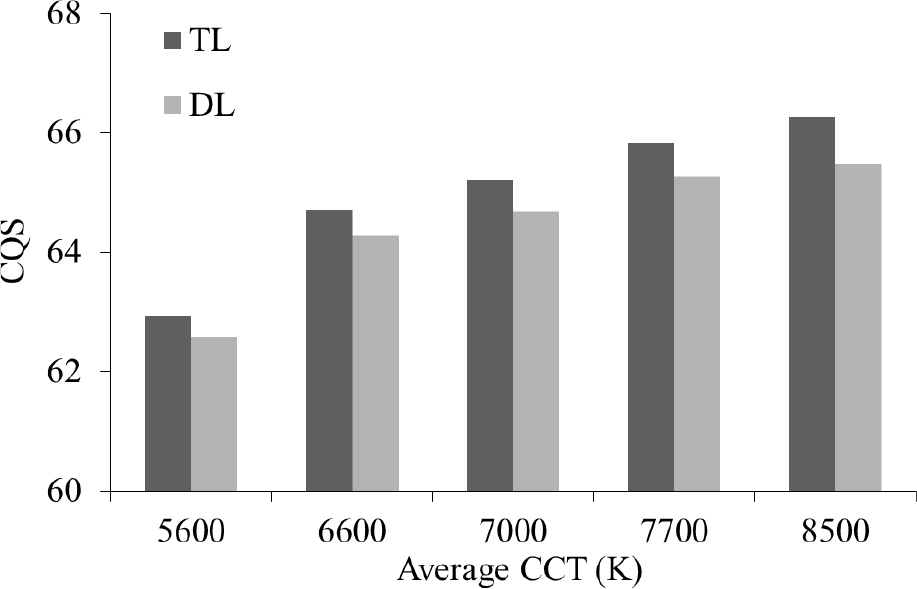
Fig. 5
CQS values of DL and TL phosphor configurations at each CCT. CQS, color quality scale; CCT, correlated color temperature; DL, double-layer; TL, triple-layer
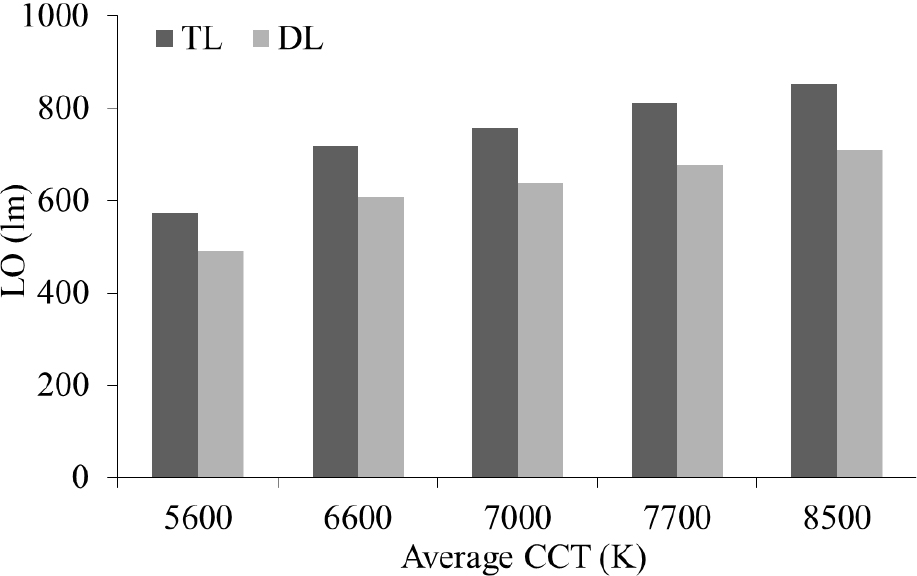
Fig. 6
Luminous output (LO)
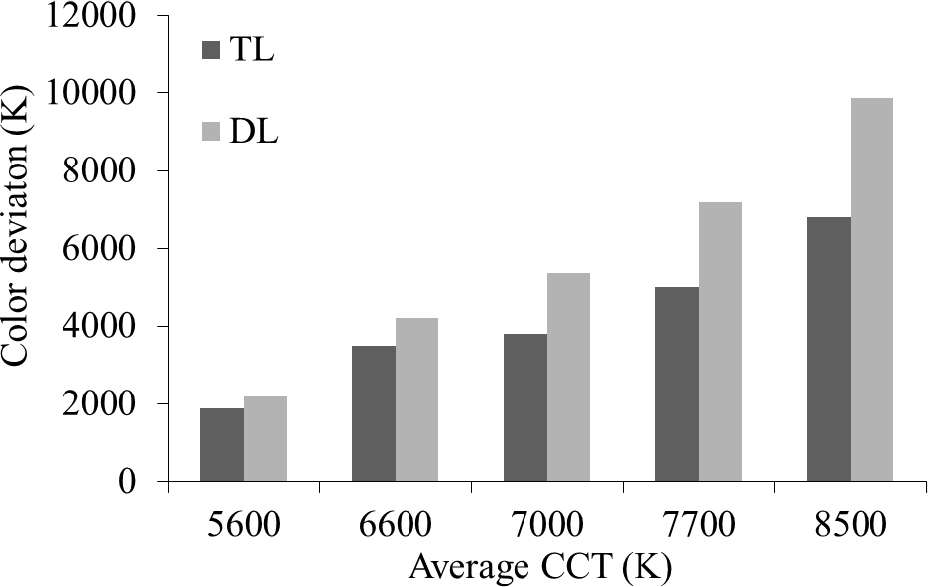
Fig. 7
Color deviation (D-CCT) of TL and DL phosphor configurations at each CCT. CCT, correlated color temperature. DL, double-layer; TL, triple-layer