
Fig. 1
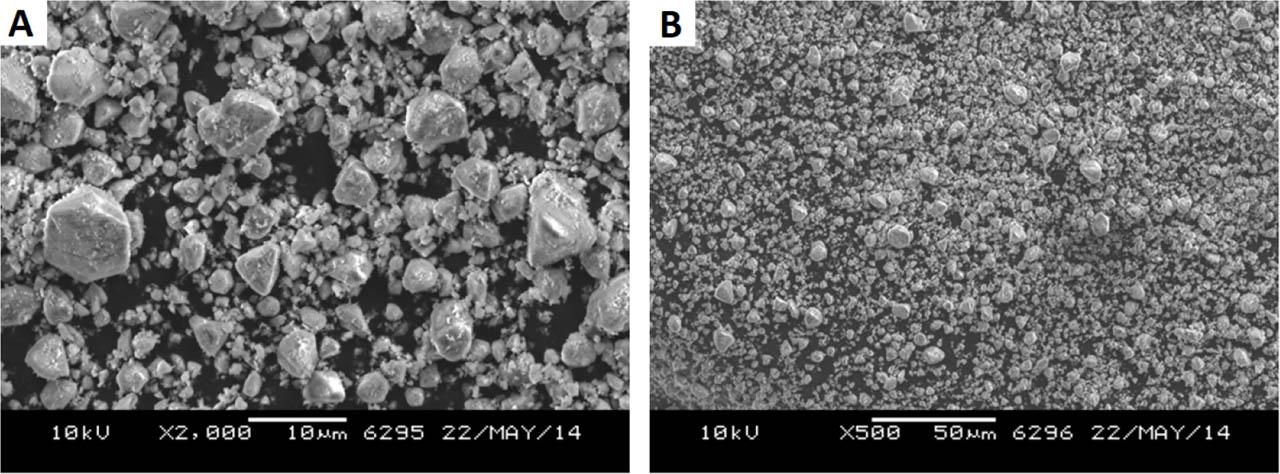
Fig. 2
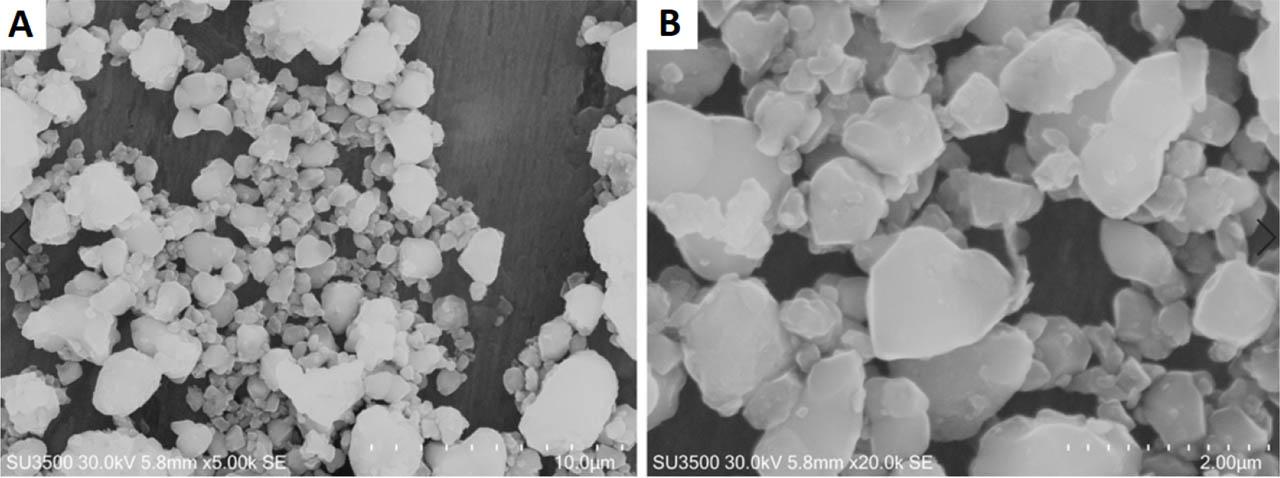
Fig. 3
Fig. 4
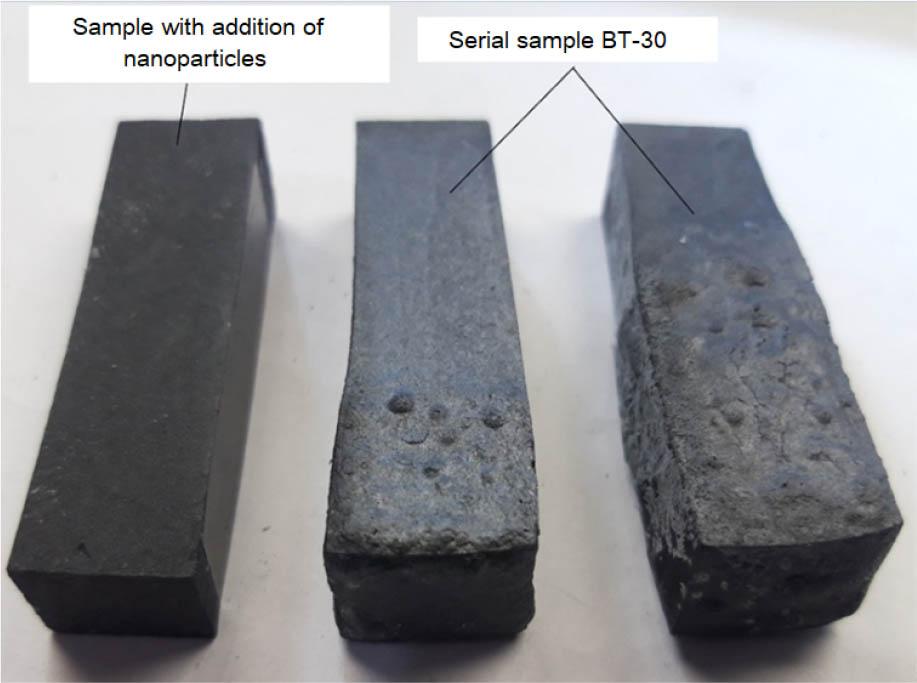
Fig. 5
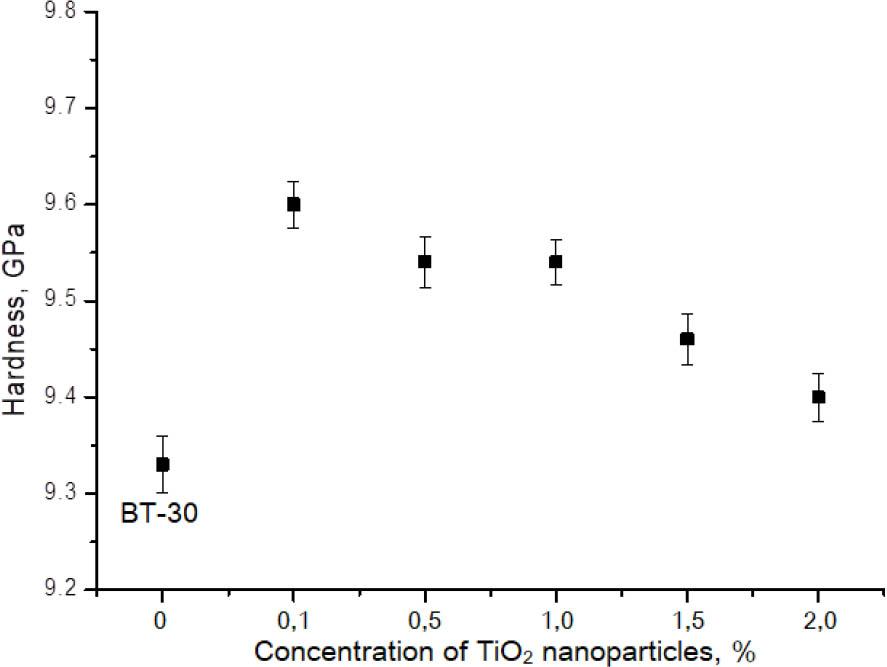
Fig. 6
Fig. 7
Fig. 8
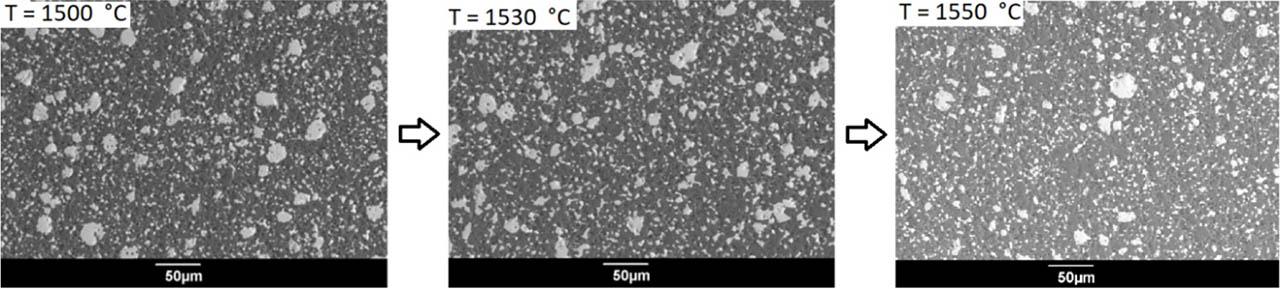
Fig. 9
Fig. 10
Fig. 11
Fig. 12
Fig. 13
Main characteristics of the TiO2 micron powder used
| No. | Name of indicators | Indicator value | |
|---|---|---|---|
| TC requirements, % | Analysis results | ||
| 1 | Mass fraction of titanium dioxide, %, no less | 99 | 99.5 |
| 2 | Mass fraction of rutile form, %, no less | 97 | 100 |
| 3 | Mass fraction of iron compounds in terms of Fe2O3, %, no more | 0.08 | 0.05 |
| 4 | Mass fraction of phosphorus compounds in terms of P2O5, %, no more | 0.03 | 0.03 |
| 5 | Mass fraction of sulfur compounds in terms of SiO3, %, no more | 0.03 | 0.01 |
| 6 | Mass fraction for silicon compounds in terms of SiO2, %, no more | 0.15 | 0.15 |
| 7 | Mass fraction of “metallic iron”, %, no more | 0.02 | 0.01 |
| 8 | Specific surface, cm2/g, within | 3,300–4,600 | 4,060 |
Change in apparent density from the sintering temperature of (BeO + TiO2)-ceramics with the addition of TiO2 nanoparticles within 0_1–2_0 wt_%
| Batch No. | Sintering temperature, °C | Composition of the ceramics | Density, g/cm3 |
|---|---|---|---|
| BT-30 | 1,530 |
| 3.2 |
| B1 | 1,520 |
| 3.11 |
|
| 3.13 | ||
|
| 3.15 | ||
|
| 3.15 | ||
|
| 3.16 | ||
| B2 |
| 3.23 | |
|
| 3.23 | ||
|
| 3.23 | ||
|
| 3.22 | ||
|
| 3.23 | ||
| B3 |
| 3.22 | |
|
| 3.23 | ||
|
| 3.22 | ||
|
| 3.22 | ||
|
| 3.22 | ||
| B4 |
| 3.22 | |
|
| 3.23 | ||
|
| 3.22 | ||
|
| 3.23 | ||
|
| 3.22 |
Water absorption, and open, total, and closed porosities of BeO ceramics, depending on the content of TiO2nano {\rm TiO}_2^{\rm nano} (0_1%–2_0%)
| Batch No. | Water absorption, % | Porosity, % | ||
|---|---|---|---|---|
| Open | Total | Closed | ||
| BT-30 | 0.03 | 0.10 | 7.076 | 6.977 |
| B1 | 0.06 | 0.187 | 5.92 | 5.73 |
| B2 | 0.05 | 0.165 | 5.329 | 5.164 |
| B3 | 0.07 | 0.211 | 5.329 | 5.118 |
| B4 | 0.06 | 0.186 | 5.031 | 4.845 |
| B5 | 0.07 | 0.217 | 4.126 | 3.909 |
The main characteristics of the used BeO powder grade “B2”
| Characteristic, batch number | b 67 | |
|---|---|---|
| Bulk density, ρo × 103 kg/m3 | 0.77 | |
| Specific surface S, cm2/g | 11,000 | |
| Moisture, wt.% | 0.08 | |
| Element-by-element impurities content, wt.% | Boron | 1.7 × 10⁻⁵ |
| Silicon | 7.3 × 10⁻³ | |
| Manganese | 8.2 × 10⁻⁴ | |
| Ferrum | 5.1 × 10⁻² | |
| Magnesium | 5.2 × 10⁻³ | |
| Chromium | 1.0 × 10⁻² | |
| Nickel | 1.1 × 10⁻² | |
| Aluminum | 3.2 × 10⁻² | |
| Copper | 8.0 × 10⁻⁴ | |
| Zinc | 7.5 × 10⁻³ | |
| Calcium | 4.2 × 10⁻³ | |
| Silver | 1.1 × 10⁻⁵ | |
| Cadmium | 1.2 × 10⁻⁵ | |
| Lithium | 6.7 × 10⁻⁴ | |
| Natrium | 8.7 × 10⁻³ | |
| Amount of impurities, wt.% | 0.14 | |