
Fig. 1
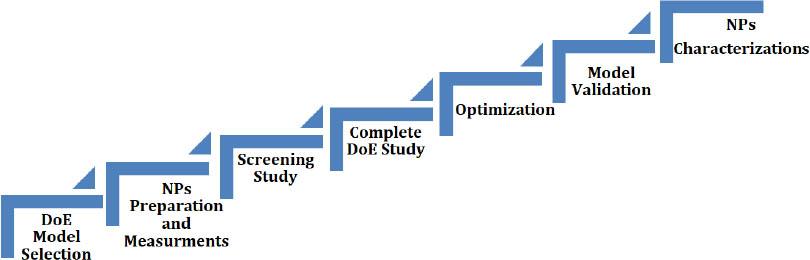
Fig. 2
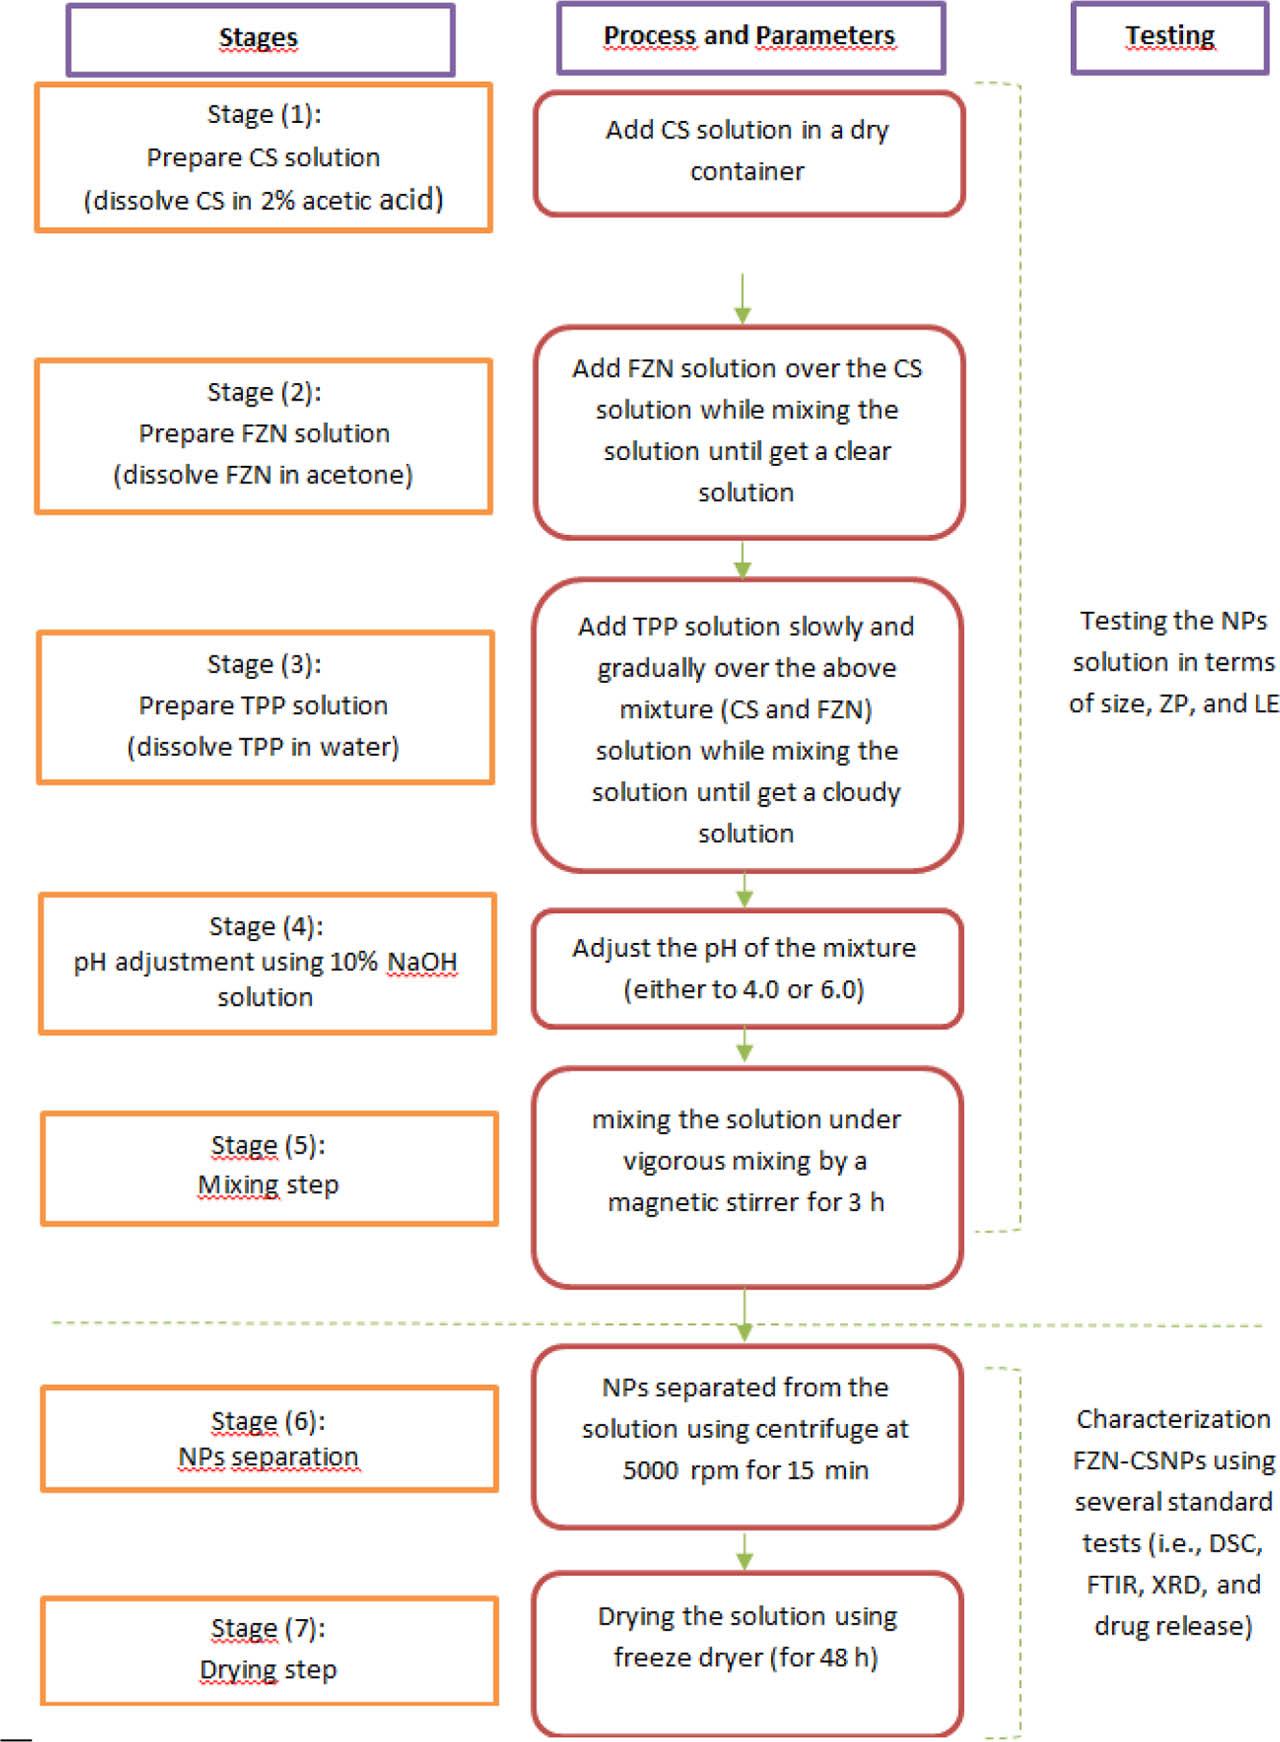
Fig. 3
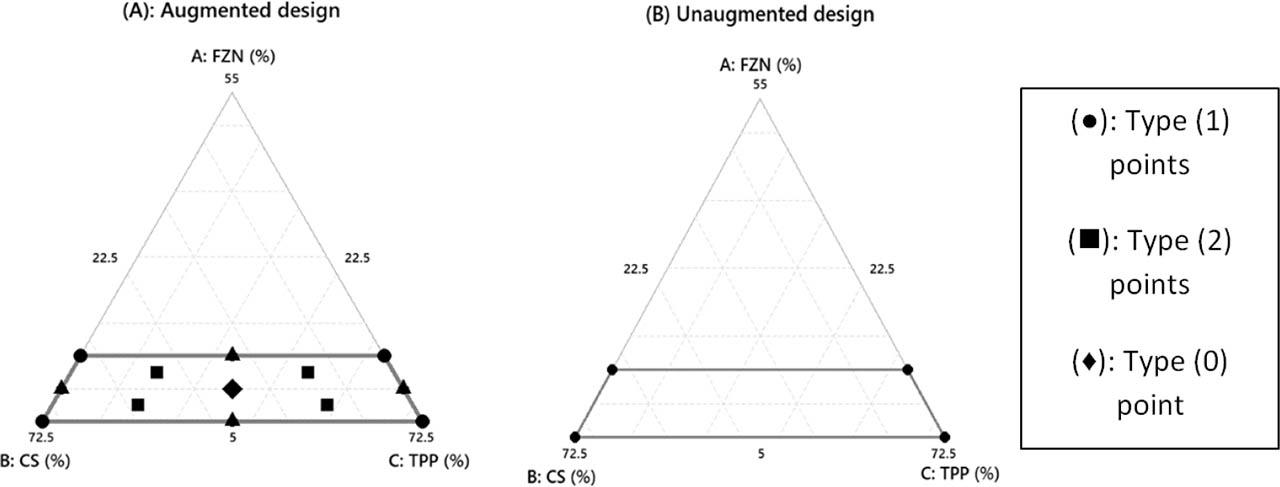
Fig. 4

Fig. 5
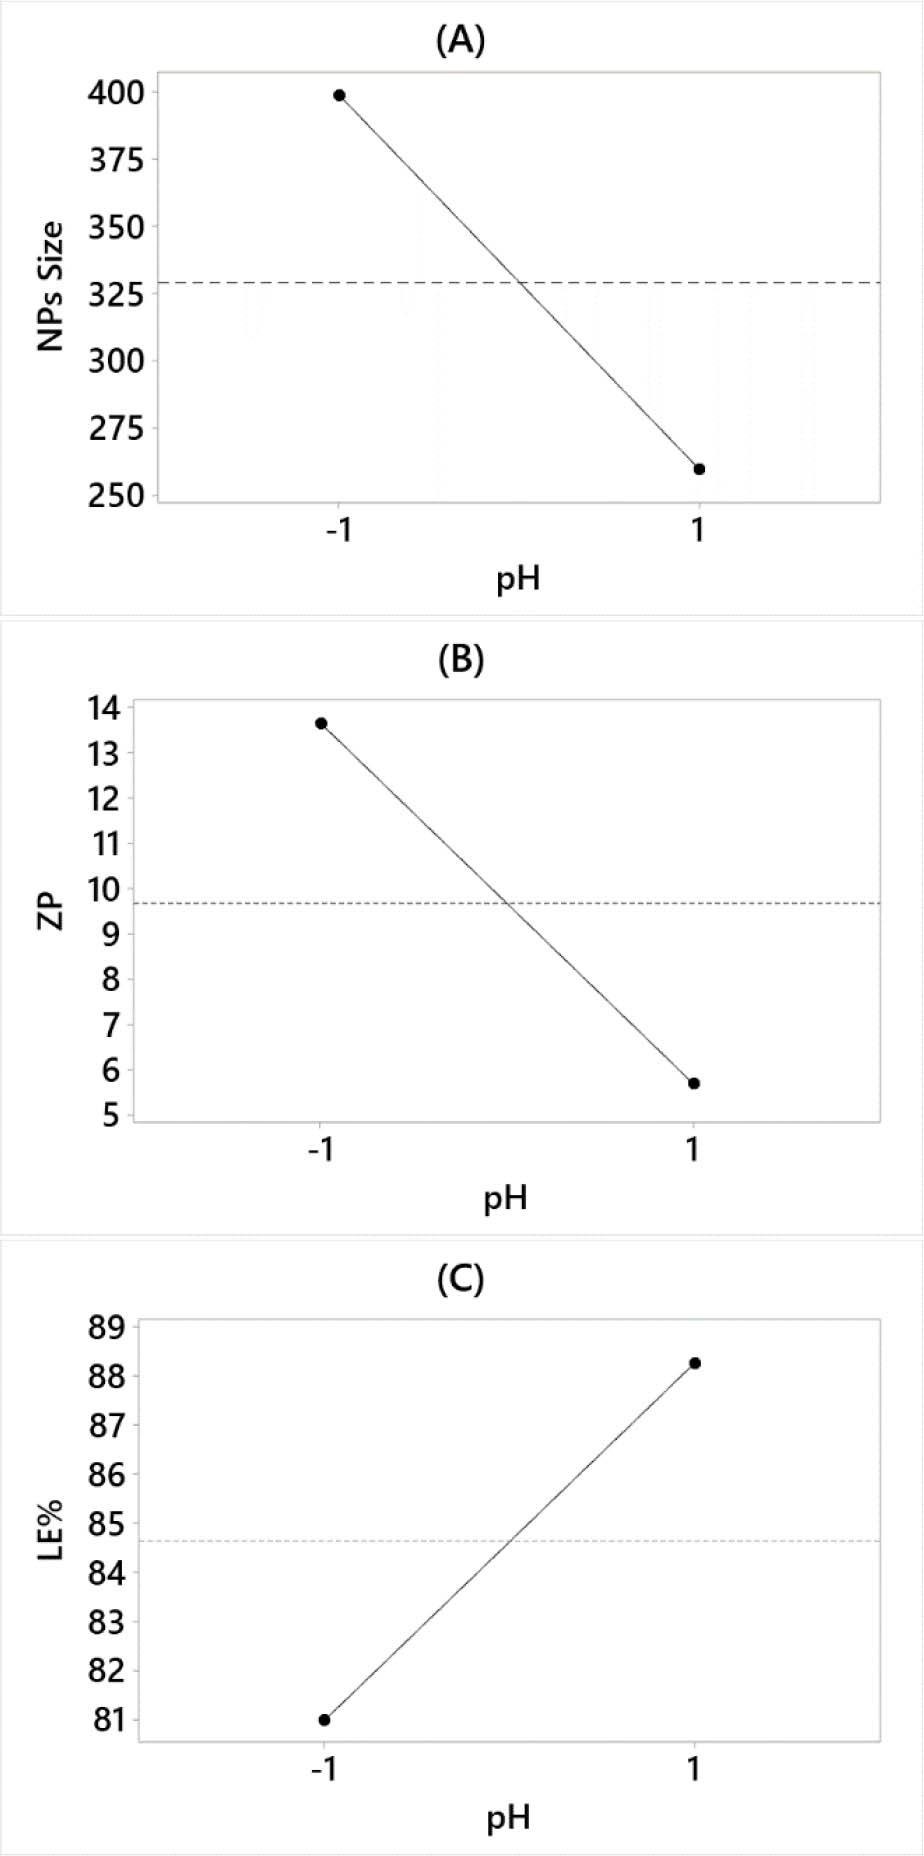
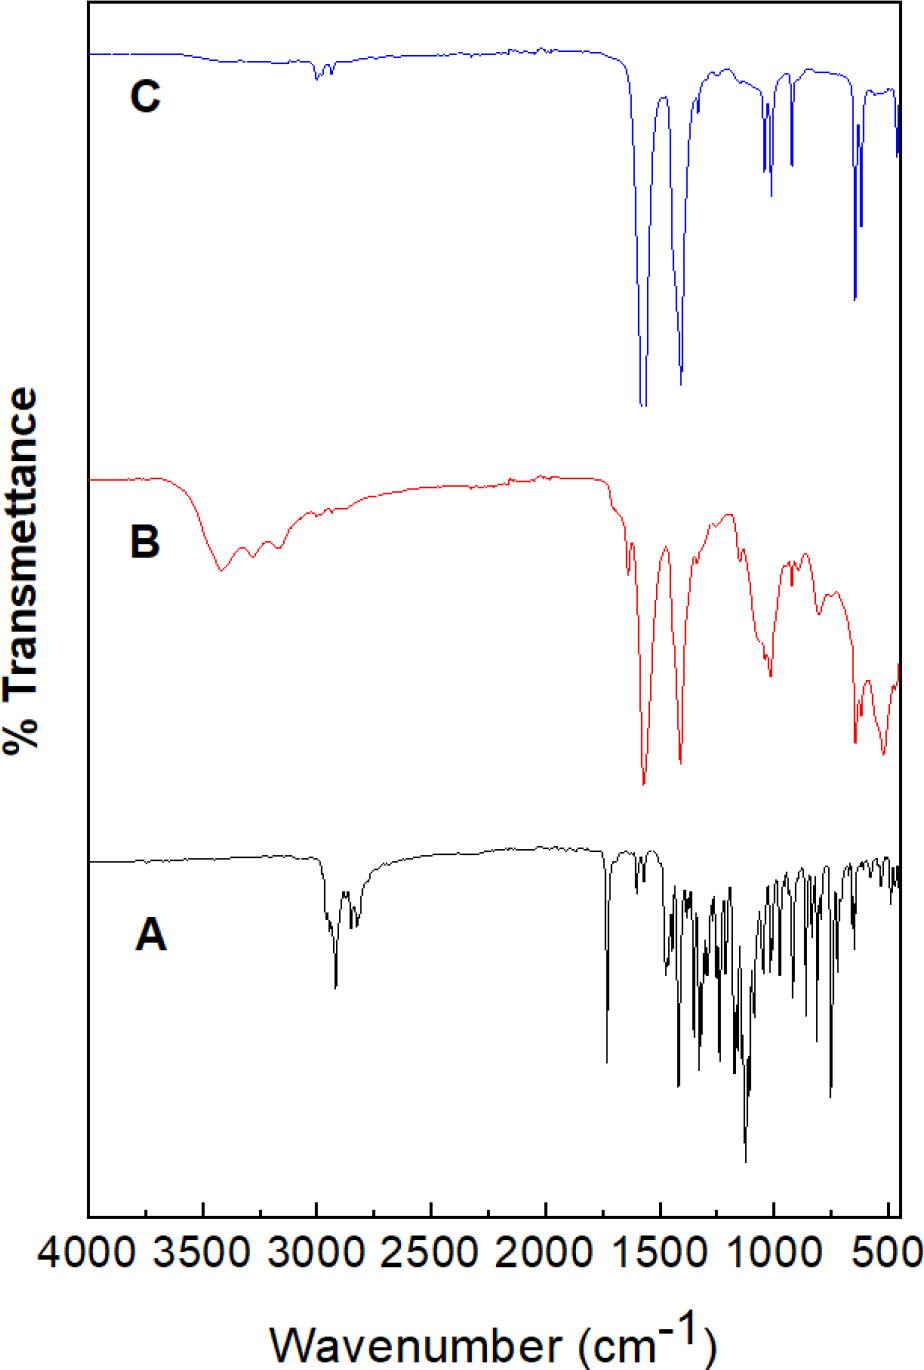
Fig. 6
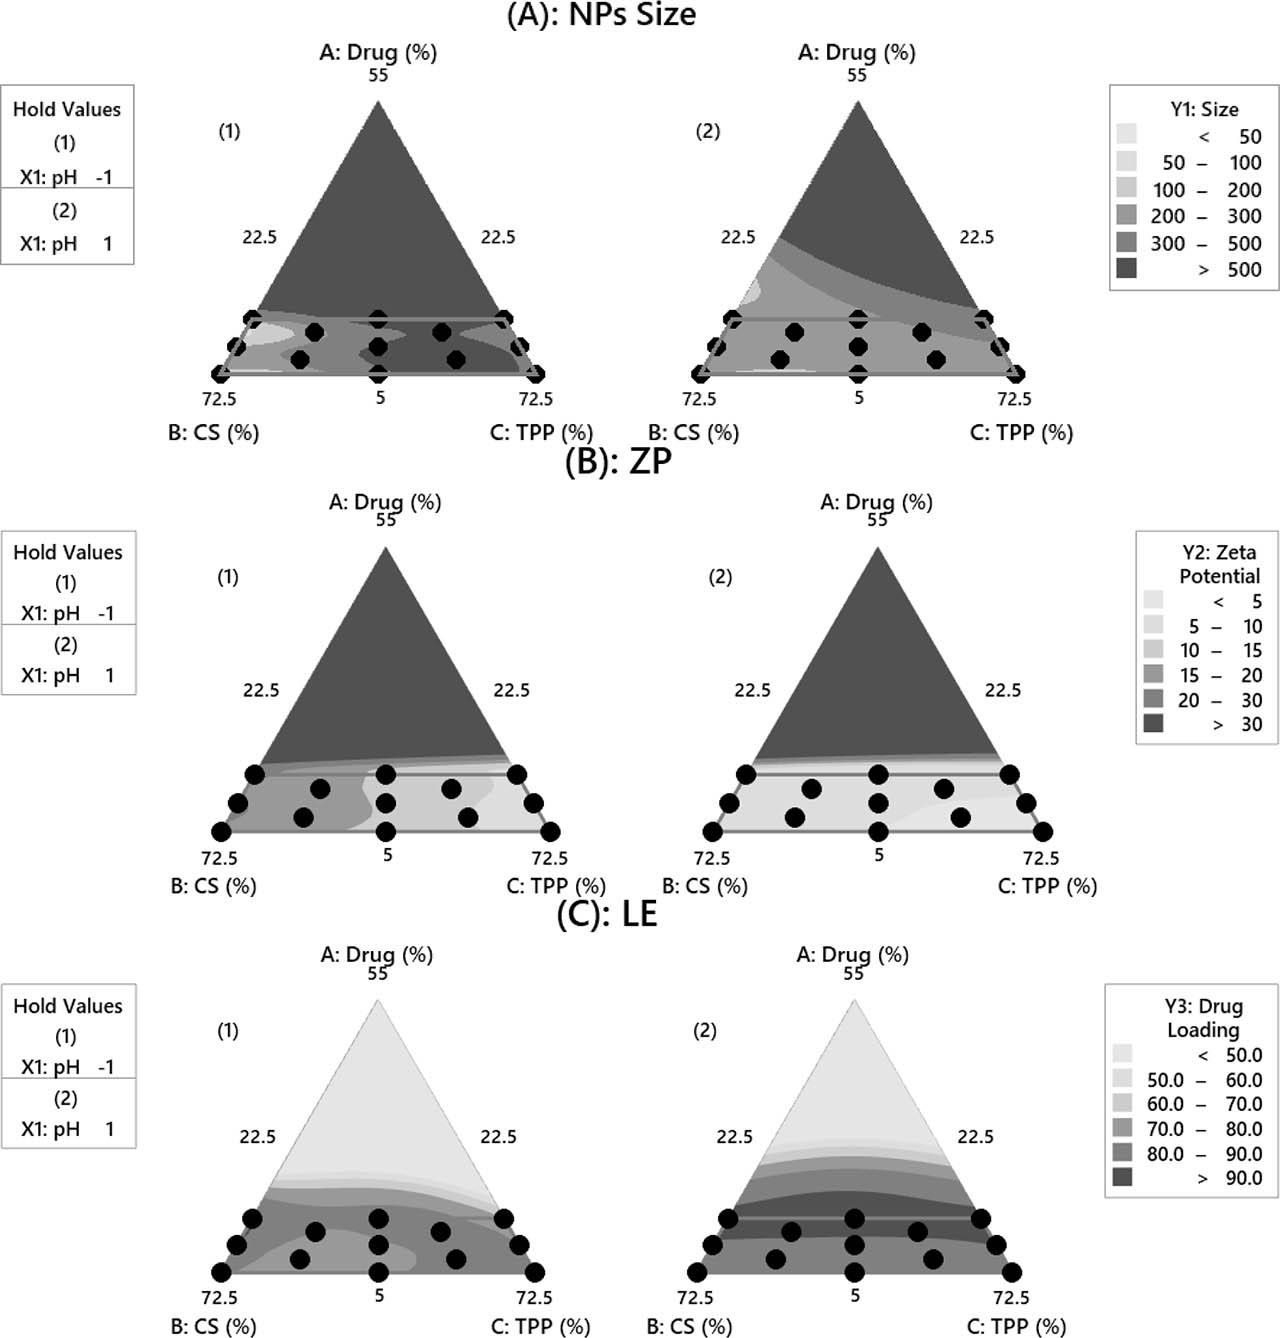
Fig. 7
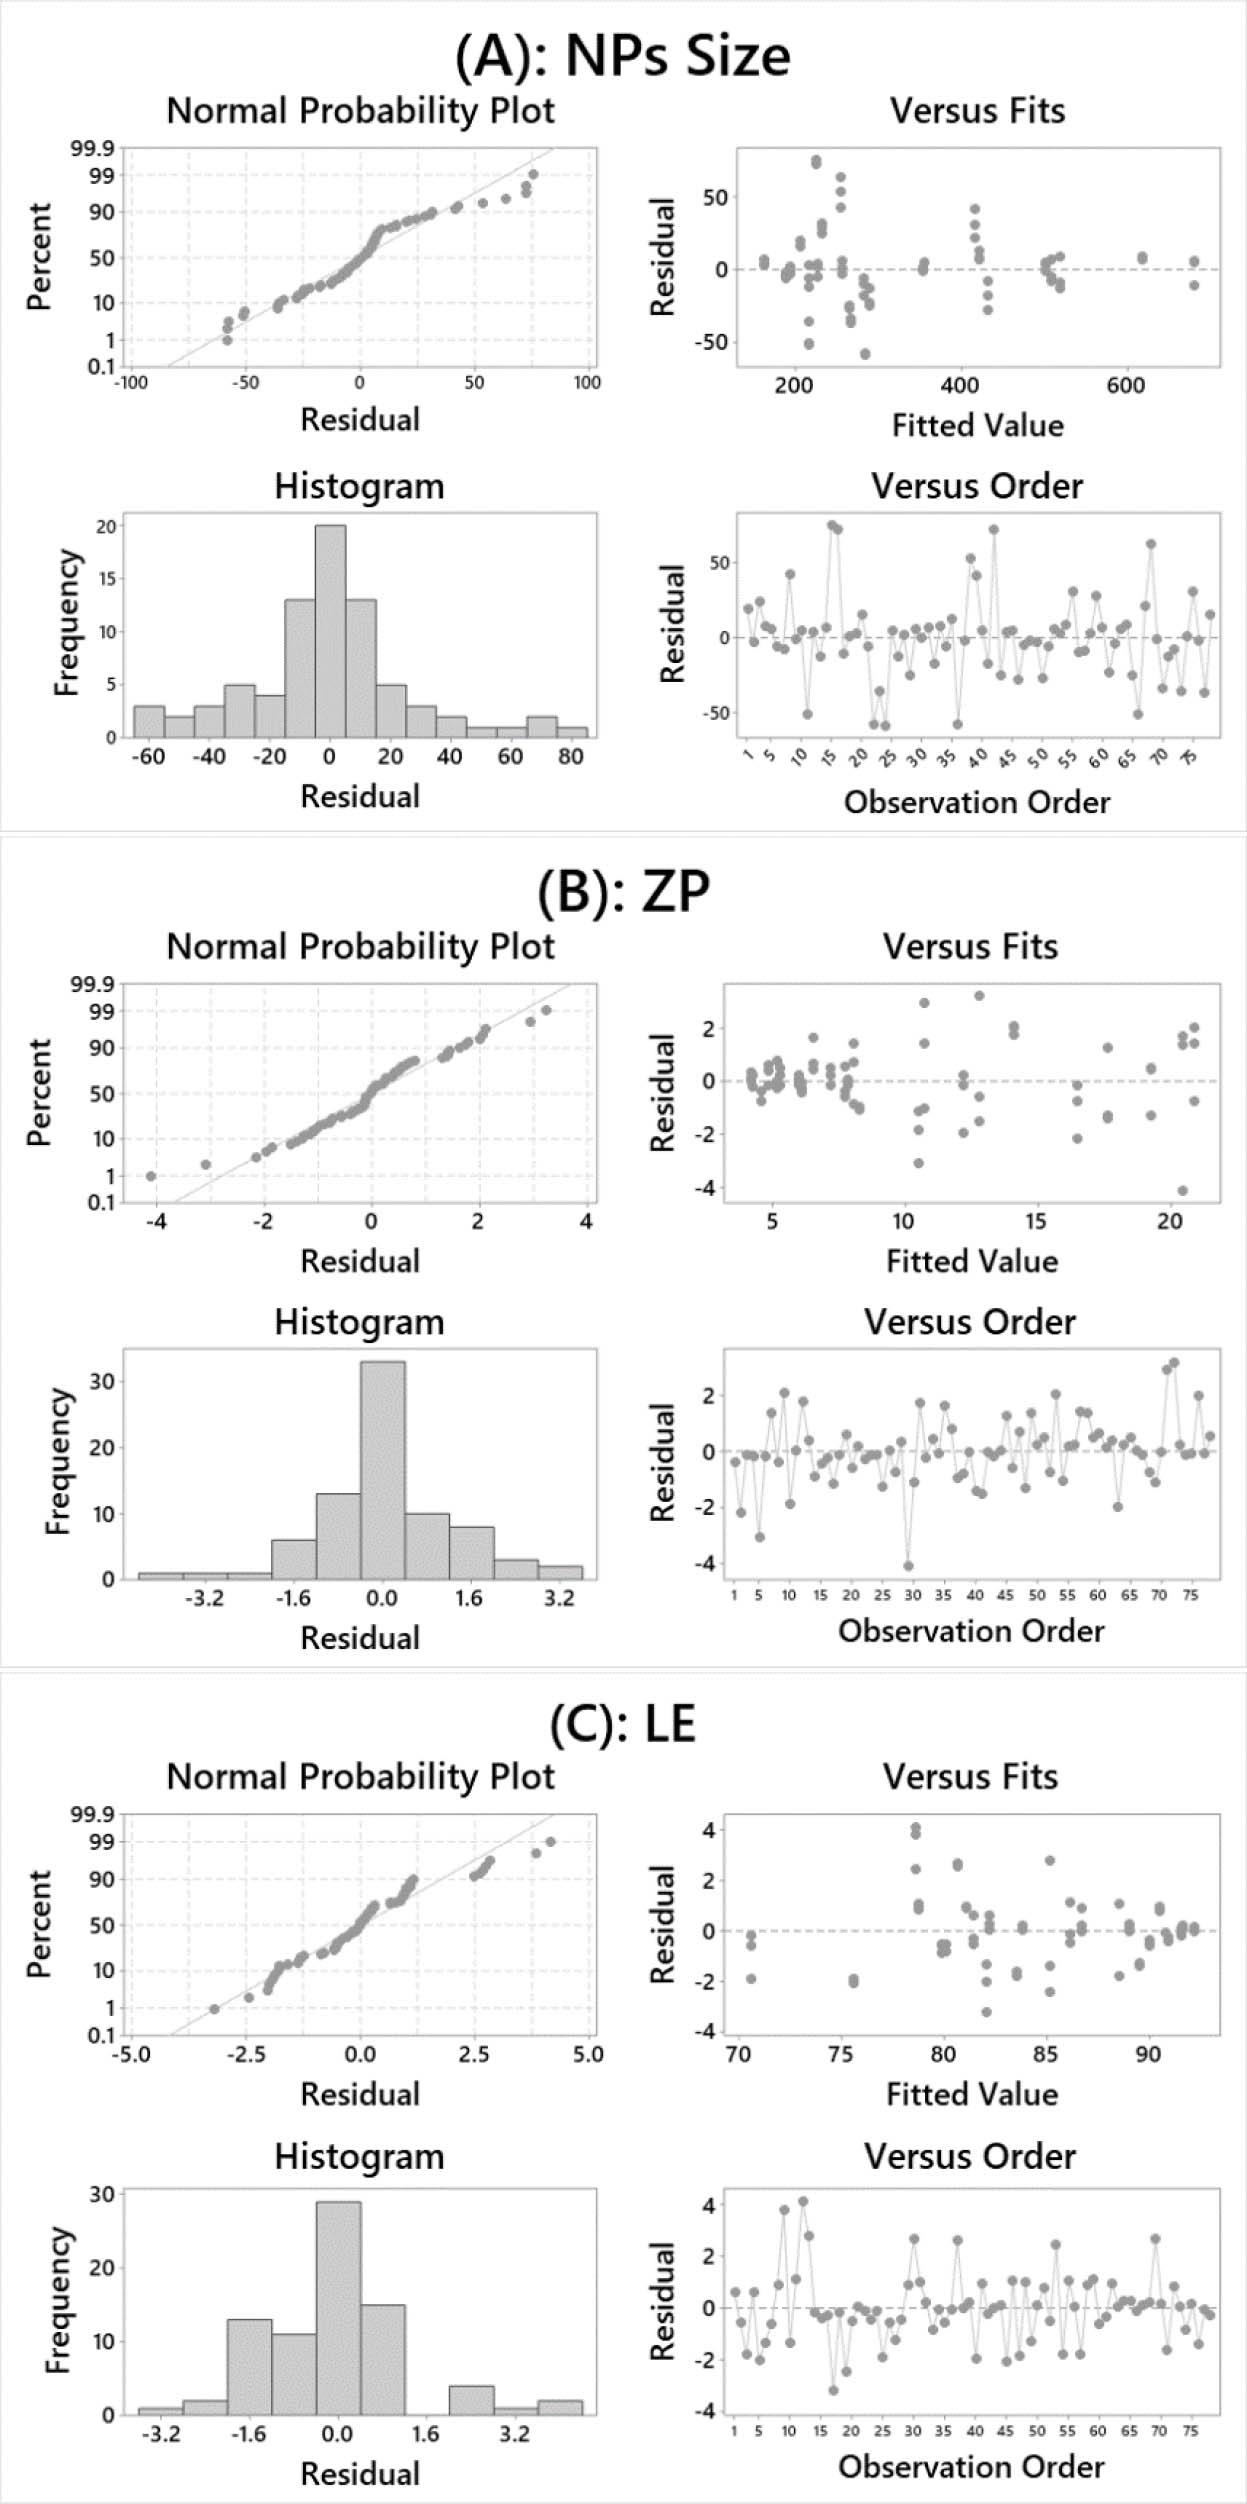
Fig. 8
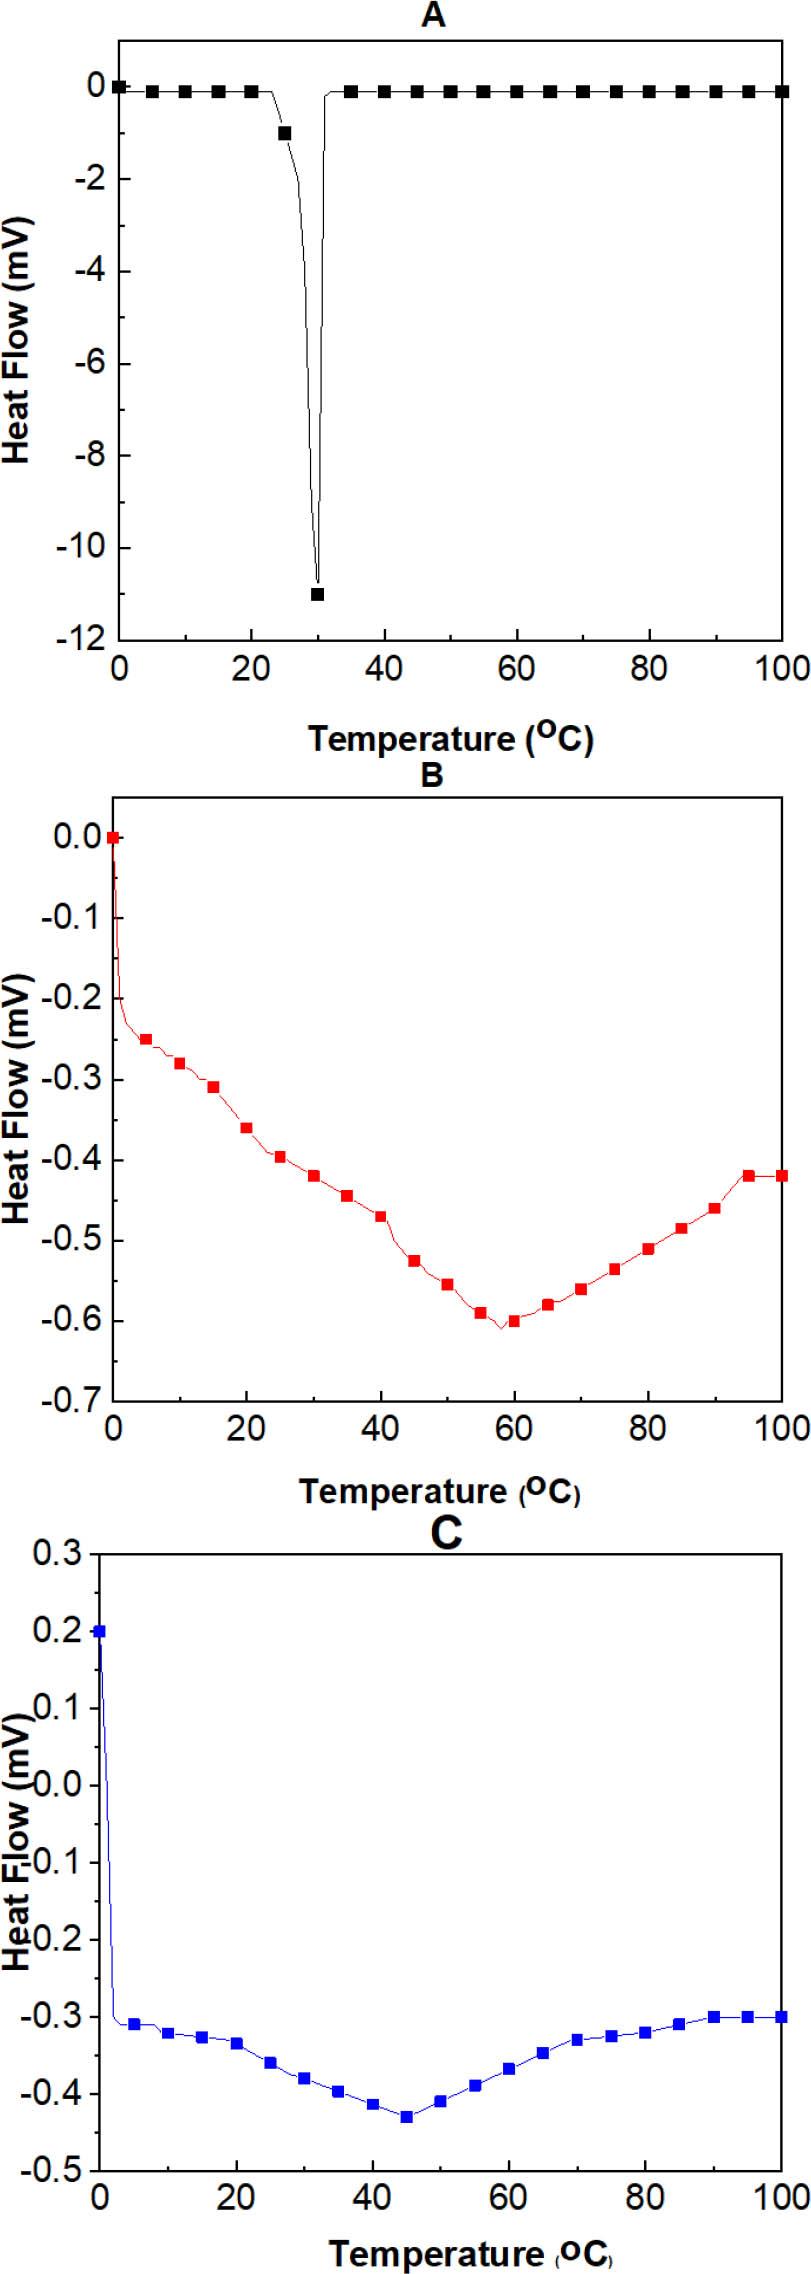
Fig. 9

Fig. 10

Fig. 11

Fig. 12
ANOVA for size-screening study
| Source | DF | Seq SS | Adj SS | Adj MS | F-value | P-value |
|---|---|---|---|---|---|---|
| Regression | 11 | 65411864 | 65411864 | 5946533 | 901.35 | 0.000 |
| Component only | ||||||
| Linear | 2 | 16852012 | 25941727 | 12970863 | 1966.06 | 0.000 |
| Quadratic | 1 | 10563934 | 10563934 | 10563934 | 1601.23 | 0.000 |
| A × B | 1 | 10563934 | 10563934 | 10563934 | 1601.23 | 0.000 |
| Component × X1 | ||||||
| Linear | 3 | 26622324 | 34654360 | 11551453 | 1750.92 | 0.000 |
| A × X1 | 1 | 16413096 | 19779395 | 19779395 | 2998.07 | 0.000 |
| B × X1 | 1 | 9152068 | 955902 | 955902 | 144.89 | 0.000 |
| C × X1 | 1 | 1057159 | 3609045 | 3609045 | 547.04 | 0.000 |
| Quadratic | 1 | 11360884 | 11360884 | 11360884 | 1722.03 | 0.000 |
| A × B × X1 | 1 | 11360884 | 11360884 | 11360884 | 1722.03 | 0.000 |
| Component × X2 | ||||||
| Linear | 3 | 6511 | 12619 | 4206 | 0.64 | 0.629 |
| A × X2 | 1 | 520 | 10879 | 10879 | 1.65 | 0.268 |
| B × X2 | 1 | 1446 | 1701 | 1701 | 0.26 | 0.638 |
| C × X2 | 1 | 4545 | 10744 | 10744 | 1.63 | 0.271 |
| Quadratic | 1 | 6200 | 6200 | 6200 | 0.94 | 0.387 |
| A × B × X2 | 1 | 6200 | 6200 | 6200 | 0.94 | 0.387 |
| Residual Error | 4 | 26390 | 26390 | 6597 | ||
| Total | 15 | 65438254 |
Screening DoE model with experimental values
| Runs | Independent variables | Responses | ||||||
|---|---|---|---|---|---|---|---|---|
| (A) | (B) | (C) | (X1) | (X2) | Size (nm) | ZP (mV) | LE (%) | |
| Run 1 | 15 | 62.5 | 22.5 | 6.0 | 18 | 252 | 7.9 | 97.6 |
| Run 2 | 15 | 22.5 | 62.5 | 6.0 | 3 | 219 | 4.0 | 96.8 |
| Run 3 | 5 | 22.5 | 72.5 | 6.0 | 18 | 324 | 4.4 | 94.0 |
| Run 4 | 5 | 72.5 | 22.5 | 4.0 | 3 | 152 | 24.0 | 85.8 |
| Run 5 | 15 | 62.5 | 22.5 | 6.0 | 3 | 258 | 8.0 | 97.4 |
| Run 6 | 5 | 22.5 | 72.5 | 6.0 | 3 | 389 | 4.3 | 94.2 |
| Run 7 | 15 | 22.5 | 62.5 | 6.0 | 18 | 197 | 4.5 | 97.0 |
| Run 8 | 5 | 72.5 | 22.5 | 6.0 | 3 | 279 | 7.2 | 92.6 |
| Run 9 | 15 | 62.5 | 22.5 | 4.0 | 3 | 148 | 24.1 | 91.2 |
| Run 10 | 15 | 62.5 | 22.5 | 4.0 | 18 | 159 | 21.2 | 91.1 |
| Run 11 | 5 | 22.5 | 72.5 | 4.0 | 18 | 549 | 6.9 | 83.4 |
| Run 12 | 15 | 22.5 | 62.5 | 4.0 | 3 | 642 | 7.6 | 84.6 |
| Run 13 | 5 | 72.5 | 22.5 | 4.0 | 18 | 150 | 28.0 | 84.0 |
| Run 14 | 5 | 72.5 | 22.5 | 6.0 | 18 | 279 | 7.9 | 92.7 |
| Run 15 | 5 | 22.5 | 72.5 | 4.0 | 3 | 302 | 6.8 | 83.3 |
| Run 16 | 15 | 22.5 | 62.5 | 4.0 | 18 | 631 | 7.6 | 84.8 |
ANOVA for LE-screening study
| Source | DF | Seq SS | Adj SS | Adj MS | F-value | P-value |
|---|---|---|---|---|---|---|
| Regression | 11 | 448.552 | 448.552 | 40.7774 | 172.15 | 0.000 |
| Component Only | ||||||
| Linear | 2 | 68.186 | 10.791 | 5.3954 | 22.78 | 0.007 |
| Quadratic | 1 | 14.811 | 14.811 | 14.8113 | 62.53 | 0.001 |
| A × B | 1 | 14.811 | 14.811 | 14.8113 | 62.53 | 0.001 |
| Component × X1 | ||||||
| Linear | 3 | 361.159 | 190.177 | 63.3923 | 267.62 | 0.000 |
| A × X1 | 1 | 274.911 | 4.726 | 4.7263 | 19.95 | 0.011 |
| B × X1 | 1 | 7.779 | 10.489 | 10.4893 | 44.28 | 0.003 |
| C × X1 | 1 | 78.468 | 18.425 | 18.4246 | 77.78 | 0.001 |
| Quadratic | 1 | 3.629 | 3.629 | 3.6288 | 15.32 | 0.017 |
| A × B × X1 | 1 | 3.629 | 3.629 | 3.6288 | 15.32 | 0.017 |
| Component × X2 | ||||||
| Linear | 3 | 0.694 | 0.733 | 0.2442 | 1.03 | 0.469 |
| A × X2 | 1 | 0.001 | 0.000 | 0.0000 | 0.00 | 0.995 |
| B × X2 | 1 | 0.681 | 0.493 | 0.4929 | 2.08 | 0.223 |
| C × X2 | 1 | 0.013 | 0.018 | 0.0177 | 0.07 | 0.798 |
| Quadratic | 1 | 0.073 | 0.073 | 0.0732 | 0.31 | 0.608 |
| A × B × X2 | 1 | 0.073 | 0.073 | 0.0732 | 0.31 | 0.608 |
| Residual Error | 4 | 0.948 | 0.948 | 0.2369 | ||
| Total | 15 | 449.499 |
Pareto solutions
| Solution no. | Size | ZP | LE |
|---|---|---|---|
| S1 | 215.6 | 21.5 | 88.8 |
| S2 | 204.1 | 21.4 | 89.4 |
| S3 | 198.0 | 21.3 | 89.6 |
| S4 | 191.9 | 21.2 | 89.8 |
| S5 | 183.2 | 20.8 | 89.5 |
| S6 | 171.2 | 20.7 | 90.4 |
| S7 | 167.2 | 20.6 | 90.7 |
| S8 | 165.3 | 20.5 | 90.6 |
| S9 | 153.0 | 20.2 | 91.1 |
| S10 | 147.9 | 20.0 | 91.2 |
| S11 | 145.5 | 19.9 | 91.3 |
| S12 | 143.2 | 19.8 | 91.3 |
| S13 | 141.0 | 19.7 | 91.4 |
| S14 | 138.4 | 19.5 | 91.3 |
| S15 | 136.5 | 19.2 | 91.1 |
| S16 | 132.7 | 19.0 | 91.2 |
| S17 | 129.4 | 18.9 | 91.4 |
| S18 | 127.2 | 18.8 | 91.6 |
| S19 | 126.6 | 18.7 | 91.6 |
| S20 | 164.6 | 4.9 | 91.7 |
| S21 | 164.6 | 4.9 | 91.7 |
| S22 | 165.1 | 5.0 | 91.7 |
| S23 | 168.9 | 5.1 | 91.7 |
| S24 | 177.1 | 5.2 | 91.7 |
| S25 | 173.6 | 4.9 | 91.8 |
| S26 | 177.9 | 5.1 | 91.8 |
| S27 | 177.2 | 5.0 | 91.9 |
| S28 | 177.2 | 5.0 | 91.9 |
| S29 | 184.3 | 5.2 | 91.8 |
| S30 | 186.1 | 5.3 | 91.8 |
| S31 | 190.7 | 5.4 | 91.7 |
| S32 | 181.4 | 5.1 | 91.9 |
| S33 | 189.1 | 5.3 | 91.9 |
| S34 | 192.7 | 5.4 | 91.8 |
| S35 | 195.5 | 5.5 | 91.8 |
| S36 | 199.9 | 5.6 | 91.7 |
| S37 | 189.8 | 5.1 | 92.0 |
| S38 | 194.2 | 5.4 | 91.9 |
| S39 | 200.4 | 5.6 | 91.8 |
| S40 | 194.4 | 5.2 | 92.0 |
| S41 | 194.5 | 5.3 | 92.0 |
| S42 | 200.7 | 5.6 | 91.9 |
| S43 | 203.7 | 5.7 | 91.8 |
| S44 | 201.8 | 5.2 | 92.1 |
| S45 | 205.4 | 5.7 | 91.9 |
| S46 | 214.8 | 6.0 | 91.7 |
| S47 | 207.3 | 5.3 | 92.1 |
| S48 | 205.6 | 5.6 | 92.0 |
| S49 | 208.8 | 5.8 | 91.9 |
| S50 | 211.3 | 5.5 | 92.1 |
| S51 | 216.9 | 6.0 | 91.9 |
| S52 | 217.2 | 6.1 | 91.9 |
| S53 | 220.8 | 6.2 | 91.8 |
| S54 | 221.9 | 5.5 | 92.2 |
| S55 | 217.0 | 5.9 | 92.0 |
| S56 | 217.8 | 6.0 | 92.0 |
| S57 | 221.5 | 6.2 | 91.9 |
| S58 | 223.7 | 6.3 | 91.8 |
| S59 | 225.9 | 6.4 | 91.8 |
| S60 | 230.7 | 6.5 | 91.7 |
| S61 | 223.2 | 6.0 | 92.1 |
| S62 | 223.6 | 6.1 | 92.0 |
| S63 | 227.2 | 6.4 | 91.9 |
| S64 | 231.8 | 6.6 | 91.8 |
| S65 | 234.8 | 6.7 | 91.8 |
| S66 | 238.9 | 6.8 | 91.7 |
Validation experiments – data
| Run codes | NPs input fabrication parameters | Size (nm) | ZP (mV) | LE (%) | ||||||
|---|---|---|---|---|---|---|---|---|---|---|
| A | B | C | X−1 | Experimental Values | Predicted using Eq. (5) | Experimental | Predicted using Eq. (6) | Experimental Values | Predicted using Eq. (7) | |
| V1 | 131.0 | 20.4 | 93.0 | |||||||
| V2 | 130.0 | 21.3 | 91.3 | |||||||
| V3 | 128.2 | 20.0 | 92.6 | |||||||
| V4 | 13.3% | 64.2% | 22.5% | 4.0 | 125.4 | 126.6 | 19.0 | 18.7 | 91.4 | 91.6% |
| V5 | 129.0 | 22.0 | 92.0 | |||||||
| V6 | 132.0 | 20.0 | 93.1 | |||||||
| V7 | 125.4 | 17.7 | 92.5 | |||||||
| V8 | 126.0 | 18.0 | 90.4 | |||||||
| V9 | 127.0 | 18.4 | 92.5 | |||||||
| Mean | 128.2 | 126.6 | 19.6 | 18.7 | 92.1 | 91.6 | ||||
| Standard Deviation | 2.45 | – | 1.48 | – | 0.90 | – | ||||
| Test of hypothesis | H0: μ = 126.6 | H0: μ =18.7 | H0: μ = 91.6 | |||||||
| H1: μ ≠ 126.6 | H1: μ ≠ 18.7 | H1: μ ≠ 91.6 | ||||||||
| P-value | P-value = 0.082 | P-value = 0.092 | P-value = 0.140 | |||||||
| 95% CI for μ | (126.3–130.1 nm) | (18.5 – 20.8 mV) | (91.4–92.8%) | |||||||
ANOVA for ZP-screening study
| Source | DF | Seq SS | Adj SS | Adj MS | F-value | P-value |
|---|---|---|---|---|---|---|
| Regression | 11 | 1008.68 | 1008.68 | 91.698 | 77.30 | 0.000 |
| Component only | ||||||
| Linear | 2 | 426.63 | 256.25 | 128.124 | 108.01 | 0.000 |
| Quadratic | 1 | 0.23 | 0.23 | 0.231 | 0.19 | 0.682 |
| A × B | 1 | 0.23 | 0.23 | 0.231 | 0.19 | 0.682 |
| Component × X1 | ||||||
| Linear | 3 | 573.36 | 152.82 | 50.940 | 42.94 | 0.002 |
| A × X1 | 1 | 282.00 | 0.29 | 0.288 | 0.24 | 0.648 |
| B × X1 | 1 | 284.68 | 109.49 | 109.488 | 92.30 | 0.001 |
| C × X1 | 1 | 6.68 | 5.15 | 5.147 | 4.34 | 0.106 |
| Quadratic | 1 | 0.61 | 0.61 | 0.606 | 0.51 | 0.514 |
| A × B × X1 | 1 | 0.61 | 0.61 | 0.606 | 0.51 | 0.514 |
| Component × X2 | ||||||
| Linear | 3 | 4.00 | 7.66 | 2.553 | 2.15 | 0.236 |
| A × X2 | 1 | 0.08 | 0.91 | 0.914 | 0.77 | 0.430 |
| B × X2 | 1 | 2.84 | 6.67 | 6.671 | 5.62 | 0.077 |
| C × X2 | 1 | 1.08 | 0.67 | 0.671 | 0.57 | 0.494 |
| Quadratic | 1 | 3.84 | 3.84 | 3.842 | 3.24 | 0.146 |
| A × B × X2 | 1 | 3.84 | 3.84 | 3.842 | 3.24 | 0.146 |
| Residual Error | 4 | 4.74 | 4.74 | 1.186 | ||
| Total | 15 | 1013.42 |
Complete DoE study-data
| Run codes | Non-dependent variables | Responses | |||||
|---|---|---|---|---|---|---|---|
| (FZN) | (CS) | (TPP) | (pH) | Size | ZP | LE | |
| F01-1 | 5.0 | 72.50 | 22.50 | 6.0 | 225 | 7 | 82 |
| F01-2 | 5.0 | 72.50 | 22.50 | 6.0 | 221 | 7 | 81 |
| F01-3 | 5.0 | 72.50 | 22.50 | 6.0 | 221 | 8 | 81 |
| F02-1 | 12.5 | 53.75 | 33.75 | 4.0 | 253 | 14 | 80 |
| F02-2 | 12.5 | 53.75 | 33.75 | 4.0 | 262 | 16 | 80 |
| F02-3 | 12.5 | 53.75 | 33.75 | 4.0 | 257 | 16 | 79 |
| F03-1 | 10.0 | 45.00 | 45.00 | 6.0 | 255 | 5 | 87 |
| F03-2 | 10.0 | 45.00 | 45.00 | 6.0 | 262 | 5 | 90 |
| F03-3 | 10.0 | 45.00 | 45.00 | 6.0 | 259 | 6 | 90 |
| F04-1 | 15.0 | 42.50 | 42.50 | 4.0 | 626 | 12 | 83 |
| F04-2 | 15.0 | 42.50 | 42.50 | 4.0 | 625 | 10 | 82 |
| F04-3 | 15.0 | 42.50 | 42.50 | 4.0 | 627 | 12 | 82 |
| F05-1 | 7.5 | 33.75 | 58.75 | 4.0 | 687 | 7 | 80 |
| F05-2 | 7.5 | 33.75 | 58.75 | 4.0 | 686 | 9 | 81 |
| F05-3 | 7.5 | 33.75 | 58.75 | 4.0 | 670 | 9 | 79 |
| F06-1 | 5.0 | 47.50 | 47.50 | 6.0 | 209 | 5 | 84 |
| F06-2 | 5.0 | 47.50 | 47.50 | 6.0 | 203 | 5 | 88 |
| F06-3 | 5.0 | 47.50 | 47.50 | 6.0 | 217 | 5 | 83 |
| F07-1 | 15.0 | 22.50 | 62.50 | 4.0 | 499 | 9 | 70 |
| F07-2 | 15.0 | 22.50 | 62.50 | 4.0 | 514 | 7 | 70 |
| F07-3 | 15.0 | 22.50 | 62.50 | 4.0 | 502 | 9 | 69 |
| F08-1 | 7.5 | 33.75 | 58.75 | 6.0 | 297 | 4 | 88 |
| F08-2 | 7.5 | 33.75 | 58.75 | 6.0 | 307 | 4 | 87 |
| F08-3 | 7.5 | 33.75 | 58.75 | 6.0 | 317 | 4 | 87 |
| F09-1 | 10.0 | 45.00 | 45.00 | 4.0 | 501 | 16 | 82 |
| F09-2 | 10.0 | 45.00 | 45.00 | 4.0 | 506 | 16 | 83 |
| F09-3 | 10.0 | 45.00 | 45.00 | 4.0 | 504 | 16 | 81 |
| F10-1 | 7.5 | 58.75 | 33.75 | 6.0 | 164 | 6 | 87 |
| F10-2 | 7.5 | 58.75 | 33.75 | 6.0 | 179 | 6 | 86 |
| F10-3 | 7.5 | 58.75 | 33.75 | 6.0 | 164 | 6 | 86 |
| F11-1 | 12.5 | 53.75 | 33.75 | 6.0 | 299 | 6 | 91 |
| F11-2 | 12.5 | 53.75 | 33.75 | 6.0 | 296 | 6 | 91 |
| F11-3 | 12.5 | 53.75 | 33.75 | 6.0 | 297 | 6 | 91 |
| F12-1 | 15.0 | 62.50 | 22.50 | 6.0 | 228 | 8 | 91 |
| F12-2 | 15.0 | 62.50 | 22.50 | 6.0 | 221 | 8 | 91 |
| F12-3 | 15.0 | 62.50 | 22.50 | 6.0 | 230 | 8 | 92 |
| F13-1 | 5.0 | 22.50 | 72.50 | 6.0 | 276 | 4 | 84 |
| F13-2 | 5.0 | 22.50 | 72.50 | 6.0 | 264 | 4 | 84 |
| F13-3 | 5.0 | 22.50 | 72.50 | 6.0 | 272 | 4 | 84 |
| F14-1 | 12.5 | 33.75 | 53.75 | 6.0 | 226 | 5 | 91 |
| F14-2 | 12.5 | 33.75 | 53.75 | 6.0 | 225 | 5 | 91 |
| F14-3 | 12.5 | 33.75 | 53.75 | 6.0 | 225 | 6 | 91 |
| F15-1 | 7.5 | 58.75 | 33.75 | 4.0 | 360 | 16 | 74 |
| F15-2 | 7.5 | 58.75 | 33.75 | 4.0 | 360 | 16 | 74 |
| F15-3 | 7.5 | 58.75 | 33.75 | 4.0 | 360 | 19 | 74 |
| F16-1 | 10.0 | 22.50 | 67.50 | 6.0 | 277 | 4 | 89 |
| F16-2 | 10.0 | 22.50 | 67.50 | 6.0 | 265 | 5 | 90 |
| F16-3 | 10.0 | 22.50 | 67.50 | 6.0 | 267 | 4 | 90 |
| F17-1 | 10.0 | 67.50 | 22.50 | 4.0 | 195 | 20 | 88 |
| F17-2 | 10.0 | 67.50 | 22.50 | 4.0 | 190 | 22 | 88 |
| F17-3 | 10.0 | 67.50 | 22.50 | 4.0 | 191 | 23 | 88 |
| F18-1 | 5.0 | 72.50 | 22.50 | 4.0 | 167 | 16 | 82 |
| F18-2 | 5.0 | 72.50 | 22.50 | 4.0 | 168 | 22 | 82 |
| F18-3 | 5.0 | 72.50 | 22.50 | 4.0 | 164 | 22 | 82 |
| F19-1 | 10.0 | 22.50 | 67.50 | 4.0 | 353 | 7 | 83 |
| F19-2 | 10.0 | 22.50 | 67.50 | 4.0 | 351 | 7 | 83 |
| F19-3 | 10.0 | 22.50 | 67.50 | 4.0 | 351 | 7 | 83 |
| F20-1 | 5.0 | 22.50 | 72.50 | 4.0 | 428 | 7 | 79 |
| F20-2 | 5.0 | 22.50 | 72.50 | 4.0 | 433 | 8 | 79 |
| F20-3 | 5.0 | 22.50 | 72.50 | 4.0 | 427 | 7 | 79 |
| F21-1 | 15.0 | 22.50 | 62.50 | 6.0 | 458 | 5 | 96 |
| F21-2 | 15.0 | 22.50 | 62.50 | 6.0 | 438 | 5 | 96 |
| F21-3 | 15.0 | 22.50 | 62.50 | 6.0 | 447 | 5 | 96 |
| F22-1 | 5.0 | 47.50 | 47.50 | 4.0 | 414 | 11 | 80 |
| F22-2 | 5.0 | 47.50 | 47.50 | 4.0 | 404 | 12 | 80 |
| F22-3 | 5.0 | 47.50 | 47.50 | 4.0 | 424 | 16 | 80 |
| F23-1 | 10.0 | 67.50 | 22.50 | 6.0 | 239 | 7 | 89 |
| F23-2 | 10.0 | 67.50 | 22.50 | 6.0 | 237 | 7 | 89 |
| F23-3 | 10.0 | 67.50 | 22.50 | 6.0 | 240 | 8 | 89 |
| F24-1 | 15.0 | 62.50 | 22.50 | 4.0 | 185 | 18 | 91 |
| F24-2 | 15.0 | 62.50 | 22.50 | 4.0 | 181 | 20 | 91 |
| F24-3 | 15.0 | 62.50 | 22.50 | 4.0 | 183 | 20 | 91 |
| F25-1 | 12.5 | 33.75 | 53.75 | 4.0 | 528 | 10 | 82 |
| F25-2 | 12.5 | 33.75 | 53.75 | 4.0 | 511 | 12 | 82 |
| F25-3 | 12.5 | 33.75 | 53.75 | 4.0 | 507 | 14 | 82 |
| F26-1 | 15.0 | 42.50 | 42.50 | 6.0 | 232 | 6 | 92 |
| F26-2 | 15.0 | 42.50 | 42.50 | 6.0 | 230 | 6 | 92 |
| F26-3 | 15.0 | 42.50 | 42.50 | 6.0 | 230 | 6 | 92 |
Regression model evaluations
| Model | R-seq (%) | R-seq (adj) (%) | R-seq (pred) (%) |
|---|---|---|---|
| Model (1): size | 96.23 | 95.24 | 94.12 |
| Model (2): ZP | 96.05 | 95.09 | 93.79 |
| Model (3): IE | 94.44 | 92.98 | 91.61 |