
Fig. 1
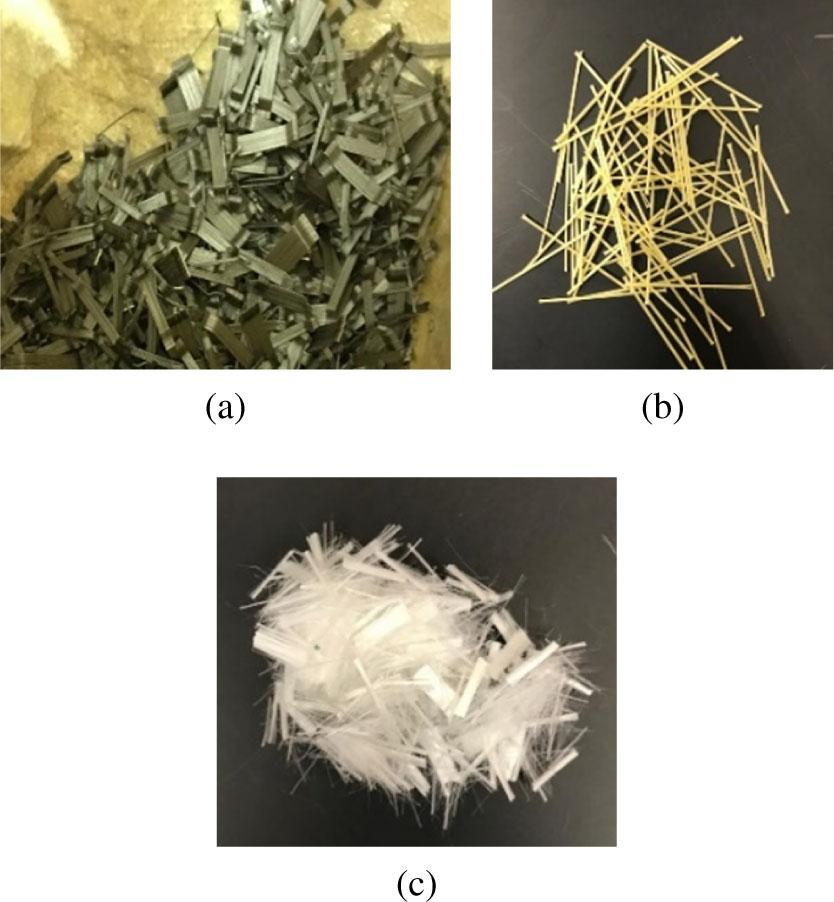
Fig. 2
Fig. 3
Fig. 4
Fig. 5
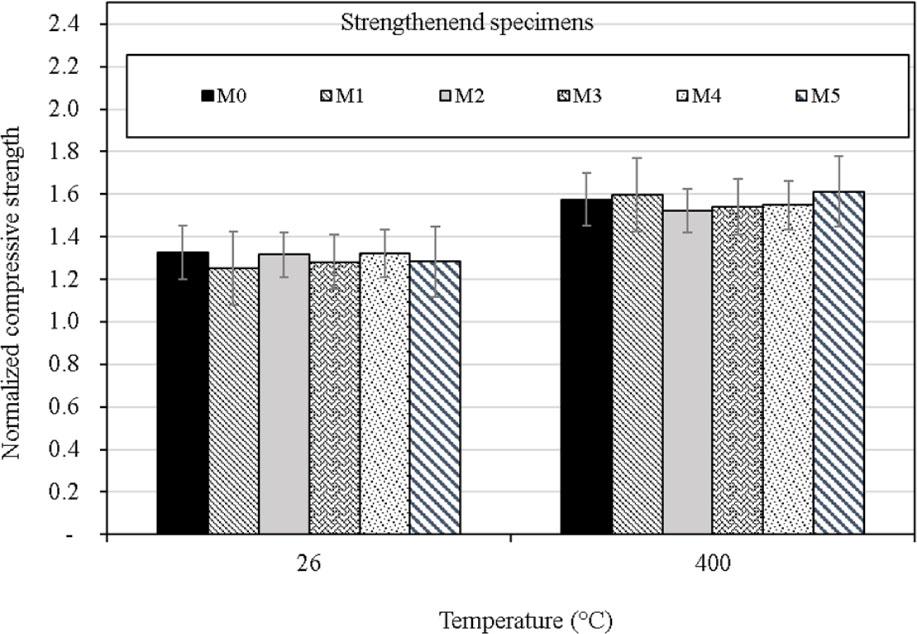
Fig. 6
Fig. 7
Fig. 8
Fig. 9
Fig. 10
Fig. 11
Fig. 12
Fig. 13
Test results summary of different UHPC mixes
| Mix | Compressive strength of concrete (MPa) | |||
|---|---|---|---|---|
| Before strengthened | After strengthened | |||
| Room Temp. | 400°C | Room Temp. | 400°C | |
| M0 | 120.3 | 90.32 (−24.6%) | 159.5 (32.6%) | 139 (53.9%) |
| M1 | 139.8 (16.2%) | 104.68 (−25.12%) | 175.1 (25.3%) | 167.2 (59.2%) |
| M2 | 134.6 (11.8%) | 110.19 (−18.2%) | 176.9 (31.4%) | 167.5 (52.0%) |
| M3 | 131.7 (9.5%) | 102.62 (−21.5%) | 167.5 (27.1%) | 158.2 (54.2%) |
| M4 | 128.2 (6.8%) | 99.70 (−22.3%) | 169.5 (32.2%) | 150.2 (50.7%) |
| M5 | 127.8 (6.5%) | 97.4 (23.7%) | 163.8 (28.2%) | 130.4 (33.9%) |
Mixture proportions of UHPC for 1 m3
| Material | Weight (kg/m3) |
|---|---|
| Cement | 900 |
| Micro silica | 222 |
| Fine quartz sand | 1,000 |
| Water | 164 |
| Fiber | 100 |
| Super-plasticizer | 30 |
Fresh properties of UHPC
| Mix No. | Slump (mm) | Unit weight (kg/m3) |
|---|---|---|
| M0 | 280 | 2,318 |
| M1 | 257 | 2,363 |
| M2 | 256 | 2,325 |
| M3 | 250 | 2,294 |
| M4 | 255 | 2,310 |
| M5 | 251 | 2,285 |
Fiber percent in different concrete mixes
| Concrete mix | Fiber percentage by volume (by weight) | ||
|---|---|---|---|
| PP | SF | PVA | |
| M0 | 0.0 (0.00) | 0.0 (0.00) | 0.0 (0.00) |
| M1 | 0.0 (0.00) | 1.0 (3.27) | 0.0 (0.00) |
| M2 | 0.0 (0.00) | 0.7 (2.29) | 0.3 (0.16) |
| M3 | 0.1 (0.04) | 0.7 (2.29) | 0.2 (0.00) |
| M4 | 0.0 (0.00) | 0.7 (2.29) | 0.2 (0.11) |
| M5 | 0.0 (0.00) | 0.5 (1.64) | 0.5 (0.27) |
Material properties for test specimens
| Material | Properties | Values |
|---|---|---|
| CFRP material | Thickness per layer (mm) | 0.6 |
| Ultimate tensile strength (MPa) | 1,122 | |
| Ultimate tensile strain | 1.7% | |
| Tensile modulus of elasticity (GPa) | 68.9 | |
| Epoxy adhesive for CFRP sheets | Tensile strength (MPa) | 71.5 |
| Tensile modulus of elasticity (GPa) | 1.86 | |
| Tensile strain at break 5.25% | 5.25% | |
| Glass transition temperature (°C) | 85 | |
| Thermal decomposition temperature (°C) | 345 | |
Physical and mechanical properties of fibers
| Fiber type | Properties of fibers | |||||
|---|---|---|---|---|---|---|
| Length (mm) | Shape | Section dimension (mm) | Specific gravity | Tensile strength (MPa) | Modulus of elasticity (GPa) | |
| SF | 30 | Hooked ends | Φ = 0.55 (Circular) | 7.85 | 1,345 | 200 |
| Polyvinyl alcohol (PVA) | 30 | straight | 0.66 ϕ (Circular) | 1.3 | 900 | 23 |
| PP | 30 | straight | 0.022 ϕ (Circular) | 0.90 | 550 | 4 |