
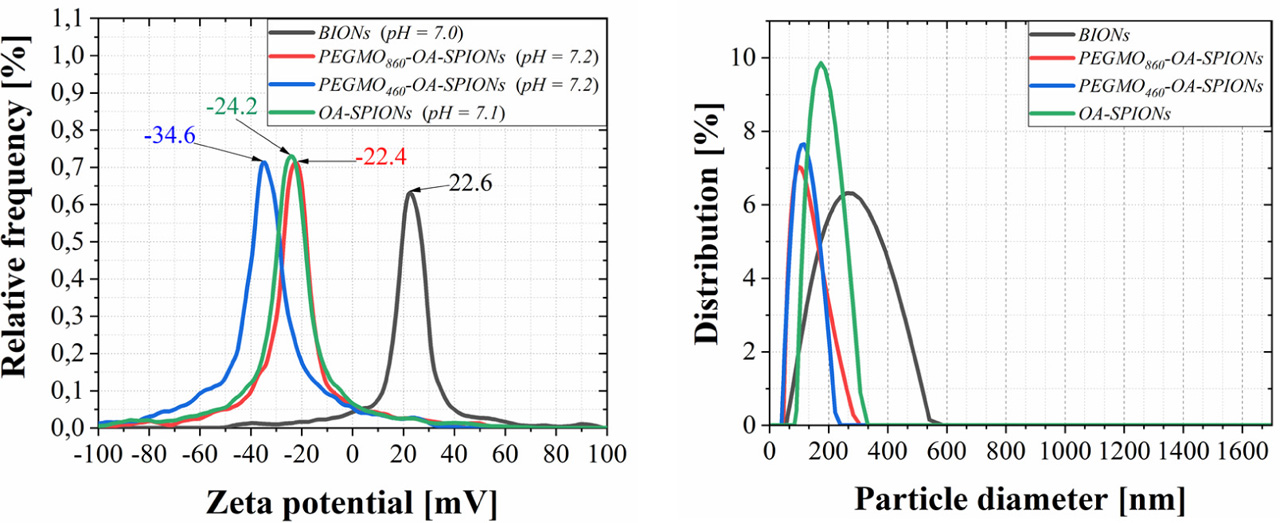
Fig. 1
The Zeta-potential and size distribution of particle agglomerates in the synthesized samples. BIONs, bare iron oxide nanoparticles; OA, oleic acid; PEGMO, poly(ethylene) glycol monooleate; SPIONs, superpara-magnetic iron oxide nanoparticles.
Table 1
ELS and DLS Experimental results of samples.
| Samples | Measurement temperature °C | Mean value of potential (mV) | Hydrodynamic diameter (nm) | Polydispersity index (%) |
|---|---|---|---|---|
| BIONs | 20 | 21.7 | 225 | 20.6 |
| OA-SPIONs | 20 | −24.2 | 182 | 22.0 |
| PEGMO860-OA-SPIONs | 20 | −23.3 | 101 | 19.5 |
| PEGMO460-OA-SPIONs | 20 | −34.5 | 110 | 23.2 |
[i] BIONs, bare iron oxide nanoparticles; DLS, dynamic light scattering; ELS, electrophoretic light scattering; OA, oleic acid; PEGMO, poly(ethylene) glycol monooleate; SPIONs, superparamagnetic iron oxide nanoparticles.
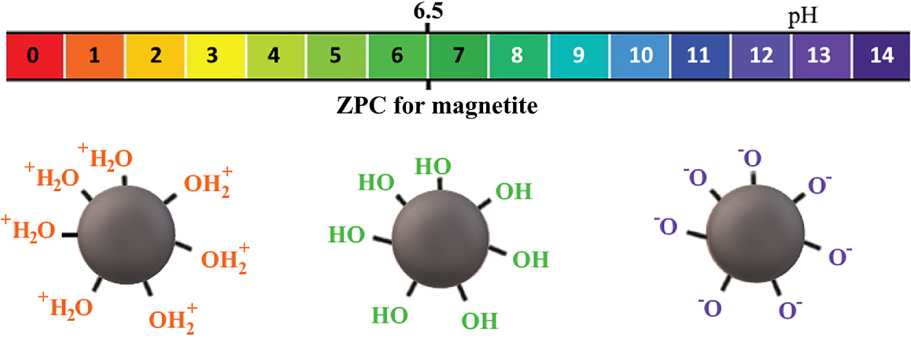
Fig. 2
Schematic representation of charges on the surface of magnetite nanoparticles as a function of pH. ZPC, zero-point charge.
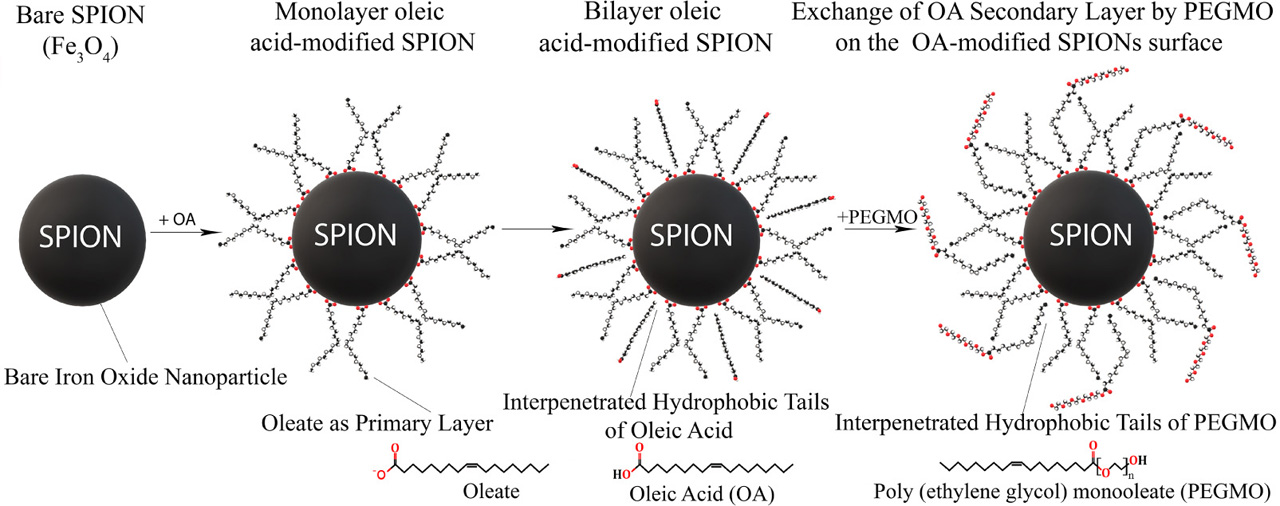
Fig. 3
Schematic depiction of the stabilization of Fe3O4 nanoparticles in water. OA, oleic acid; PEGMO, poly(ethylene) glycol monooleate; SPION, superparamagnetic iron oxide nanoparticles.
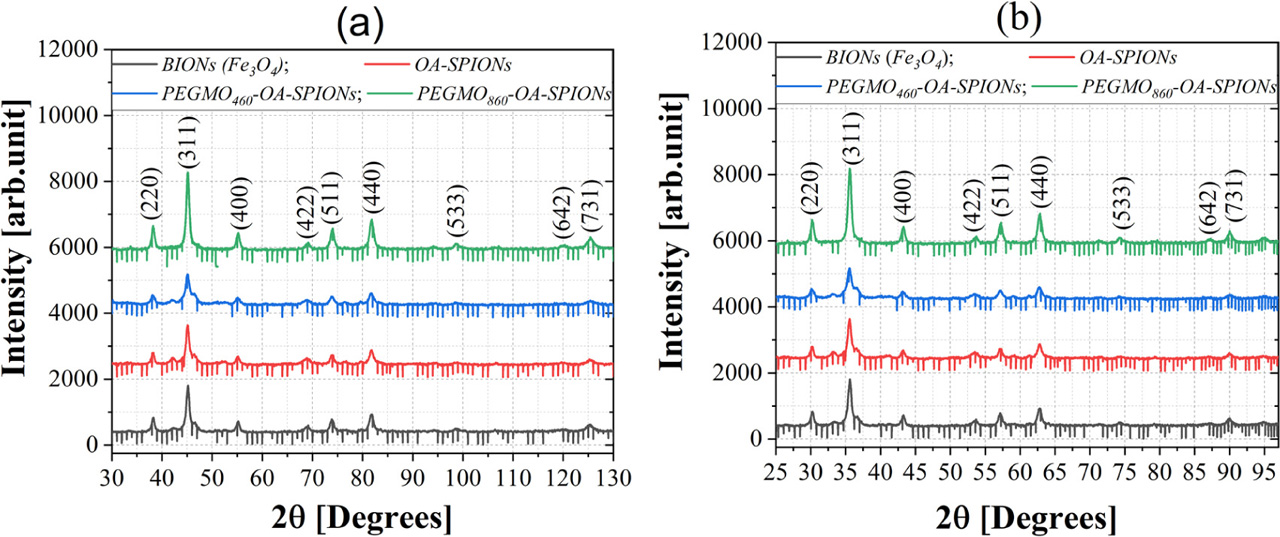
Fig. 4
Diffractograms of synthesized specimens taken with Fe Kα anode (λ = 1.937283 Å) (a), the same diffractograms converted to Cu Kα radiation (λ = 1.54178 Å) (b). BIONs, bare iron oxide nanoparticles; OA, oleic acid; PEGMO, poly(ethylene) glycol monooleate; SPIONs, superparamagnetic iron oxide nanoparticles.
Table 2
Average crystallite size of the samples calculated by Scherrer formula.
| Sample | Average size of crystallite estimated by XRD (Fe Kα; λ = 1.937Å) (nm) | Crystalline lattice parameter (Å) |
|---|---|---|
| BIONs | 20.0 | 8.3755 |
| OA–SPIONs | 21.8 | 8.3755 |
| PEGMO460–OA–SPIONs | 21.0 | 8.3725 |
| PEGMO860–OA–SPIONs | 23.1 | 8.3725 |
[i] BIONs, bare iron oxide nanoparticles; OA, oleic acid; PEGMO, poly(ethylene) glycol monooleate; SPIONs, superparamagnetic iron oxide nanoparticles; XRD, X-ray diffraction.
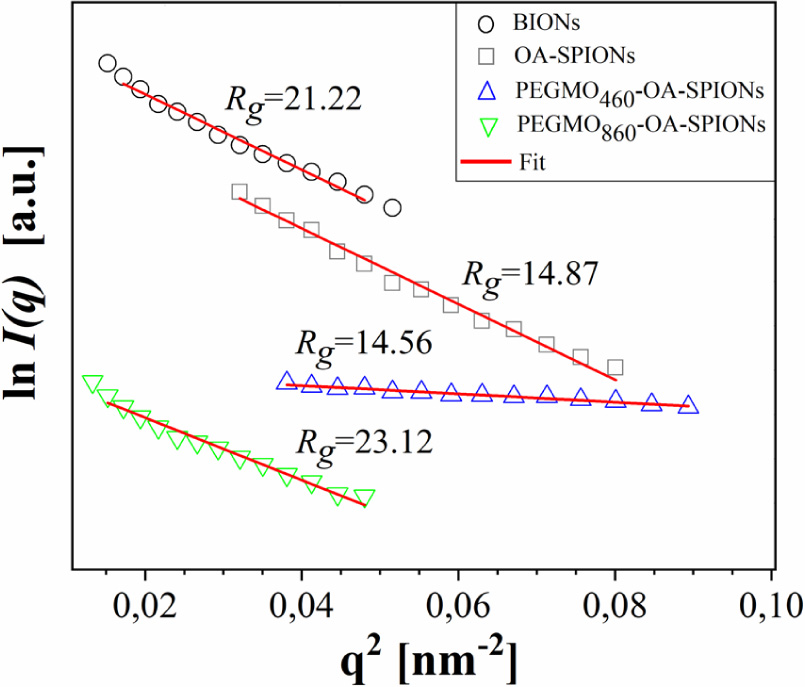
Fig. 5
Guinier plots for evaluating radius of gyration Rg for the colloid dispersions (the fitting of the reference model (red line) to experimental SAXS data (grey, blue, green). BIONs, bare iron oxide nanoparticles; OA, oleic acid; PEGMO, poly(ethylene) glycol monooleate; SPIONs, superparamagnetic iron oxide nanoparticles.
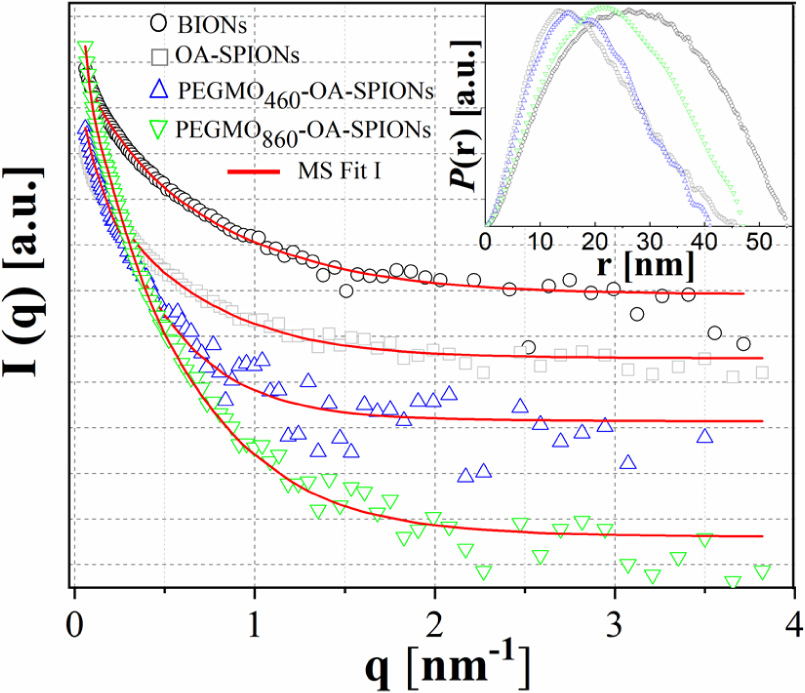
Fig. 6
McSAS fitting for evaluating size distribution and pair-distance distribution function p(r) obtained by GNOM. BIONs, bare iron oxide nanoparticles; OA, oleic acid; PEGMO, poly(ethylene) glycol monooleate; SPIONs, superparamagnetic iron oxide nanoparticles.
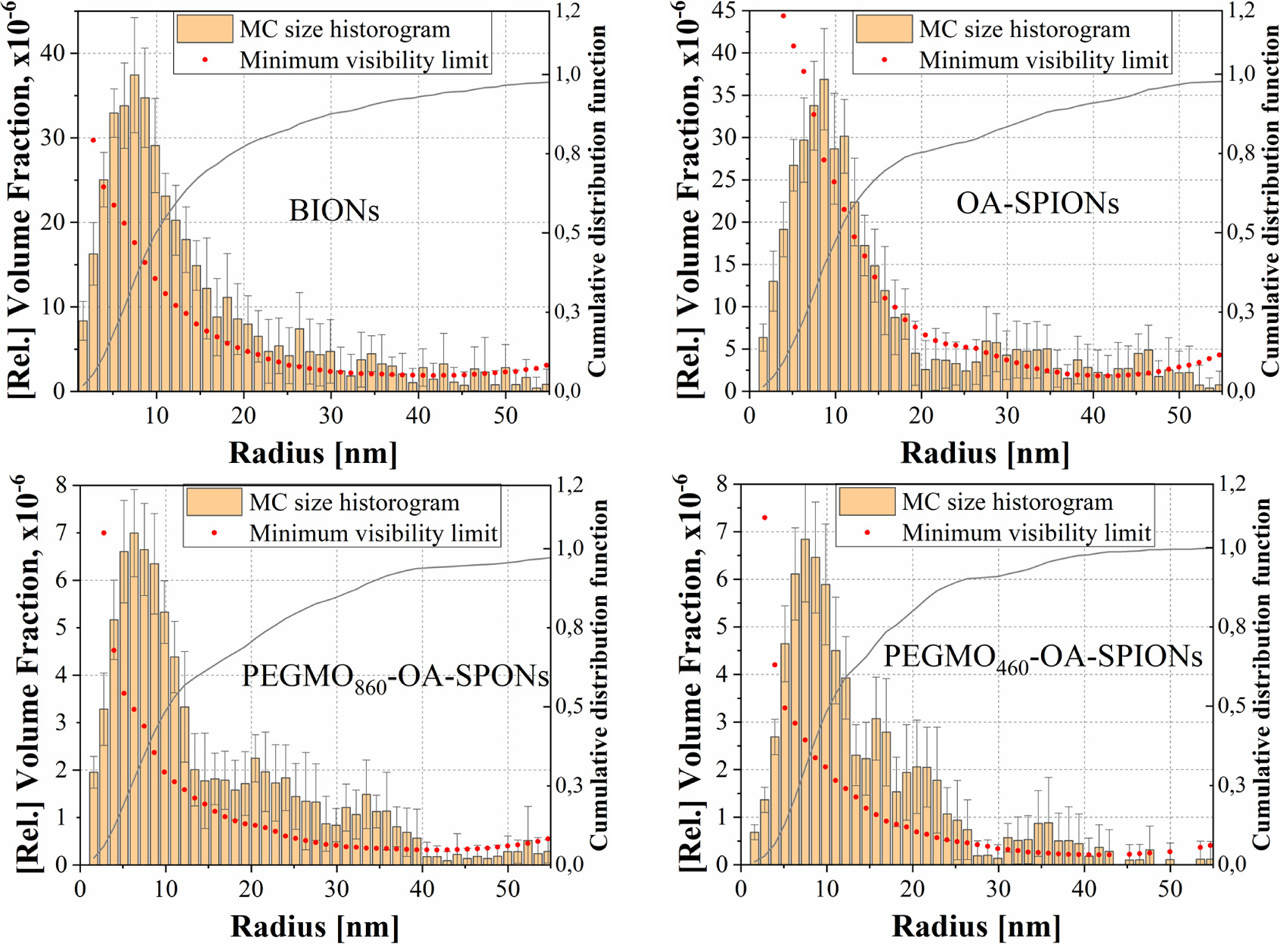
Fig. 7
Particle size distributions obtained using McSAS. BIONs, bare iron oxide nanoparticles; OA, oleic acid; PEGMO, poly(ethylene) glycol monooleate; SPIONs, superparamagnetic iron oxide nanoparticles.
Table 3
Nanoparticles average size obtained by SAXS measurement.
| Sample | Average radius of nanoparticles obtained by SAXS (nm) |
|---|---|
| BIONs | 14.6 |
| OA–SPIONs | 15.8 |
| PEGMO460–OA–SPIONs | 14.0 |
| PEGMO860–OA–SPIONs | 15.5 |
[i] BIONs, bare iron oxide nanoparticles; OA, oleic acid; PEGMO, poly(ethylene) glycol monooleate; SAXS, small-angle X-ray scattering; SPIONs, superparamagnetic iron oxide nanoparticles.
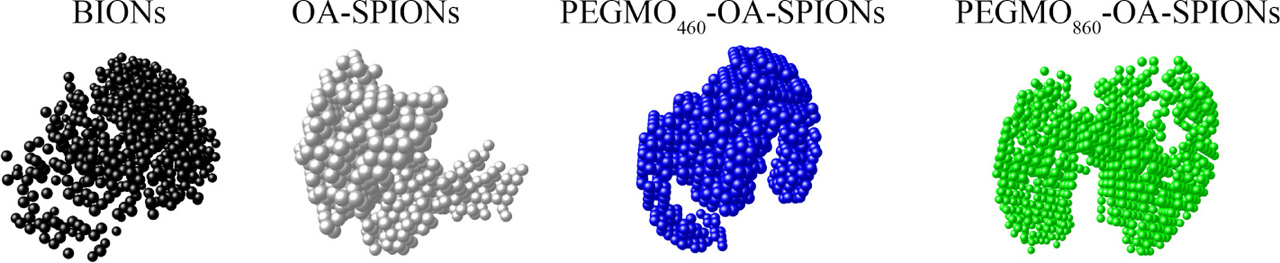
Fig. 8
Ab initio SAXS models of bare, OA-SPIONs, PEGMO460-OA-SPIONs, and PEGMO860-OA-SPIONs nanoparticles constructed using DAMMIN. OA, oleic acid; PEGMO, poly(ethylene) glycol monooleate; SAXS, small-angle X-ray scattering; SPIONs, superparamagnetic iron oxide nanoparticles.
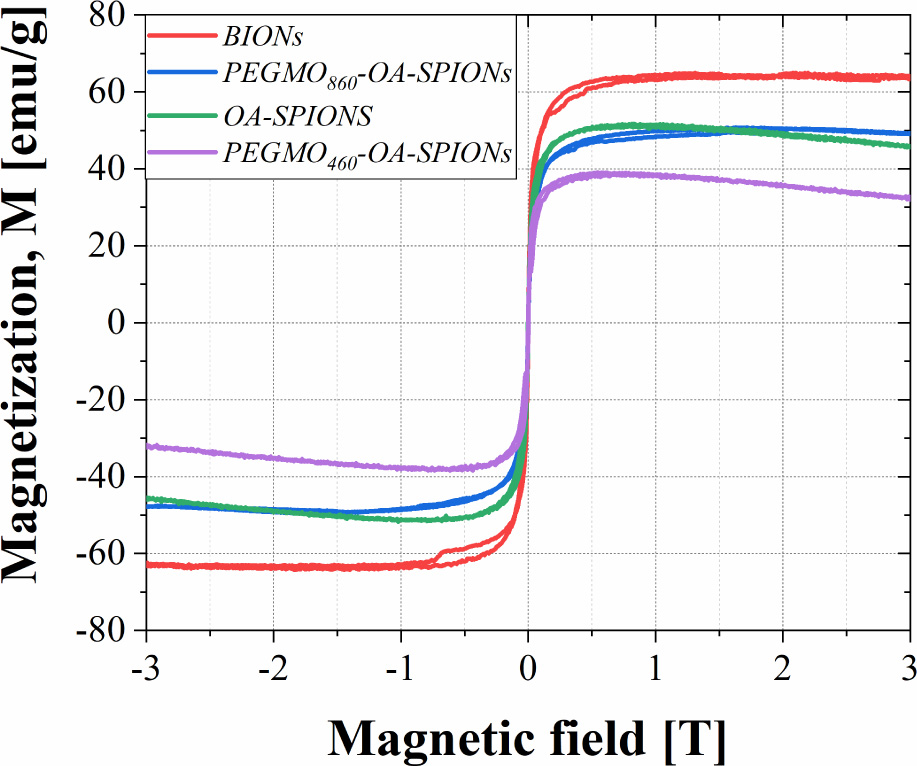
Fig. 9
Magnetization curves of synthesized samples at a temperature of 300 K. BIONs, bare iron oxide nanoparticles; OA, oleic acid; PEGMO, poly(ethylene) glycol monooleate; SPIONs, superparamagnetic iron oxide nanoparticles.
Table 4
Saturation magnetization of the samples.
| Samples | Saturation magnetization Ms (emu/g) |
|---|---|
| BIONs (Fe3O4) | 64.6 (Ha = 1.07 T) |
| OA-SPIONs | 51.1 (Ha = 1.07 T) |
| PEGMO460-OA-SPIONs | 39.0 (Ha = 1.00 T) |
| PEGMO860-OA-SPIONs | 48.9 (Ha = 1.07 T) |
[i] BIONs, bare iron oxide nanoparticles; OA, oleic acid; PEGMO, poly(ethylene) glycol monooleate; SPIONs, superparamagnetic iron oxide nanoparticles.
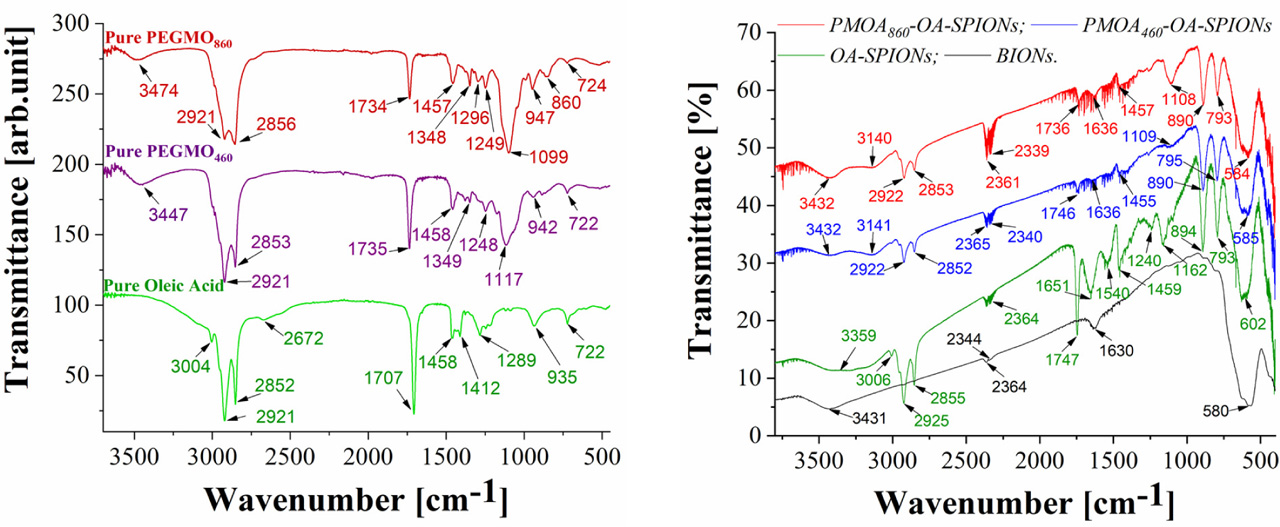
Fig. 10
FTIR spectra of pure OA, PEGMO460, and PEGMO860 in liquid form (left); FTIR spectra of BIONs, PEG460-OA-SPIONs, and PEG860-OA-SPIONs samples (right). BIONs, bare iron oxide nanoparticles; FTIR, fourier-transform infrared spectroscopy; OA, oleic acid; PEGMO, poly(ethylene) glycol monooleate; SPIONs, superparamagnetic iron oxide nanoparticles.