
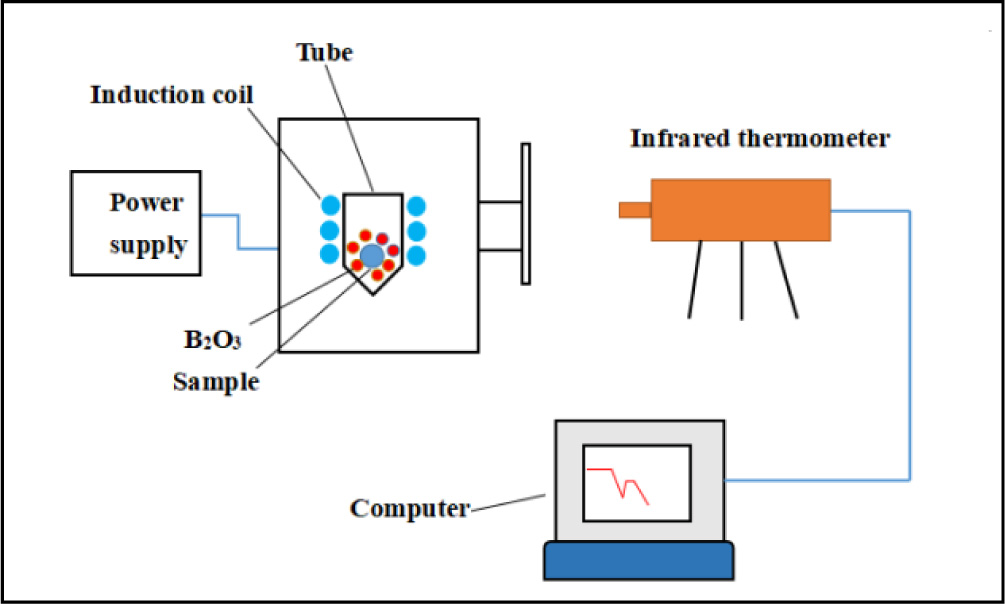
Fig. 1
Schematic diagram of undercooling experimental device.
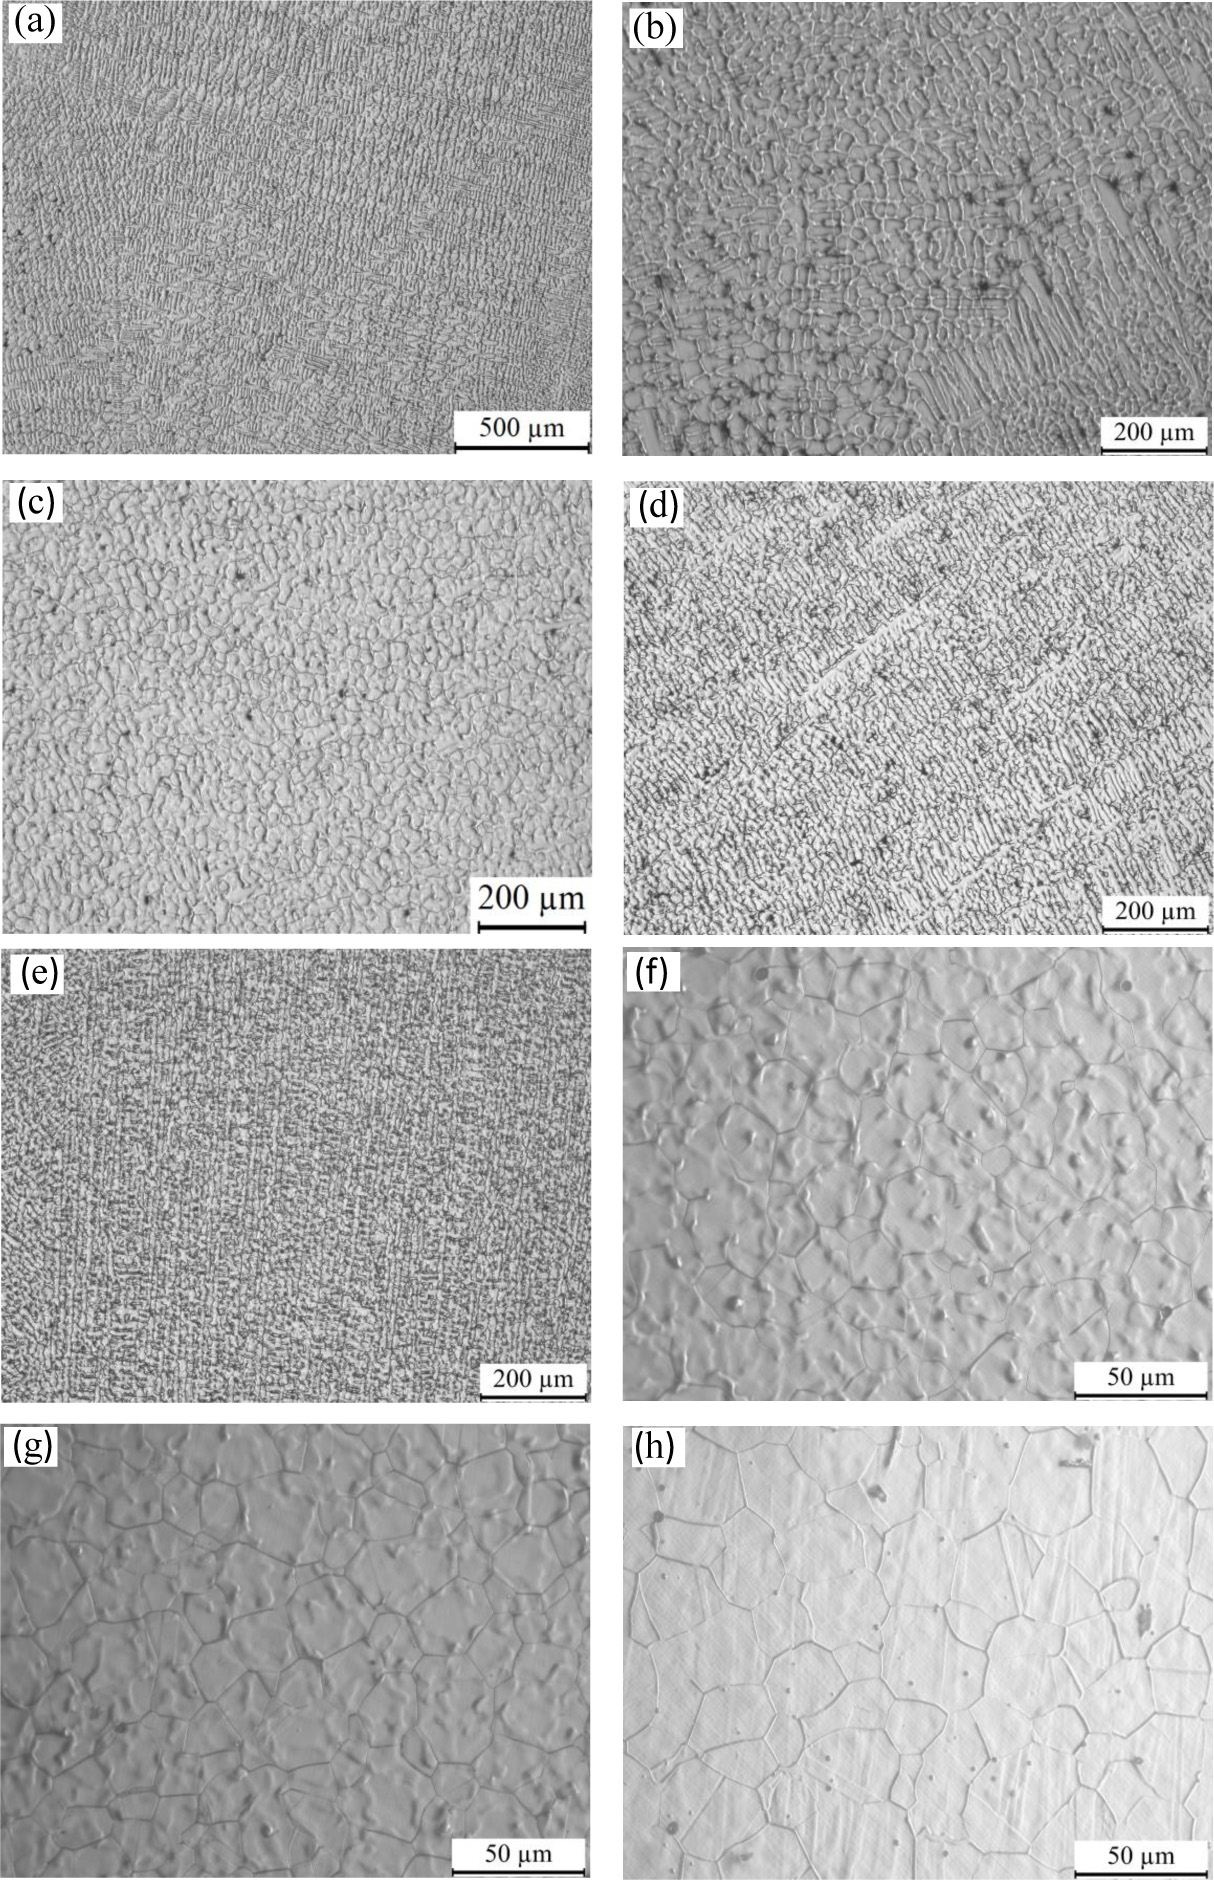
Fig. 2
Microstructure of Cu55Ni45 alloy under different undercooling degrees. [(A) ΔT = 47 K, (B) ΔT = 68 K, (C) ΔT = 70 K, (D) ΔT = 91 K, (E) ΔT = 187 K, (F) ΔT = 227 K, (G) ΔT = 272 K, (H) ΔT = 284 K].
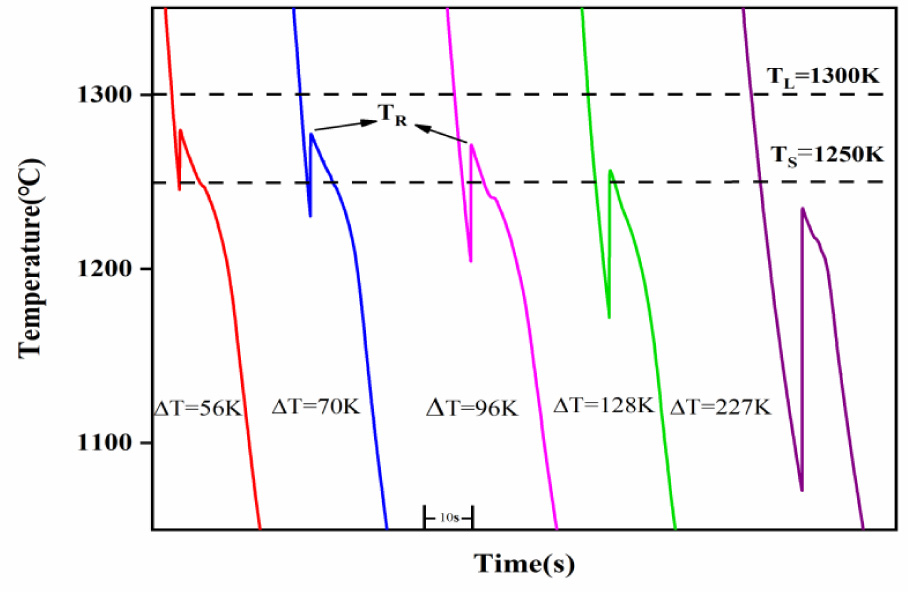
Fig. 3
Solidification recalescence curve of Cu55Ni45 alloy.
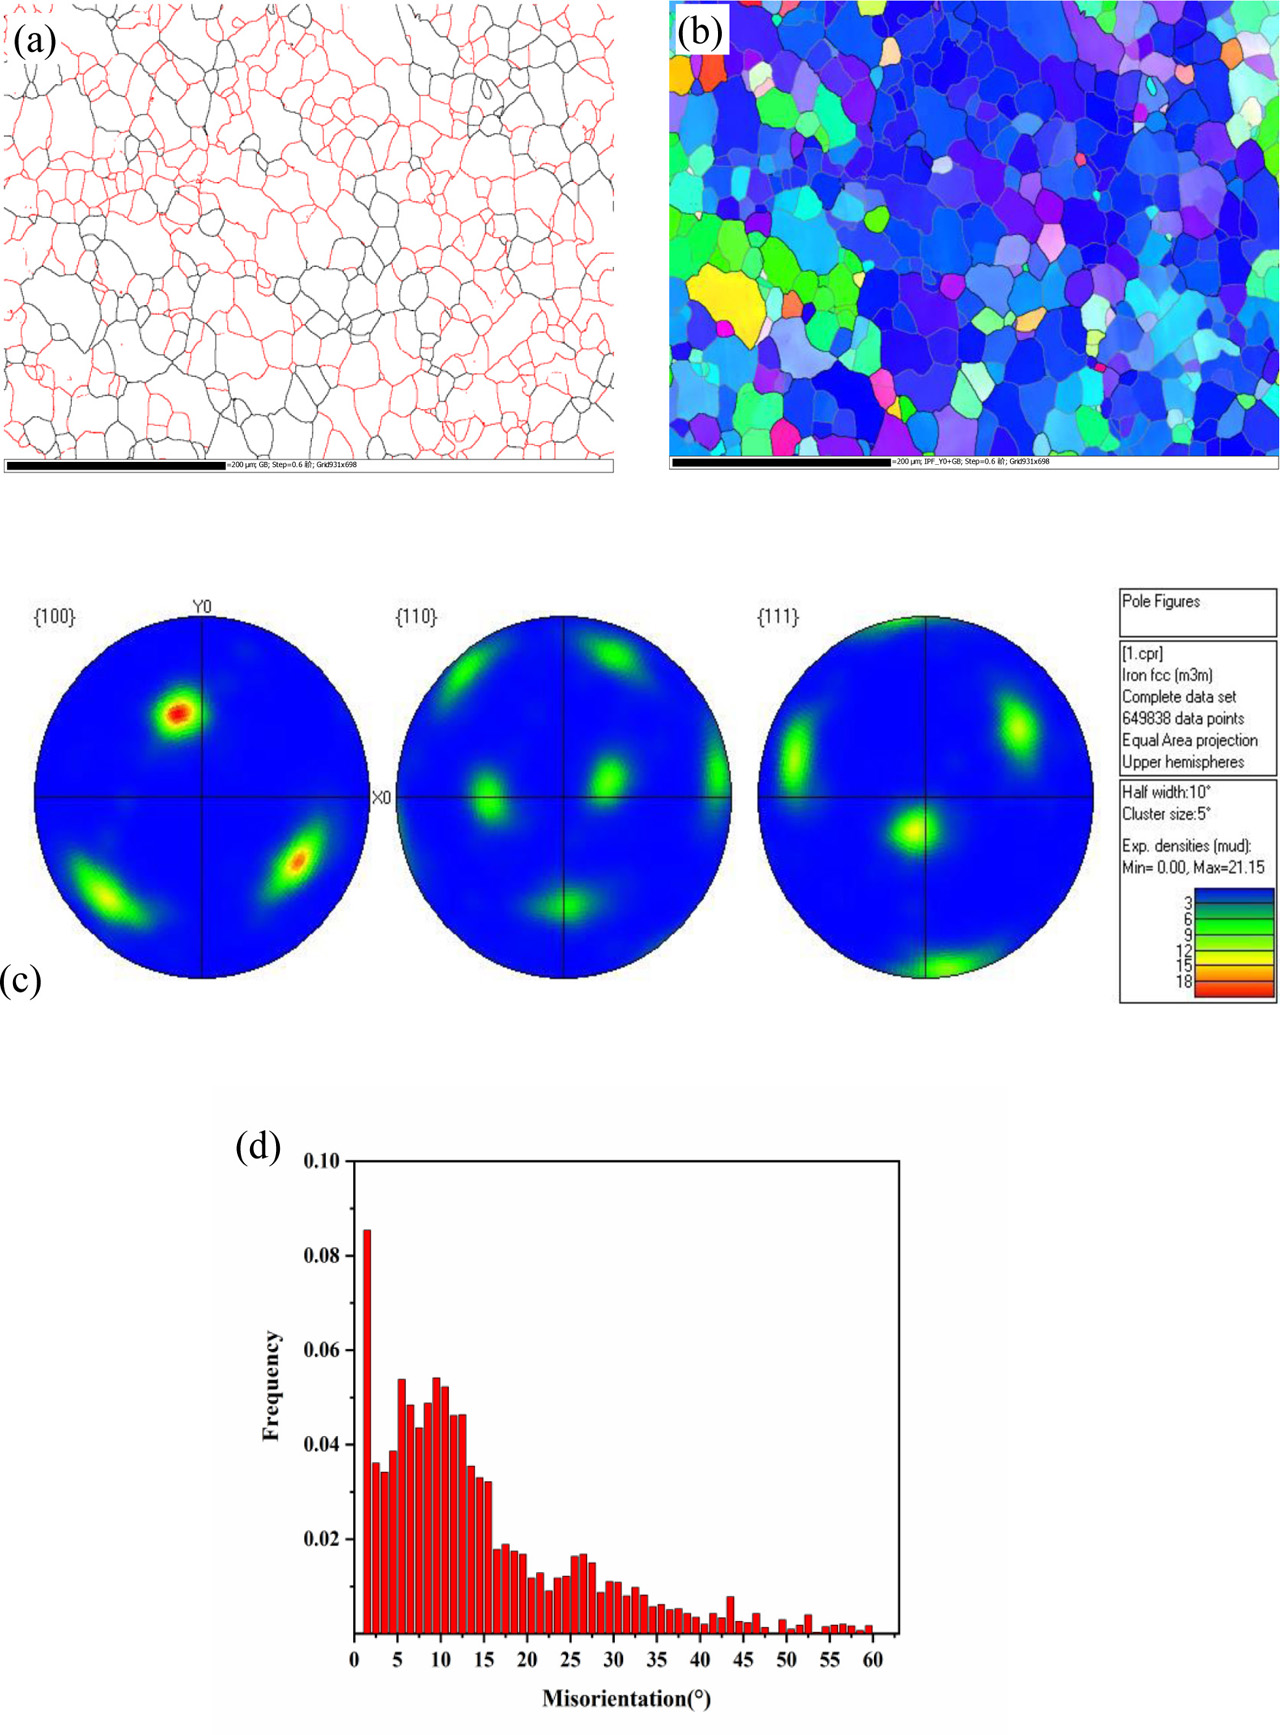
Fig. 4
EBSD characterization of Cu55Ni45 alloy with undercooling of 70 K. (A) Grain boundary diagram of microstructure of 70 K undercooling alloy, (B) grain boundary orientation diagram, (C) pole diagram of (B, D). distribution diagram of grain boundary orientation difference of (B). EBSD, electron backscatter diffraction.
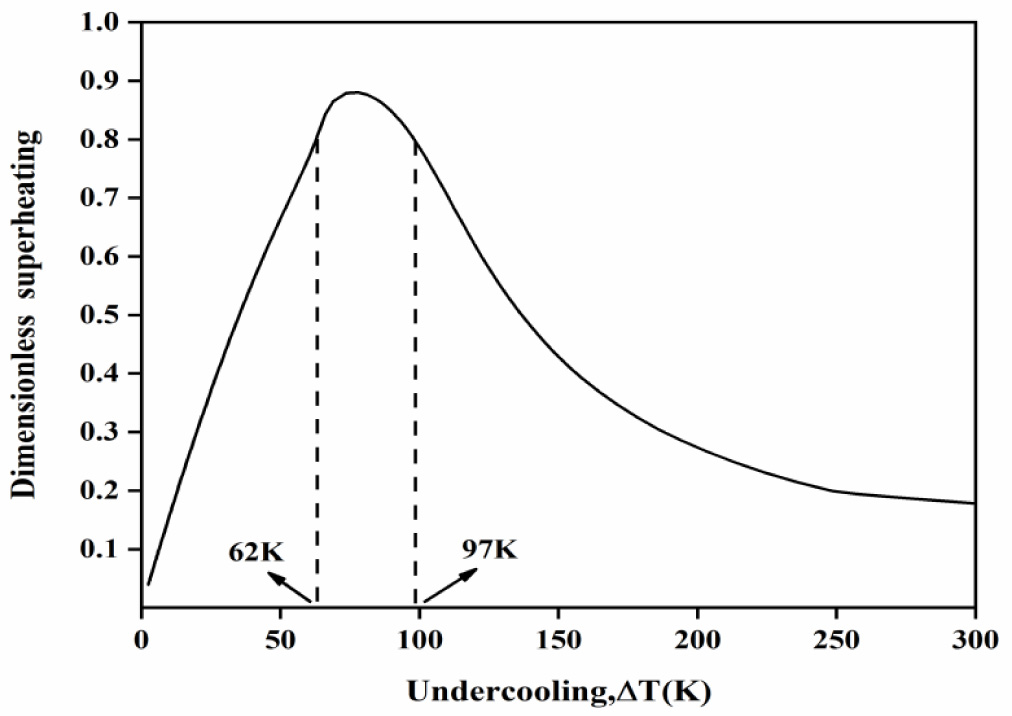
Fig. 5
The relationship between dimensionless dendrite remelting fraction and undercooling of Cu55Ni45 alloy.
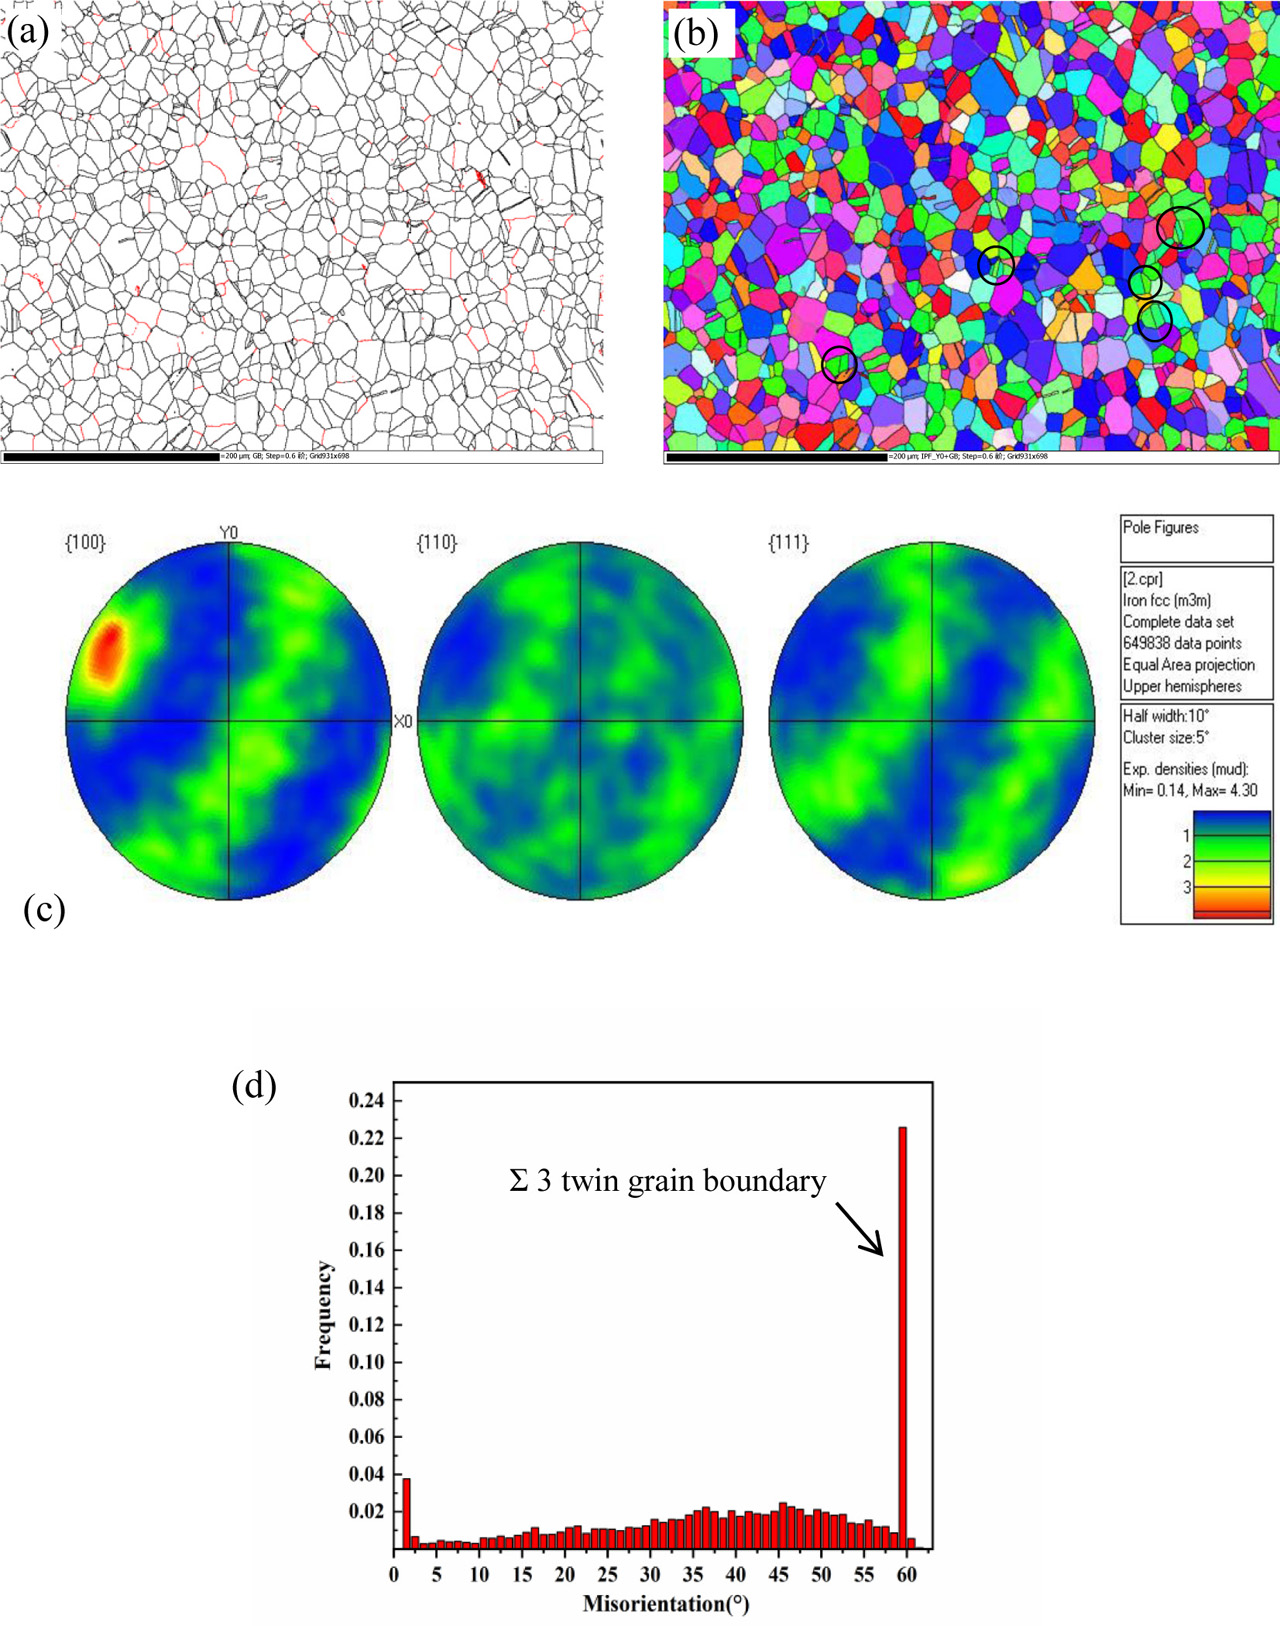
Fig. 6
EBSD characterization of Cu55Ni45 alloy with undercooling of 272 K. (A) Grain boundary diagram of microstructure of 272 K undercooling alloy, (B) grain boundary orientation diagram, (C). pole diagram of (B, D). Distribution diagram of grain boundary orientation difference of (B). EBSD, electron backscatter diffraction.
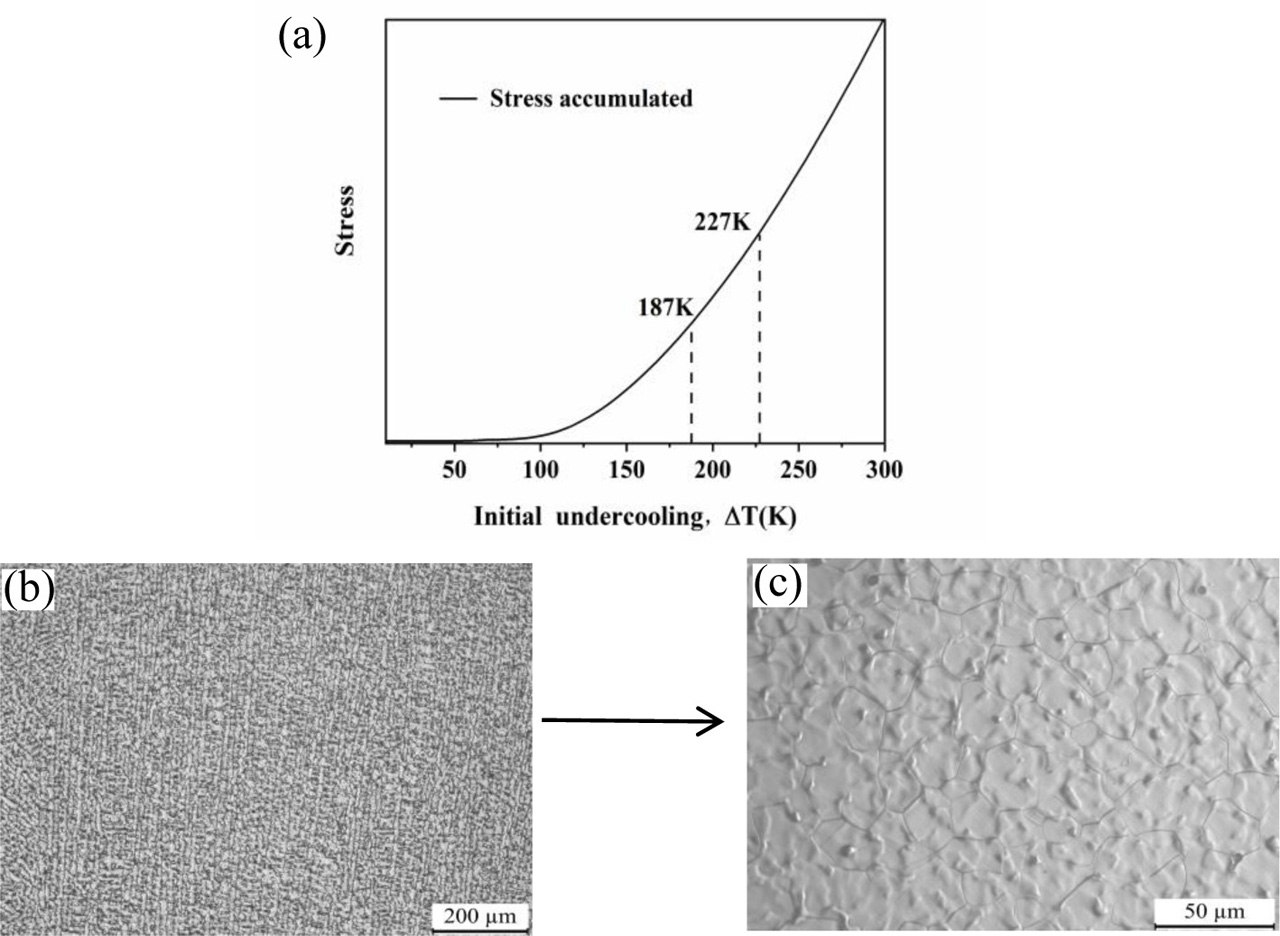
Fig. 7
(A) Relationship between stress accumulation and initial undercooling during rapid solidification of Cu55Ni45alloy, (B) Microstructure of Cu55Ni45 alloy at ΔT = 187 K, (C) microstructure of Cu55Ni45 alloy at ΔT = 227 K.
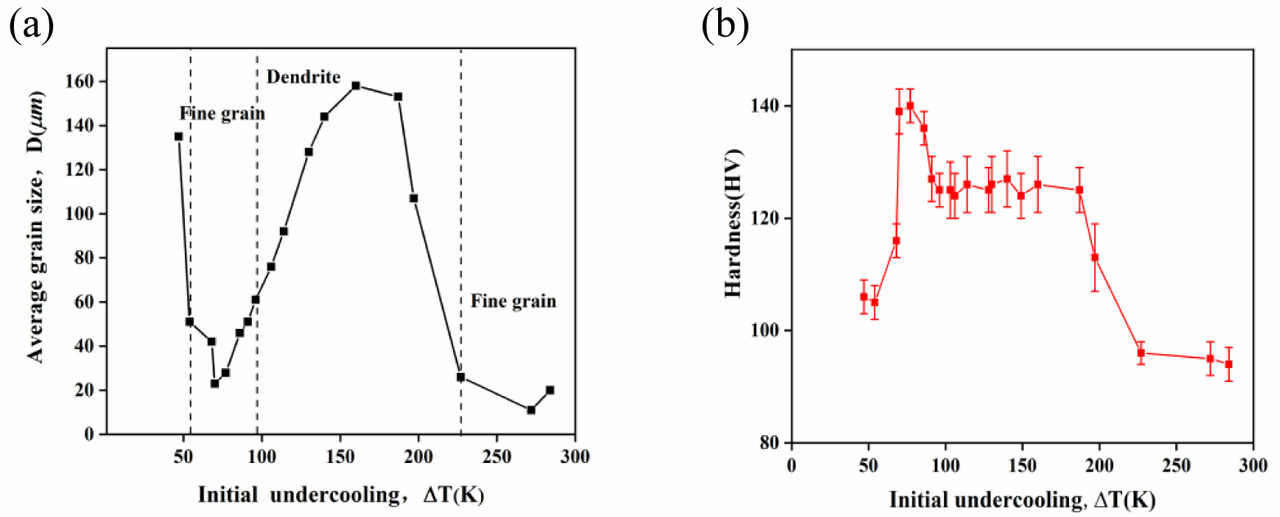
Fig. 8
(A) Evolution of average grain size and undercooling of Cu55Ni45 alloy, (B) evolution of microhardness and undercooling of Cu55Ni45 alloy.