
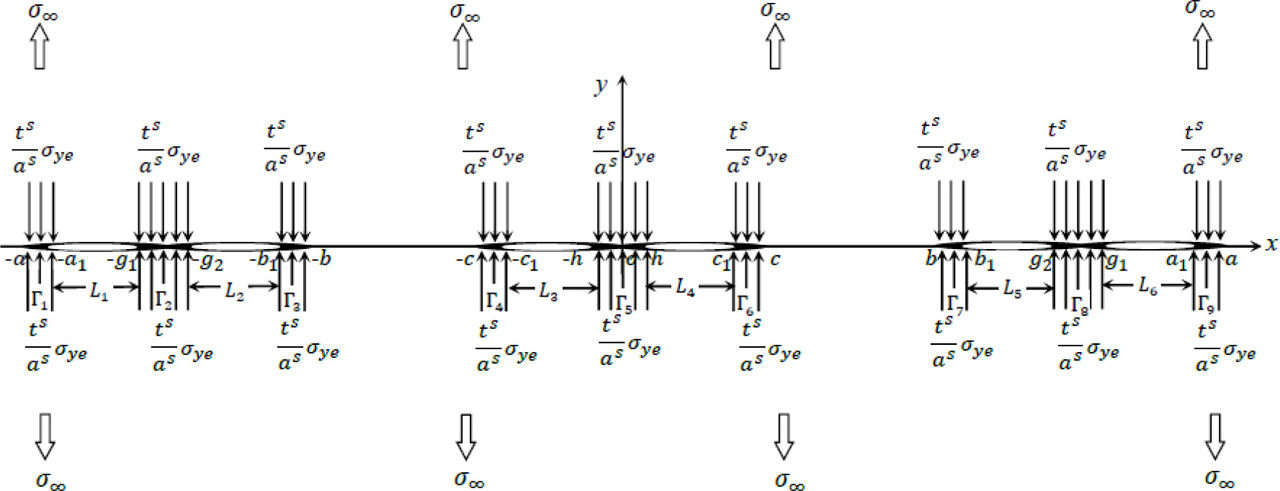
Fig. 1
Configuration of the main problem.
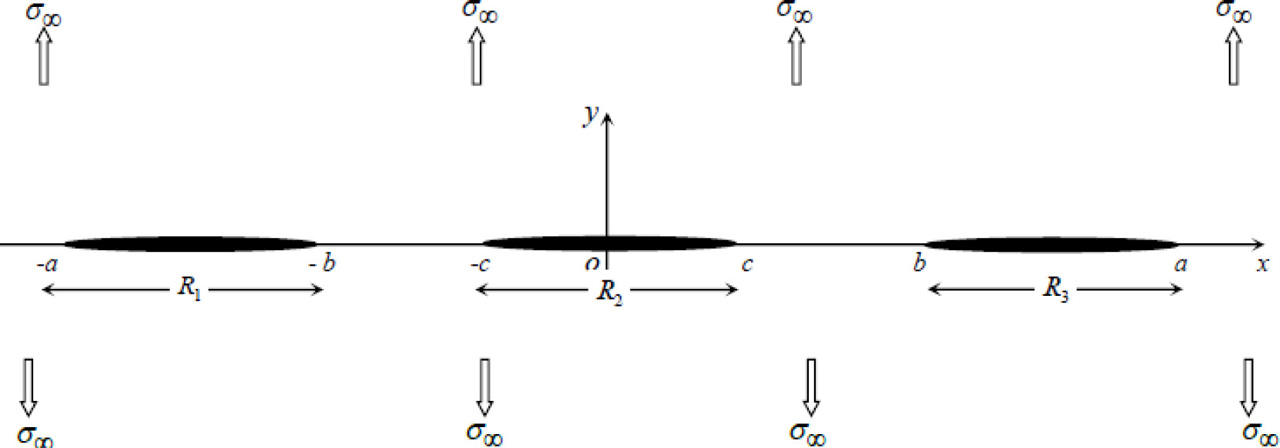
Fig. 2
Configuration of the Sub-problem A.

Fig. 3
Configuration of the Sub-problem B (when s = 0).
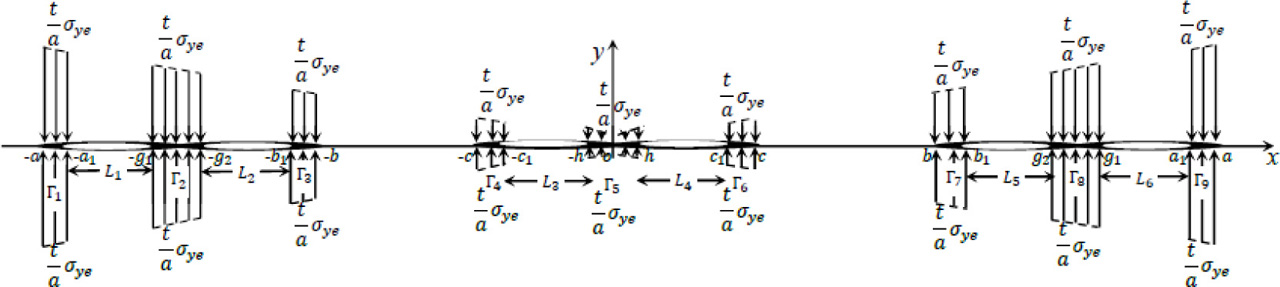
Fig. 4
Configuration of the Sub-problem B (when s = 1).
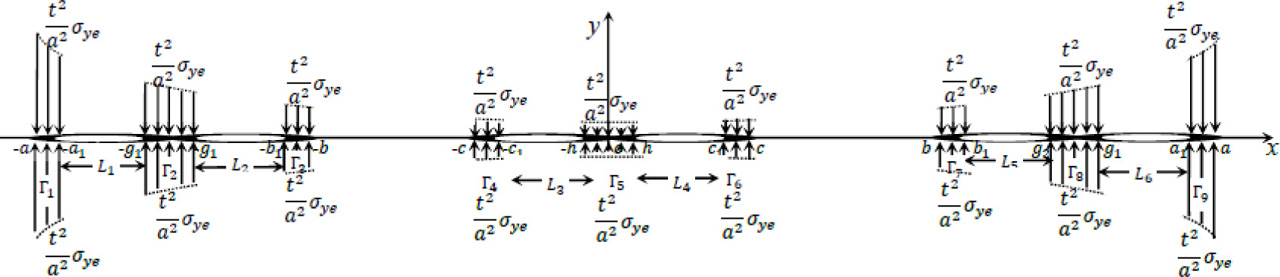
Fig. 5
Configuration of the Sub-problem B (when s = 2).
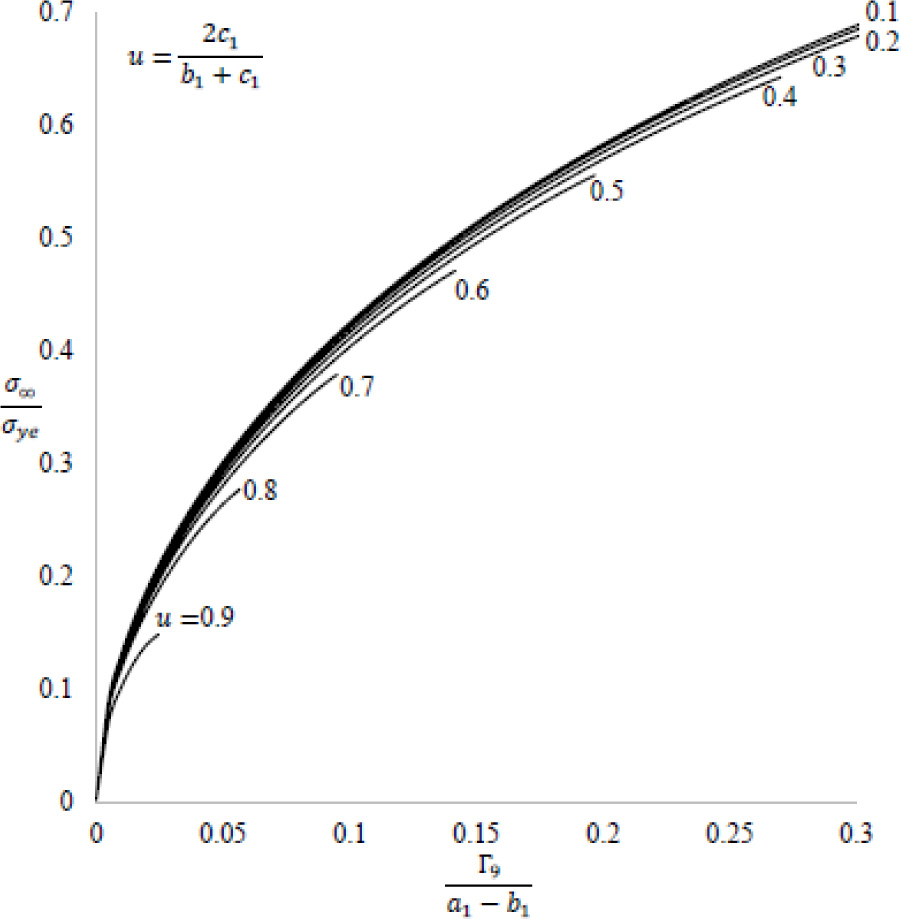
Fig. 6
Variation between normalized yield zone and load ratio for yield stress ±a1.
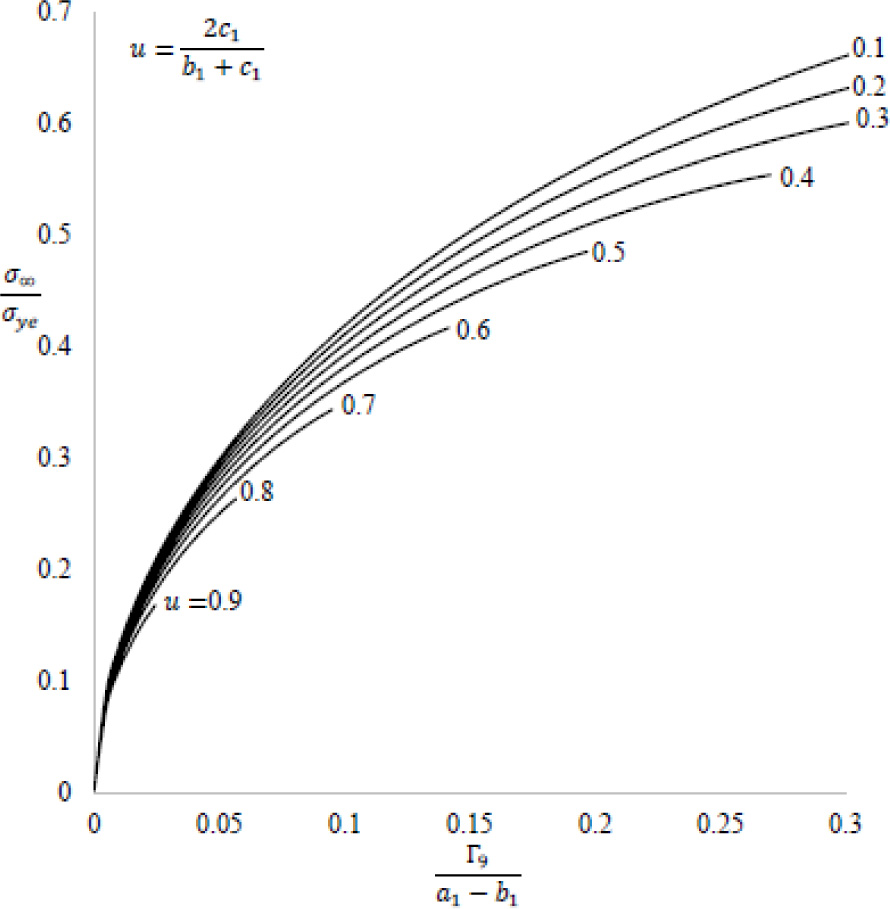
Fig. 7
Variation between normalized yield zone and load ratio for linearly varying yield stress ±a1.
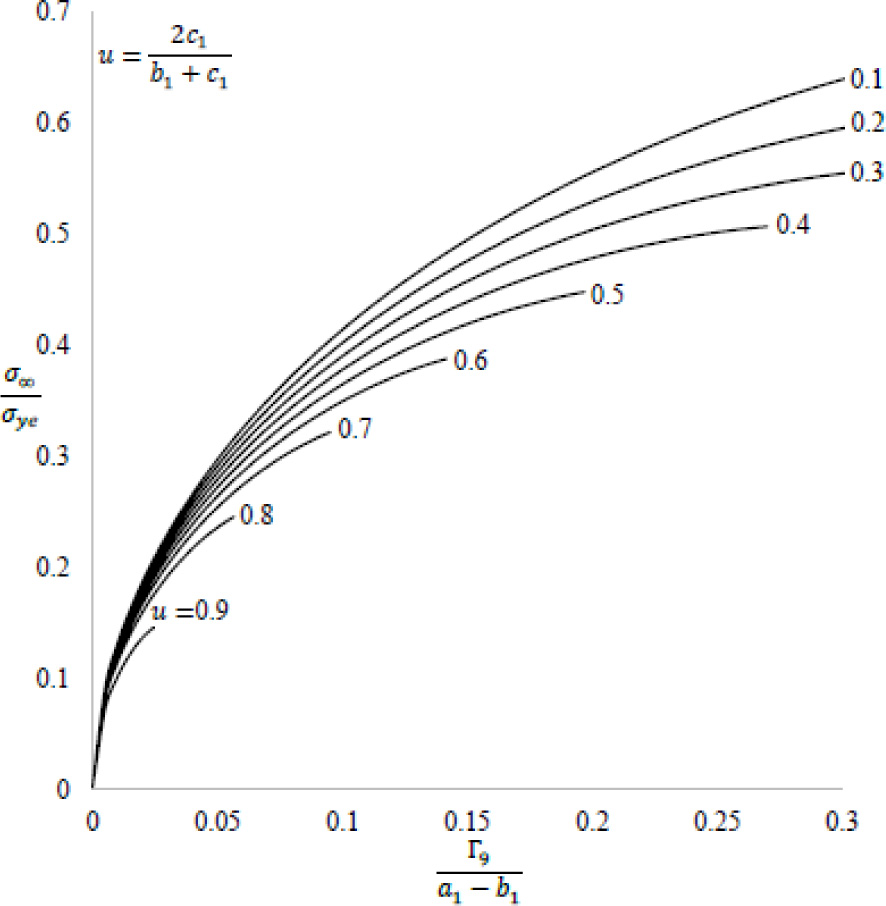
Fig. 8
Variation between normalized yield zone and load ratio for quadratically varying yield stress ±a1.
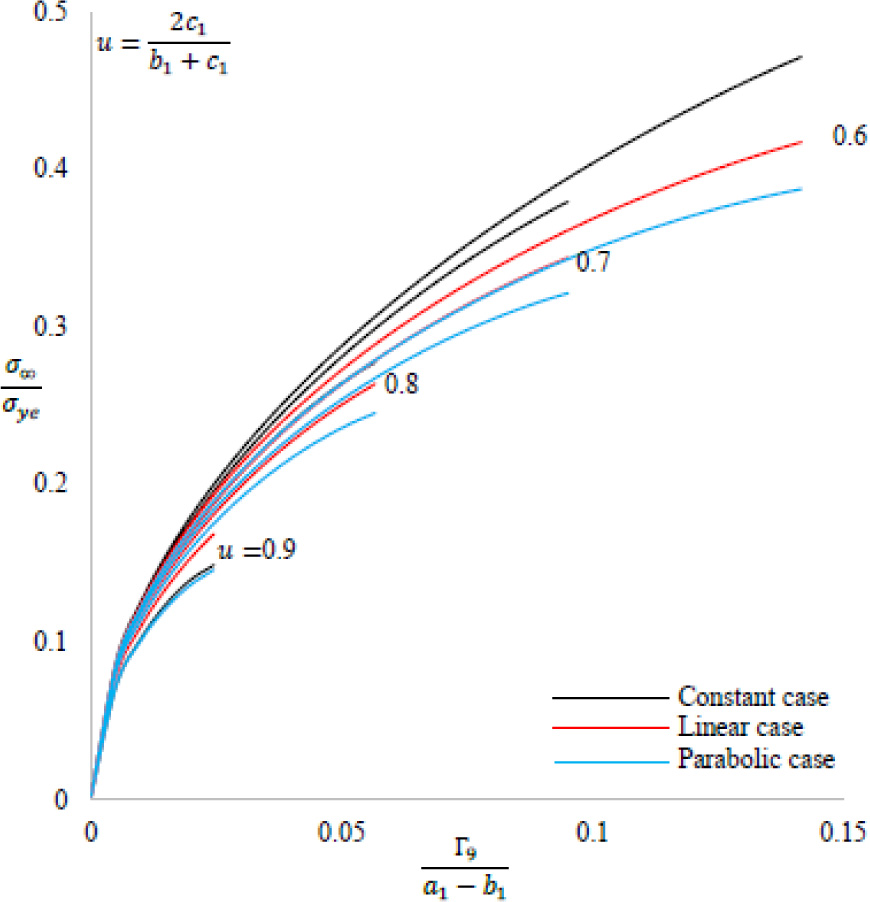
Fig. 9
Comparison between three stress profiles ±a1.
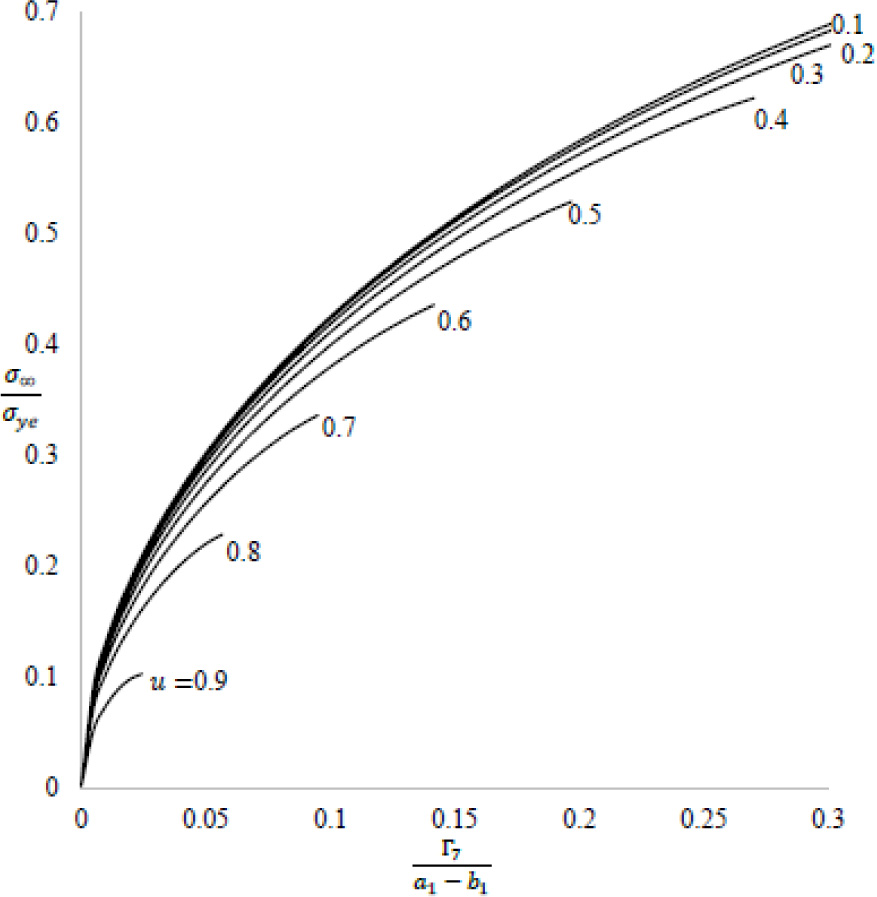
Fig. 10
Variation between normalized yield zone and load ratio for yield stress at ±b1.
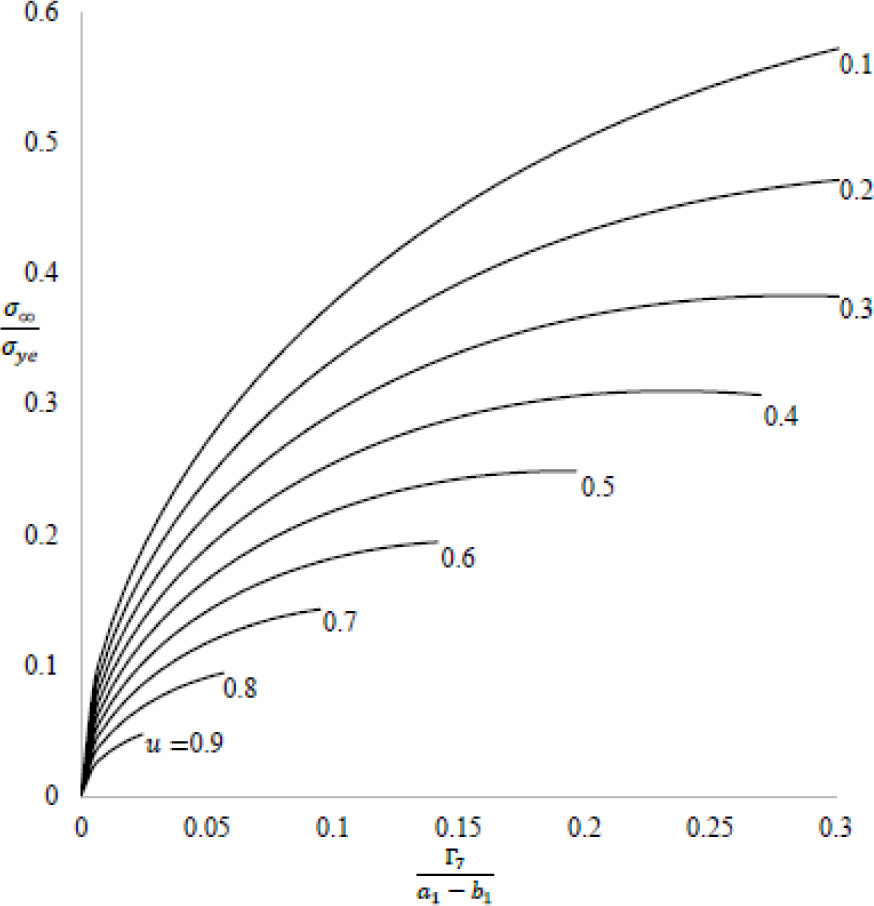
Fig. 11
Variation between normalized yield zone and load ratio for linearly varying yield stress at ±b1.
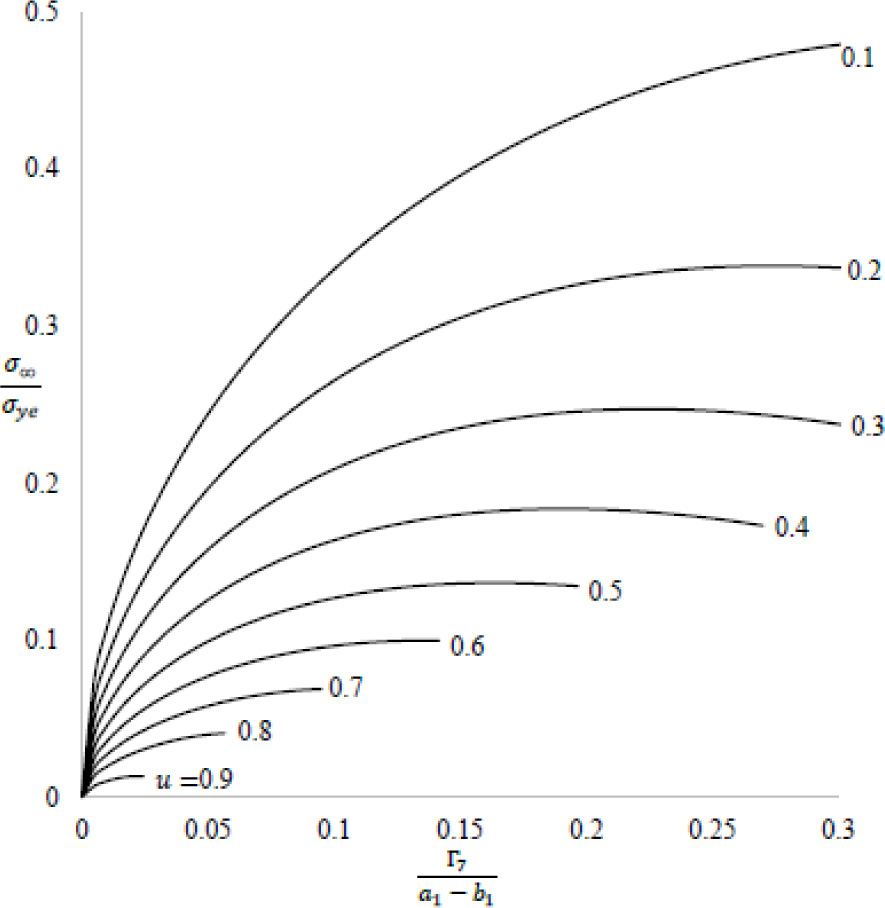
Fig. 12
Variation between normalized yield zone and load ratio for quadratically varying yield stress at ±b1.
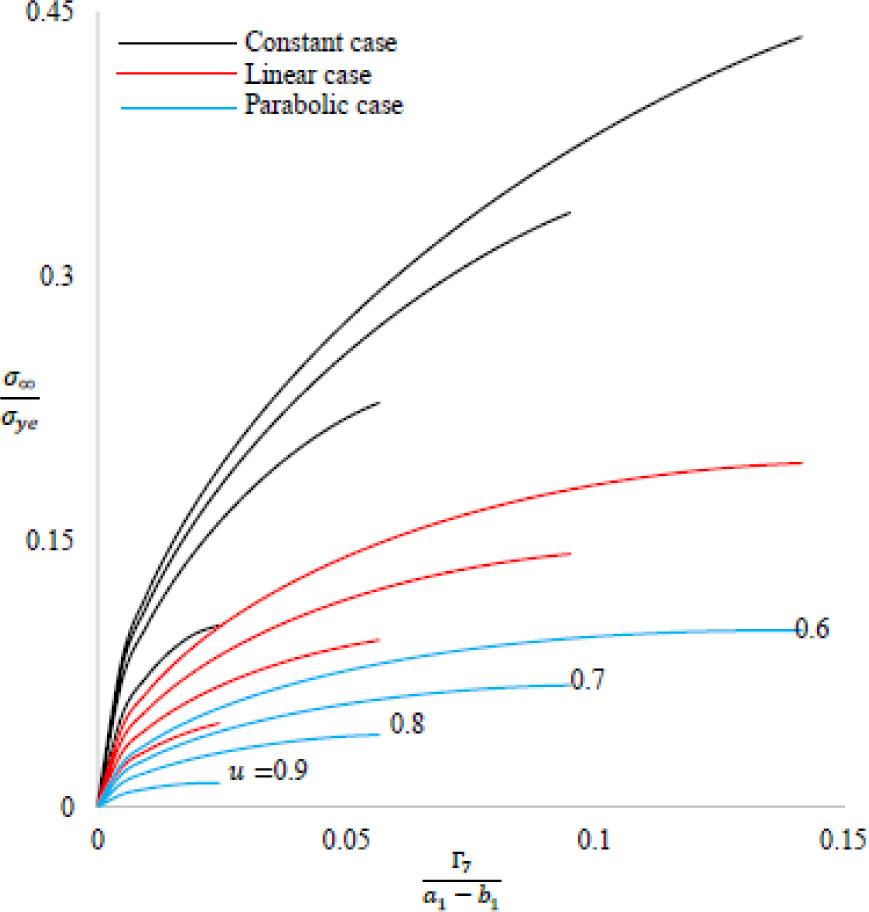
Fig. 13
Comparison between three stress profiles at ±b1.
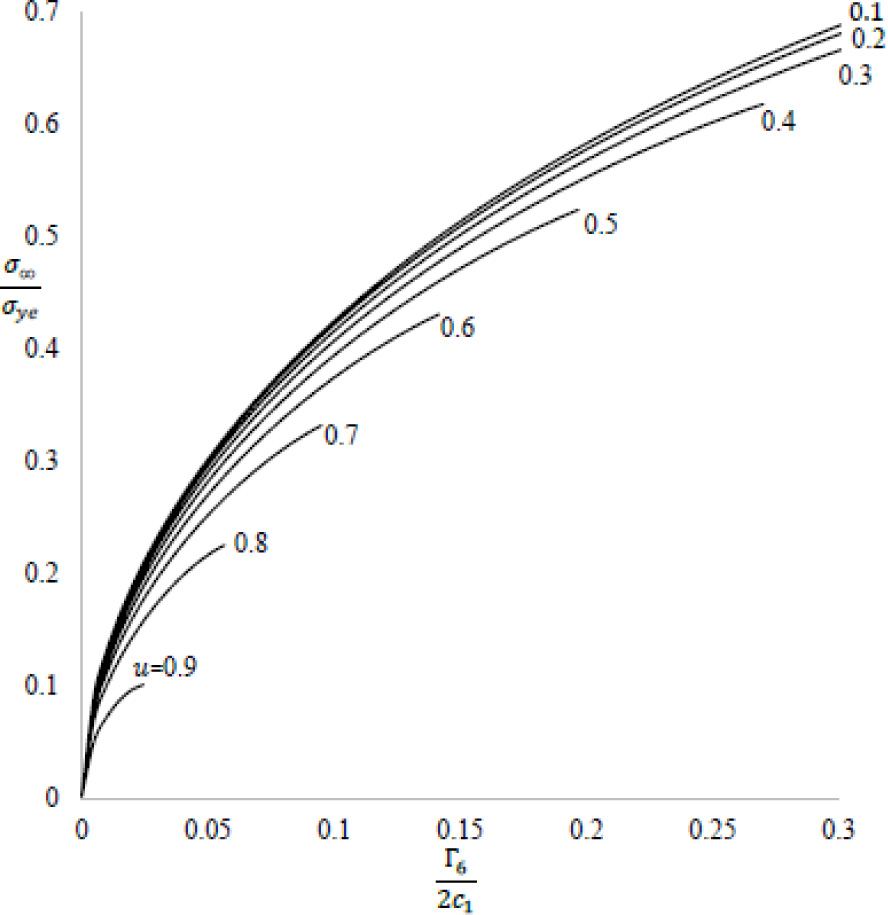
Fig. 14
Variation between normalized yield zone and load ratio for yield stress at ±c1.
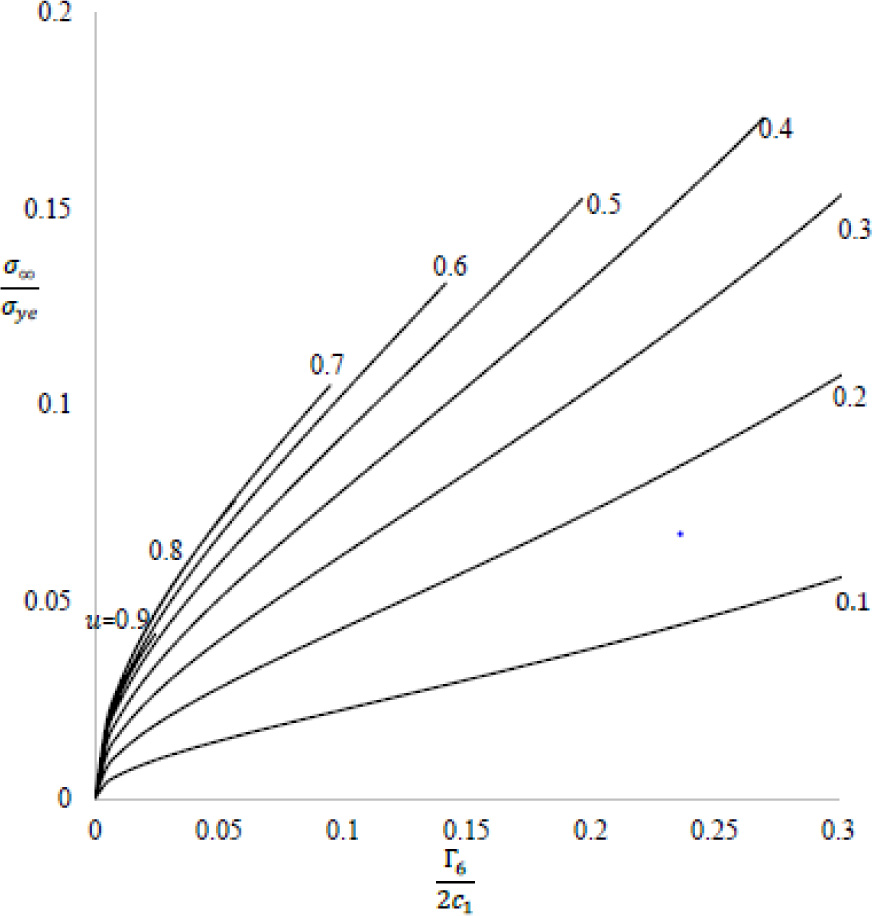
Fig. 15
Variation between normalized yield zone and load ratio for linearly varying yield stress at ±c1.
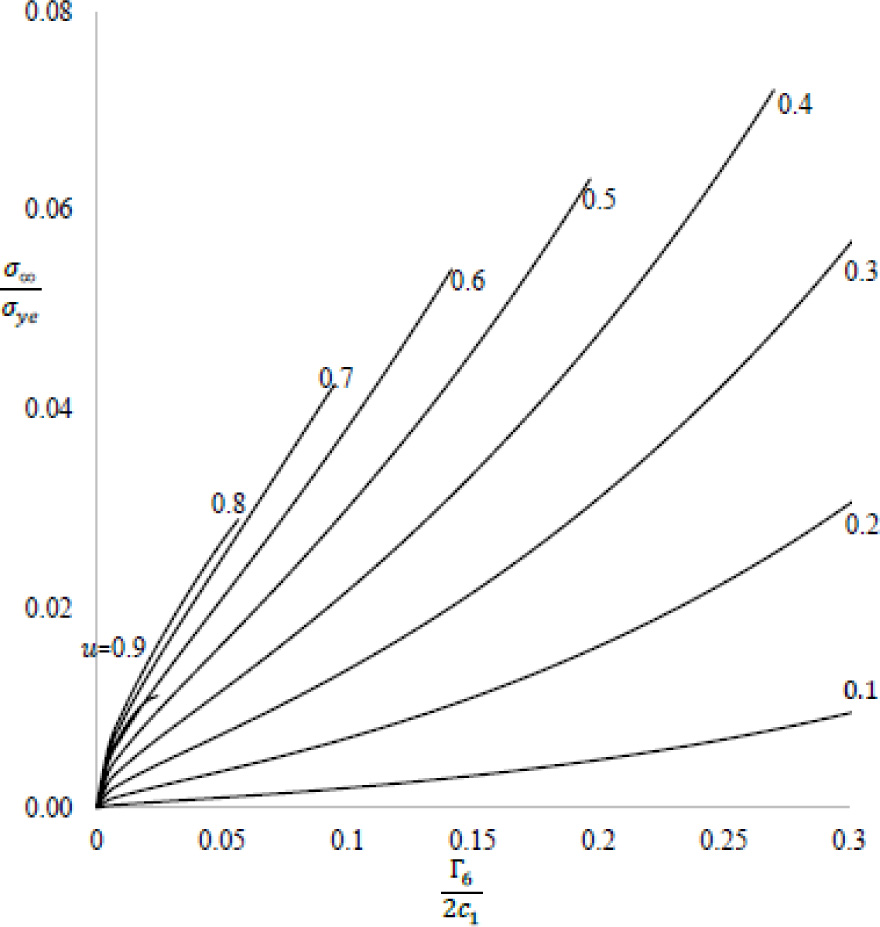
Fig. 16
Variation between normalized yield zone and load ratio for quadratically varying yield stress at ±c1.
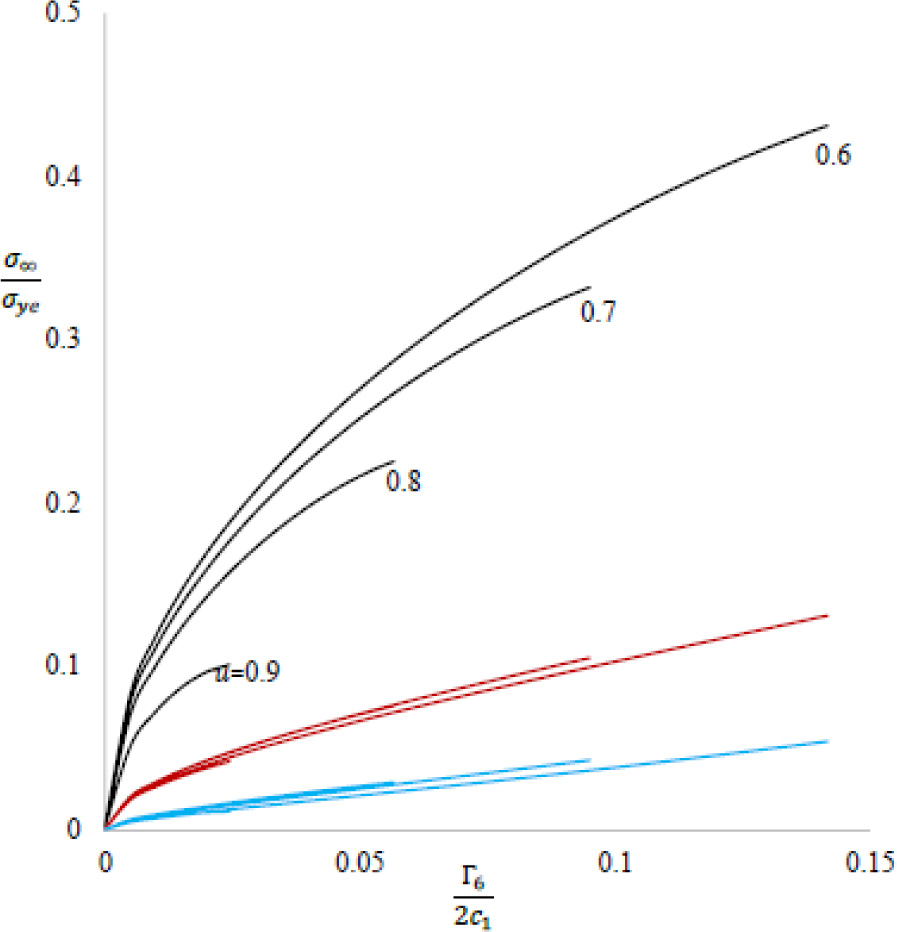
Fig. 17
Comparison between three stress profiles at ±c1.
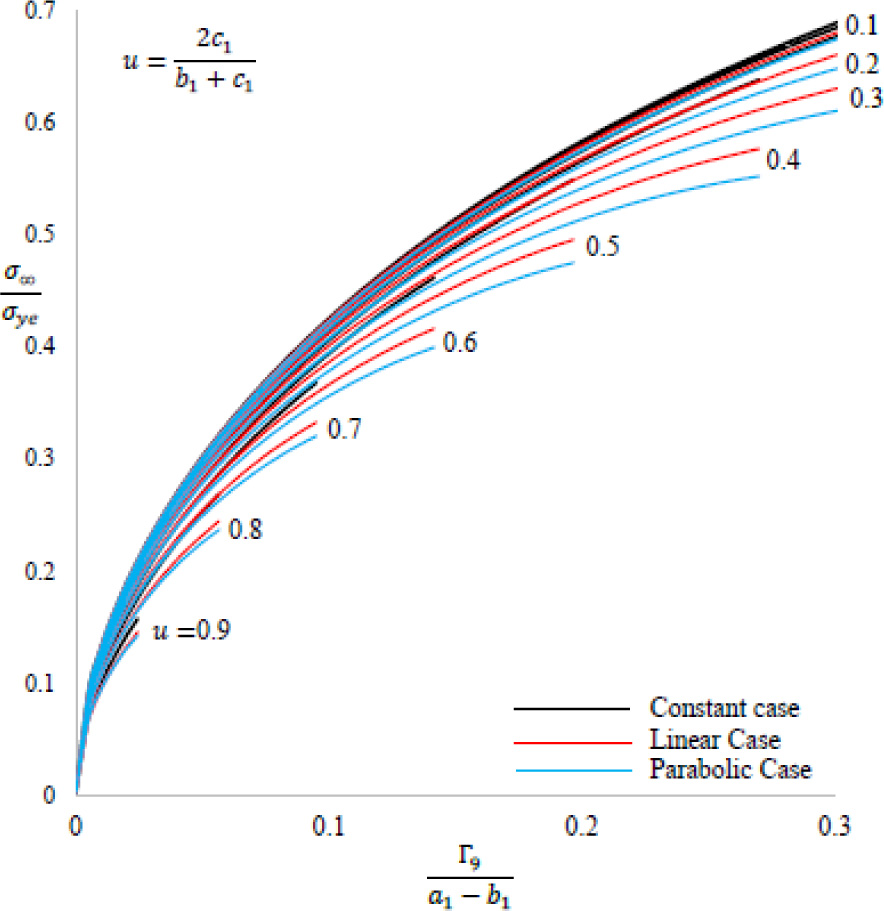
Fig. 18
Variation between and .
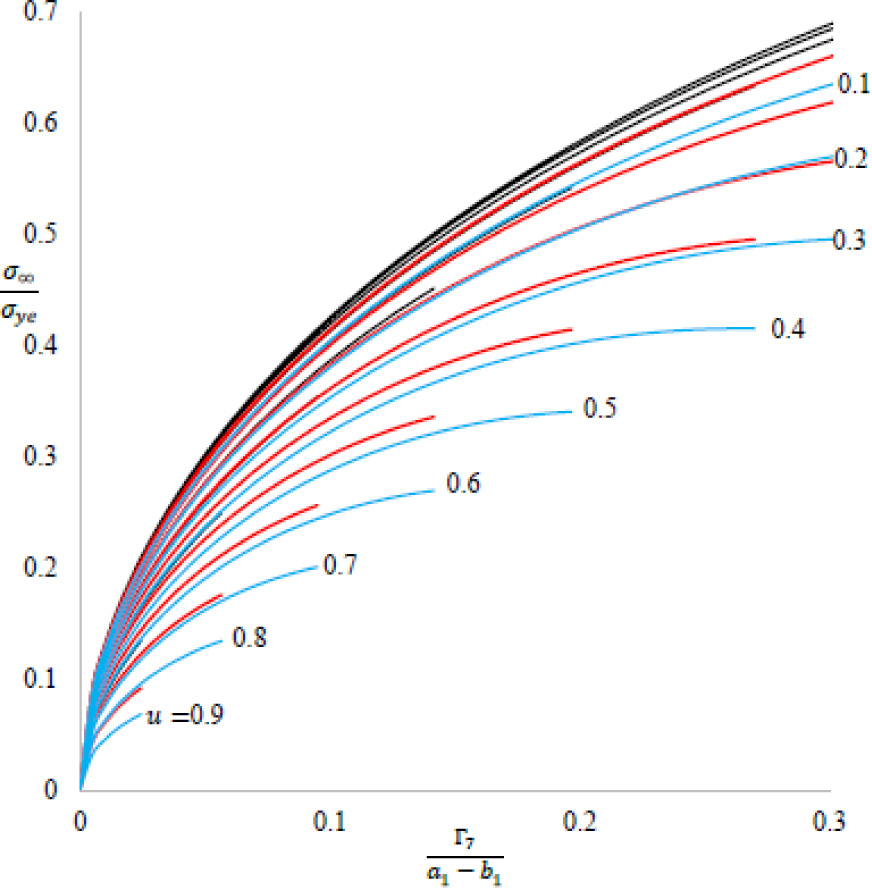
Fig. 19
Variation between and .
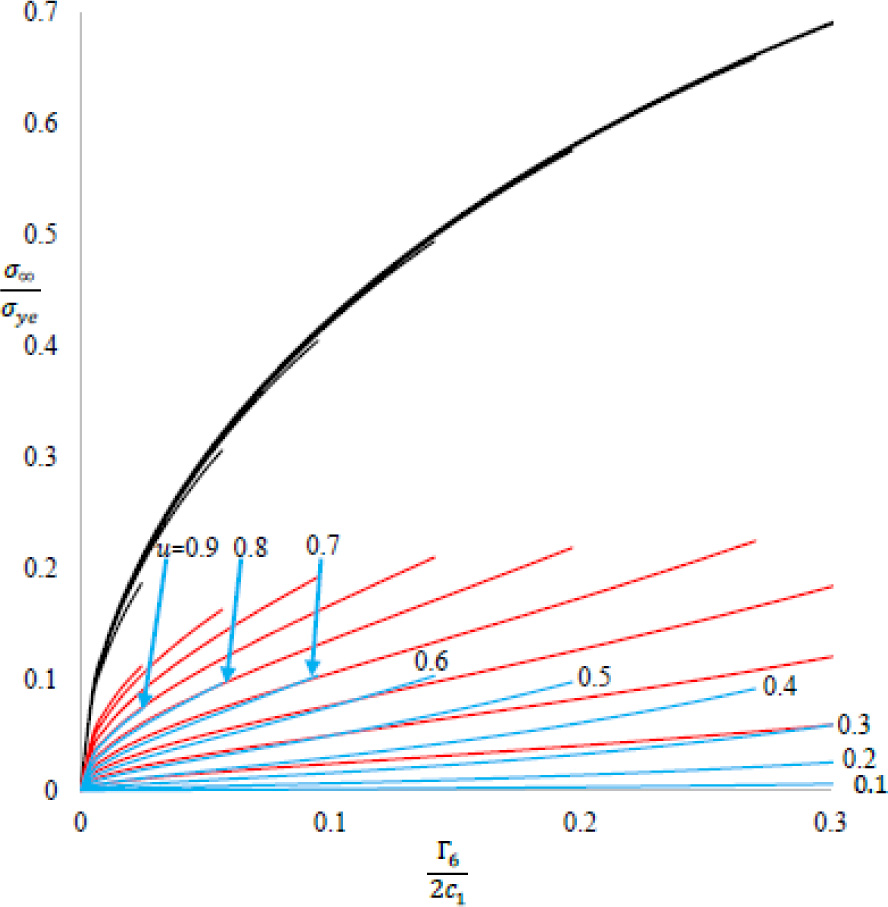
Fig. 20
Variation between and .
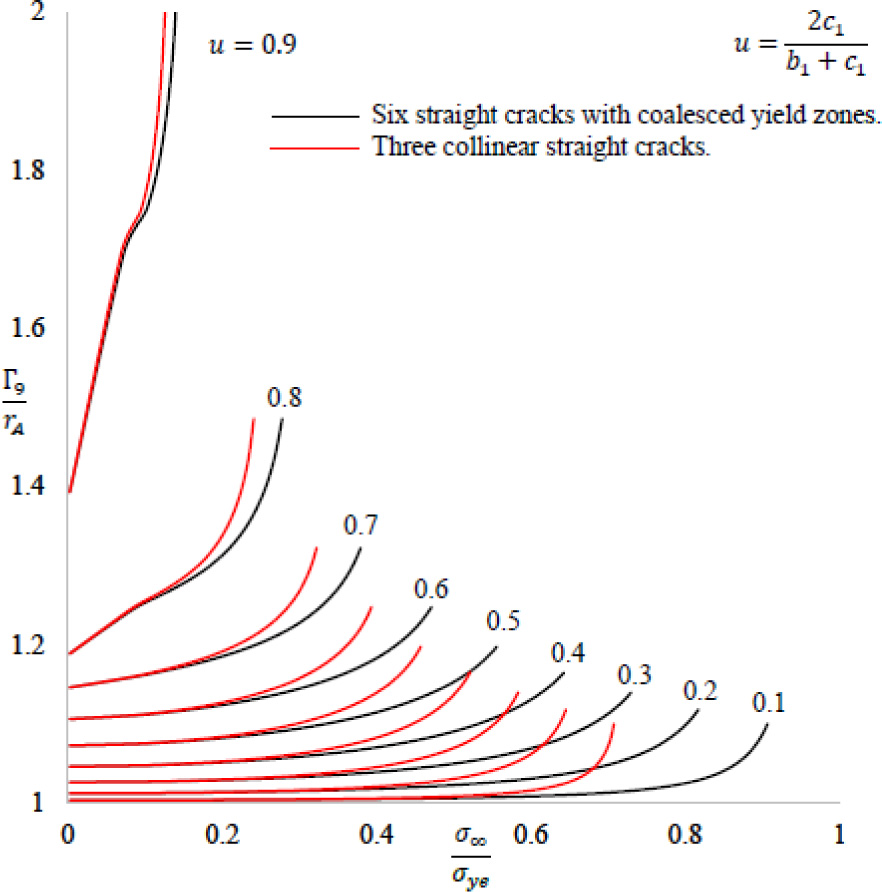
Fig. 21
Variation between and .
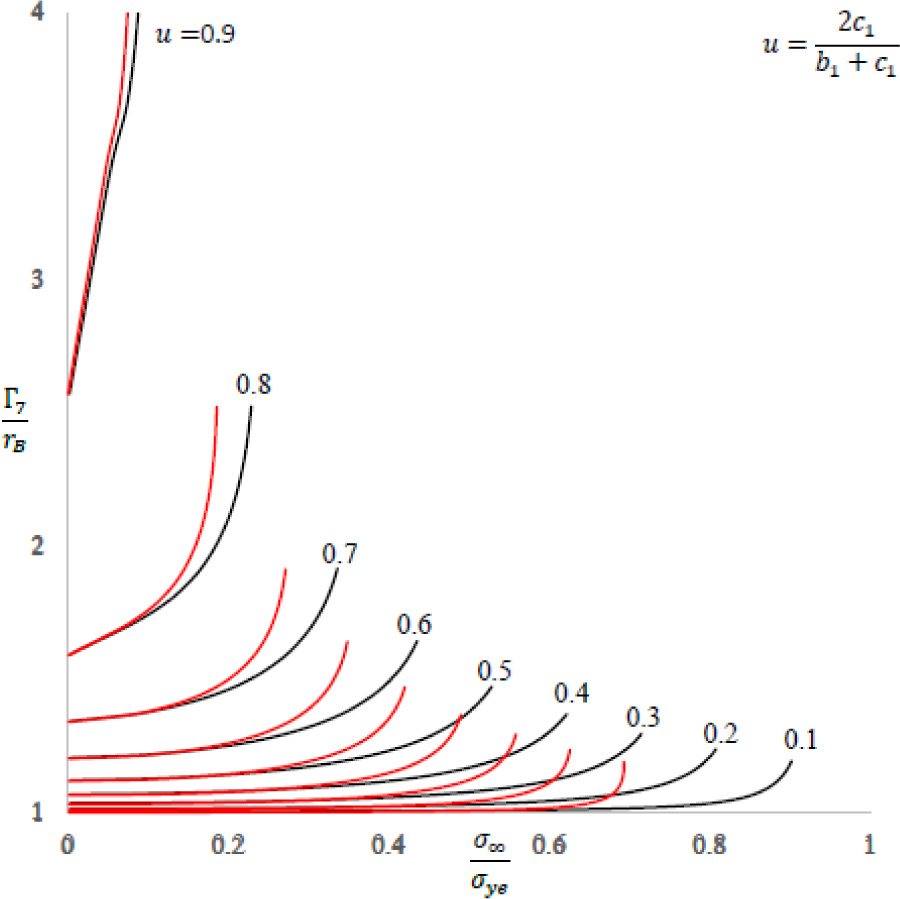
Fig. 22
Variation between and .
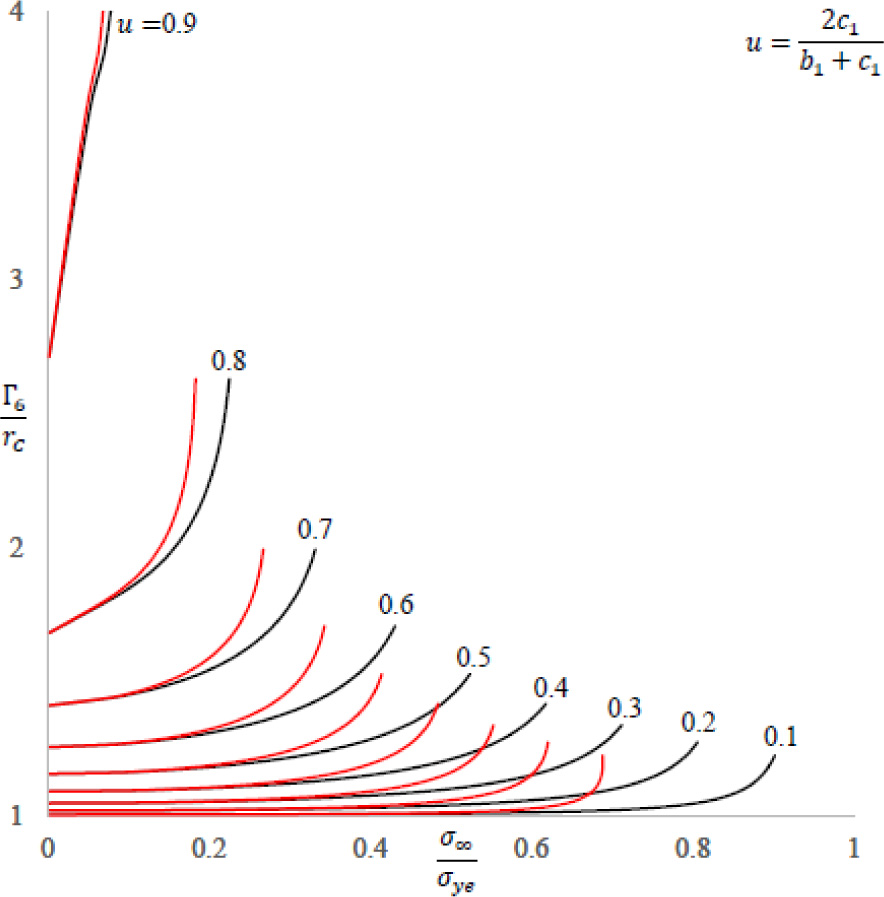
Fig. 23
Variation between and .