
Fig. 1
Fig. 2
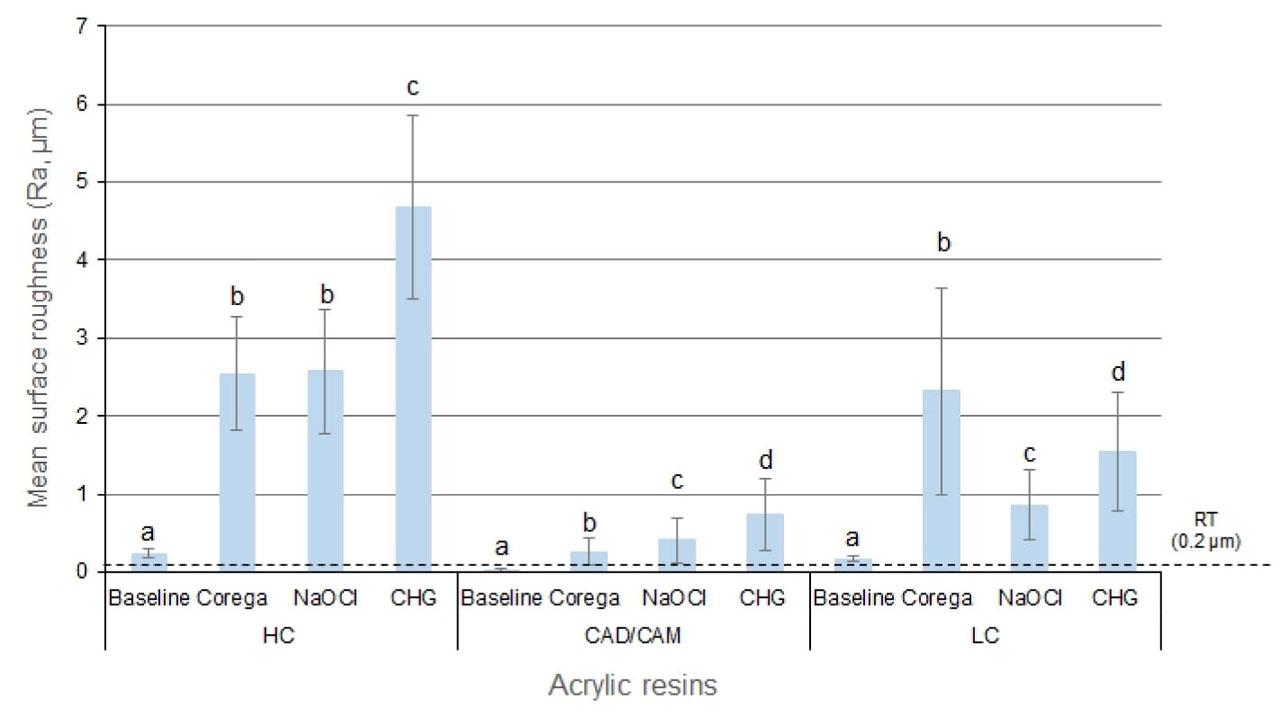
Fig. 3
Pairwise comparison of the final surface roughness for the acrylic resins and disinfectants tested_
| Group (I) | Comparison group (J) | Mean difference (I–J) | p-value |
|---|---|---|---|
| Acrylic resins | |||
| HC | CAD/CAM | 2.61 | 0.000* |
| LC | 1.61 | 0.000* | |
| CAD/CAM | HC | −2.61 | 0.000* |
| LC | −0.99 | 0.001* | |
| LC | HC | −1.61 | 0.000* |
| CAD/CAM | 0.99 | 0.001* | |
| Disinfectants | |||
| Corega | NaOCl | 0.41 | 0.328 |
| CHG | −0.60 | 0.066 | |
| NaOCl | Corega | −0.41 | 0.328 |
| CHG | −1.01 | 0.000* | |
| CHG | Corega | 0.60 | 0.066 |
| NaOCl | 1.01 | 0.000* | |
Two-way repeated-measures ANOVA results for the interactions between resin type and disinfectants on the roughness values_
| Source | Type III SS* | DF | MS | F-value | p-value |
|---|---|---|---|---|---|
| Corrected model | 145.99 | 8 | 18.24 | 18.45 | 0.000* |
| Intercept | 235.61 | 1 | 235.61 | 238.28 | 0.000* |
| Resin | 104.22 | 2 | 52.11 | 52.70 | 0.000* |
| Disinfectants | 15.63 | 2 | 7.81 | 7.90 | 0.001* |
| Resins×Disinfectants | 26.13 | 4 | 6.53 | 6.60 | 0.000* |
| Error | 80.09 | 81 | 0.98 | ||
| Total | 461.70 | 90 |
Mean surface roughness (Ra, μm) of the acrylic resins at baseline_
| Acrylic resins | N | Mean ± SD | p-value |
|---|---|---|---|
| HC | 30 | 0.24 ± 0.06 | <0.001* |
| CAD/CAM | 30 | 0.03 ± 0.02 | |
| LC | 30 | 0.17 ± 0.03 |