
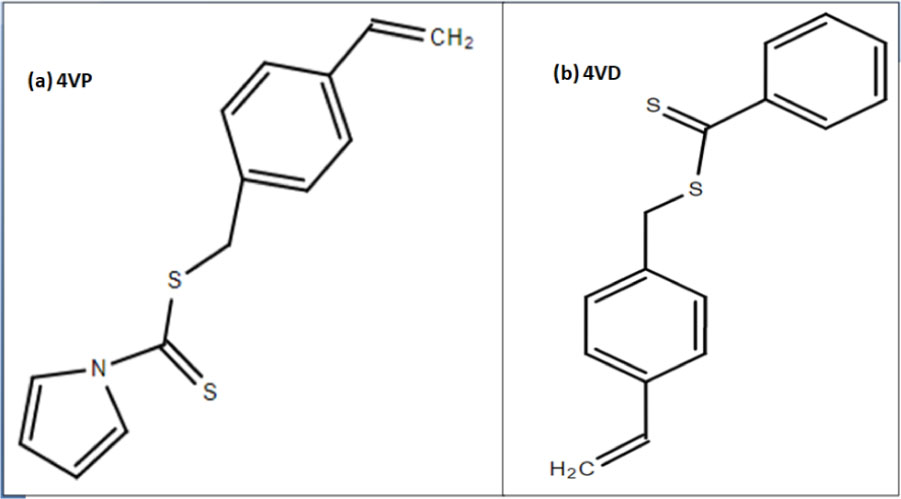
Fig. 1
Structures of the as-prepared RAFT agents. RAFT, reversible addition-fragmentation chain-transfer.
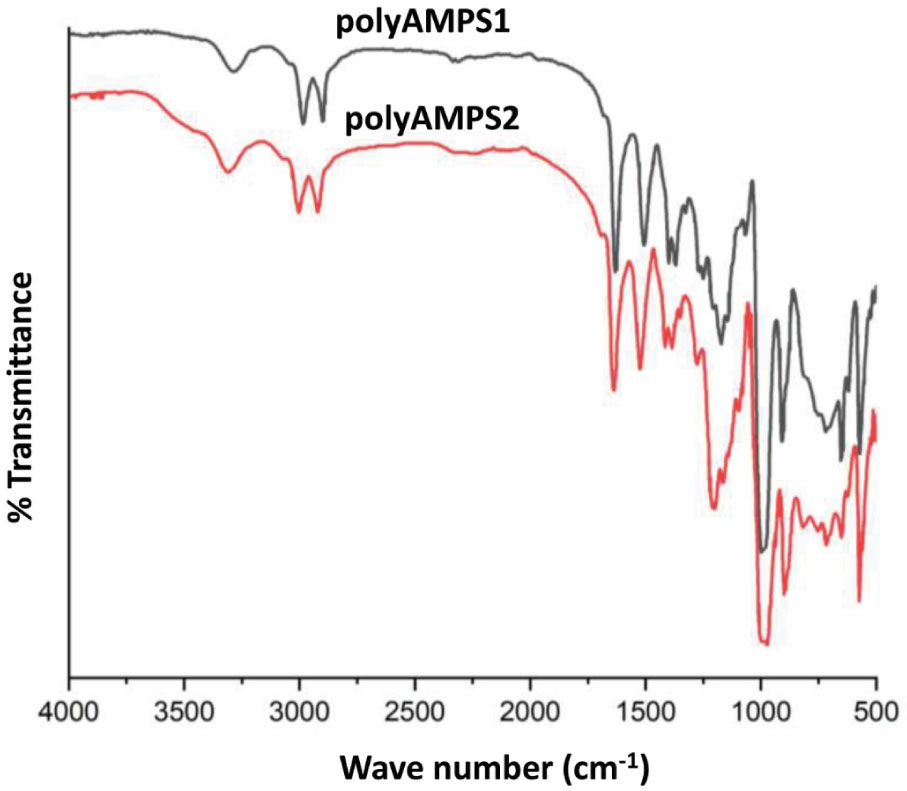
Fig. 2
FTIR spectra of the as-prepared polyAMPSi and polyAMPSii. polyAMPS, poly(2-acrylamido-2-methylpropane sulfonic acid).
Table 1
Identifying characteristic peaks of CSi and CSii particles.
| S. No. | Wave number (cm−1) | Functional group | Belonging molecule | References |
|---|---|---|---|---|
| 1. | 1,633 | C=O | ||
| 2. | 1,583 | N–H (bending) | ||
| 3. | 1,364 | C–N | polyAMPS | [25] |
| 4. | 1,190 and 1,039 | O=S=O (asymmetric and symmetric stretching) | ||
| 5. | 603 | C–S stretching | ||
| 6. | 3,333 | Vibration of bonded and non-bonded OH groups | H2O | Disperse medium |
| 7. | 2,957 | Stretching CH | ||
| 8. | 1,726 | C=O stretching | BMA | [27] |
| 9. | 1,240 | C–O–C stretching |
[i] BMA, butyl methacrylate; polyAMPS, poly(2-acrylamido-2-methylpropane sulfonic acid).
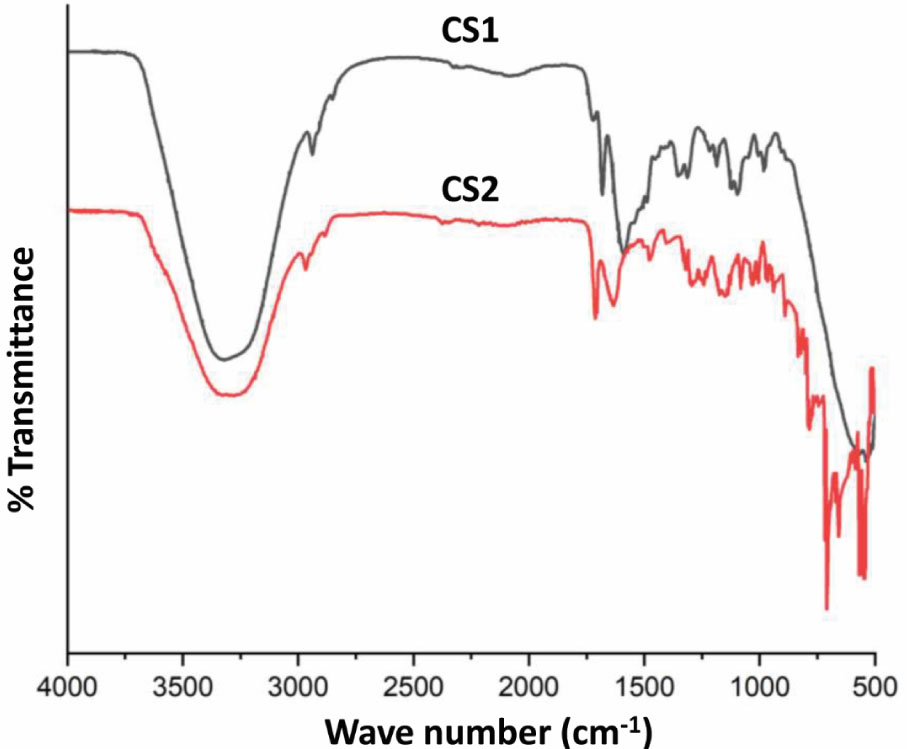
Fig. 3
FTIR spectra of the CS particles.
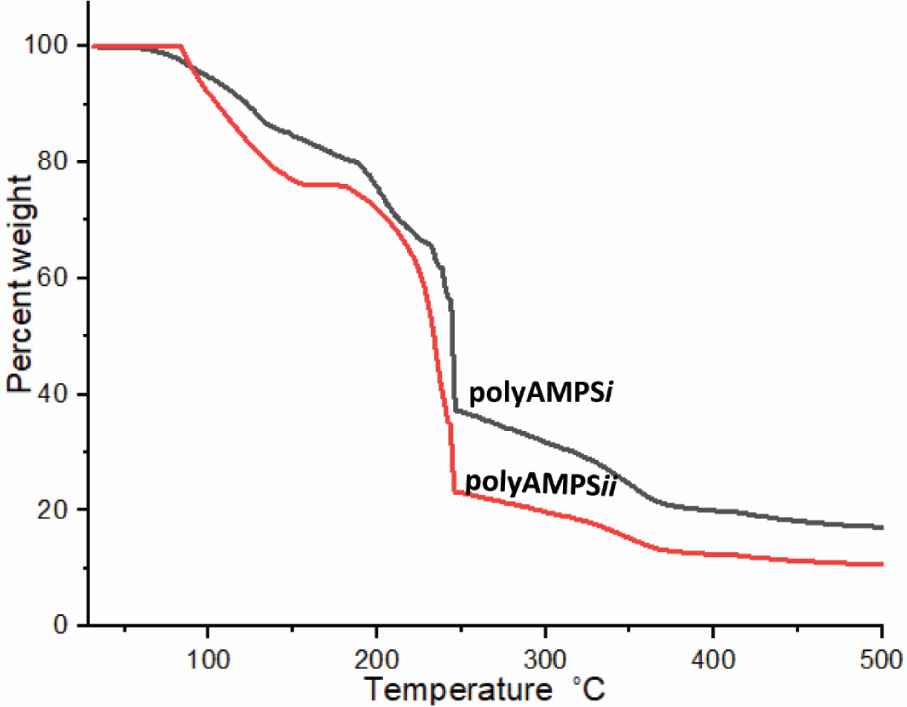
Fig. 4
Comparing TGA results of polyAMPS. polyAMPS, poly(2-acrylamido-2-methylpropane sulfonic acid).
Table 2
Comparative analysis of thermal degradation with respect to temperature.
| Polymer | Temperature (°C) with weight reduction | ||
|---|---|---|---|
| 20% | 50% | 70% | |
| polyAMPSi | 177 | 242 | 308 |
| polyAMPSii | 131 | 232 | 243 |
[i] polyAMPS, poly(2-acrylamido-2-methylpropane sulfonic acid).
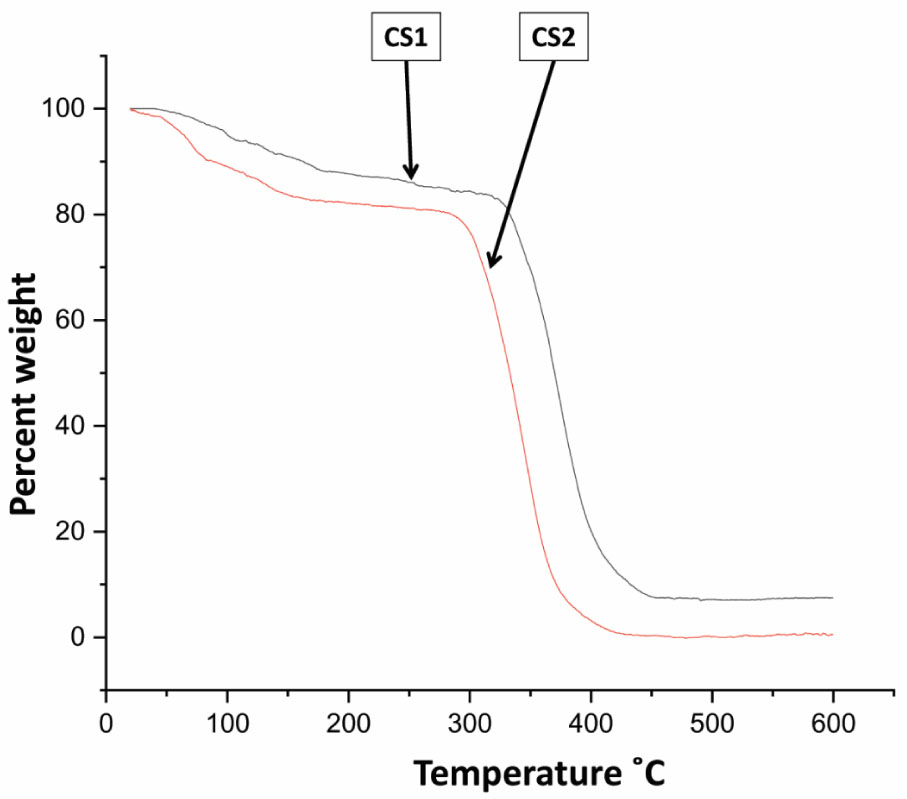
Fig. 5
Comparative TGA results of CS particles.
Table 3
Comparative analysis of thermal degradation with respect to temperature.
| Core-shell particles | Temperature (°C) with weight reduction | |||
|---|---|---|---|---|
| 25% | 50% | 75% | 92% | |
| CSi | 340 | 368 | 392 | 446 |
| CSii | 302 | 333 | 352 | 374 |
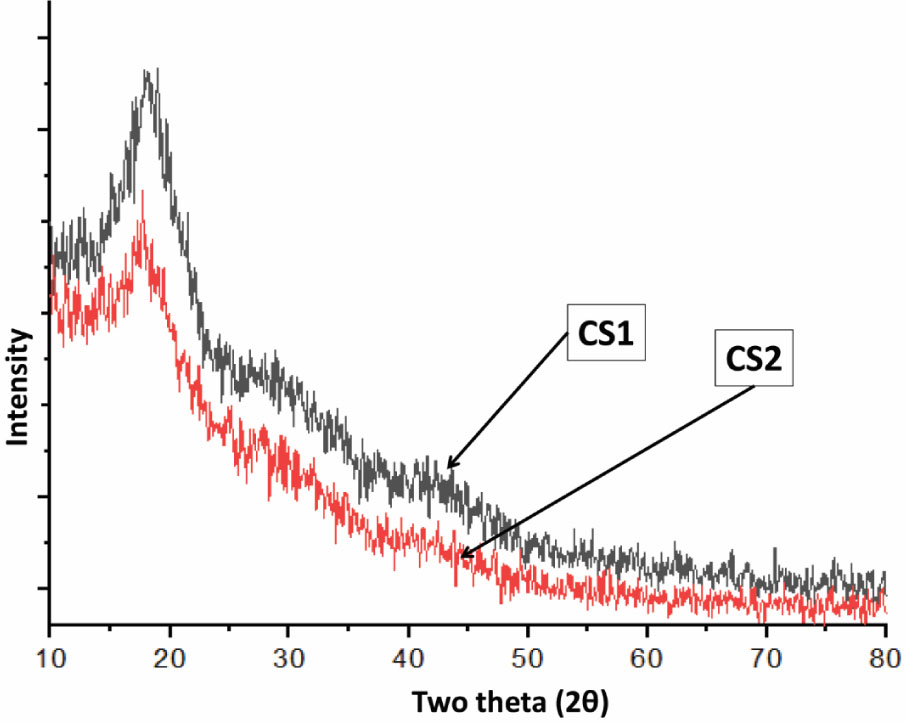
Fig. 6
Comparing XRD results of polymeric CS particles. XRD, X-ray diffraction.
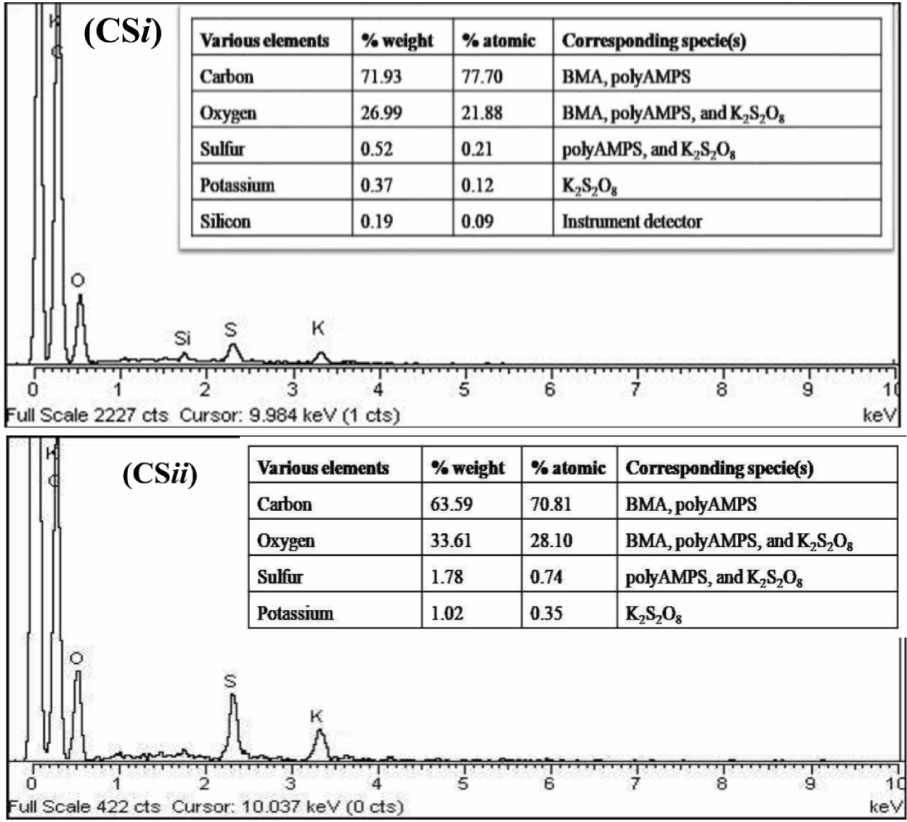
Fig. 7
EDX result of polymeric core-shell particles.
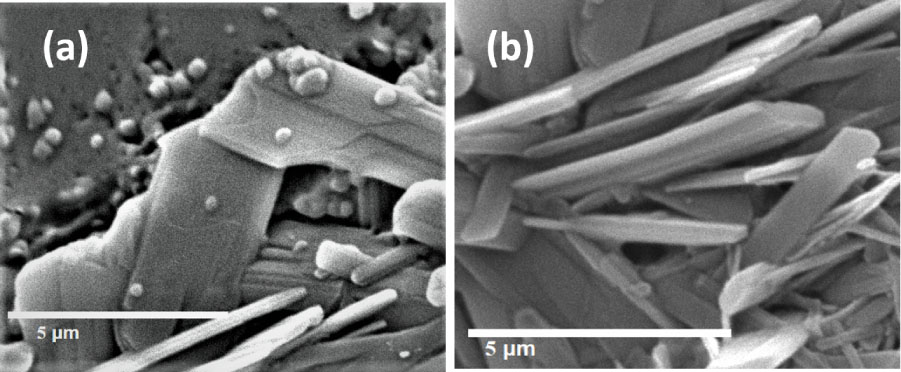
Fig. 8
SEM images (highlighting spherical particles and crystals) of CSi. SEM, scanning electron microscopy.
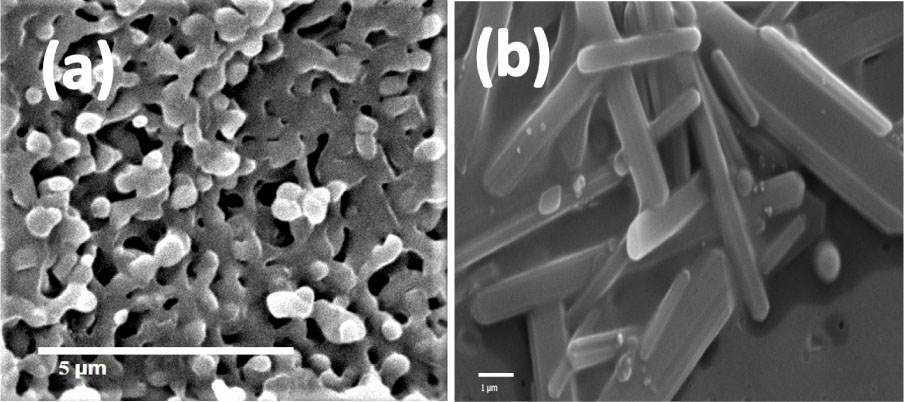
Fig. 9
SEM images (highlighting spherical particles and crystals) of CSii. SEM, scanning electron microscopy.
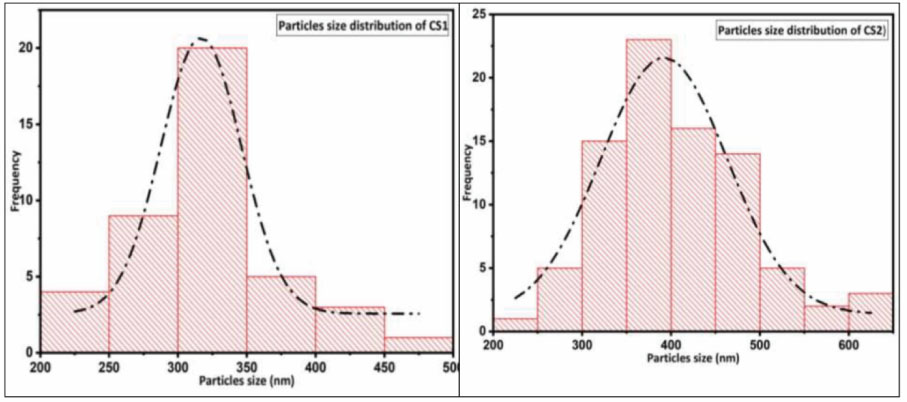
Fig. 10
Histograms of PSD of polymeric CS particles, where the histogram for CSi is on the left and for CSii is on the right. PSD, particle size distribution.
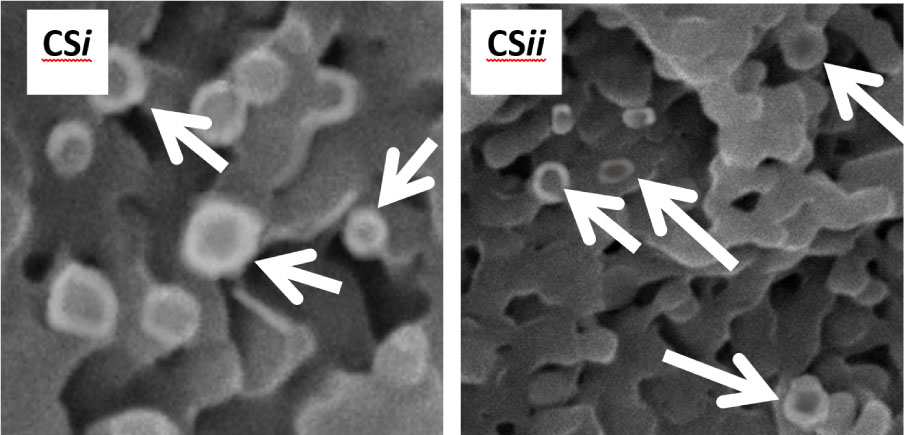
Fig. 11
Core-shell morphologies of obtained particles.