
Fig. 1
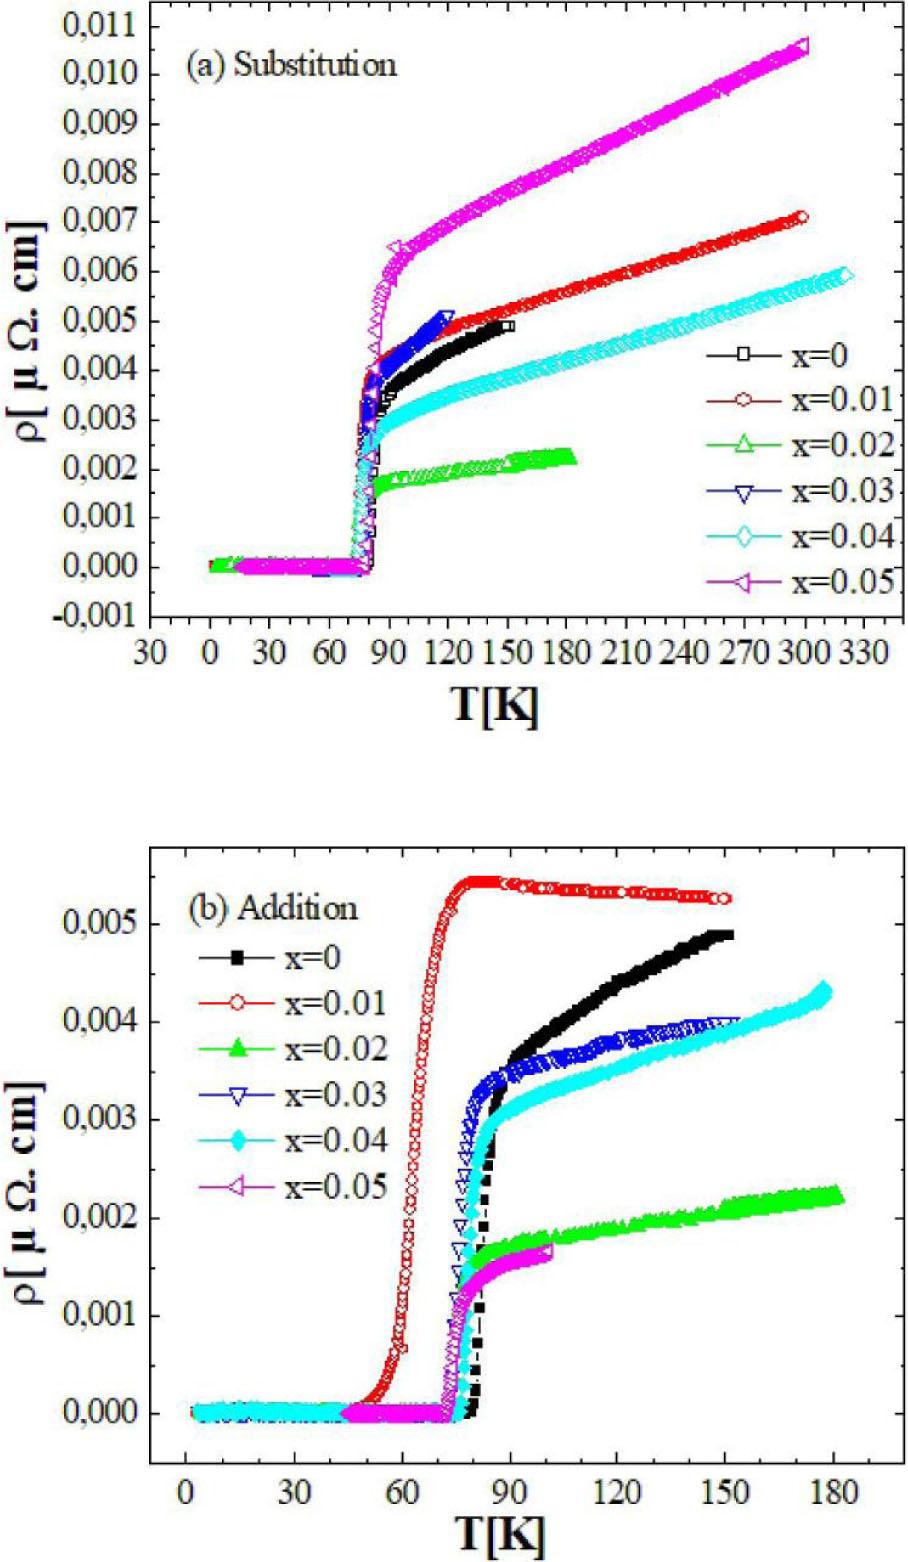
Fig. 2
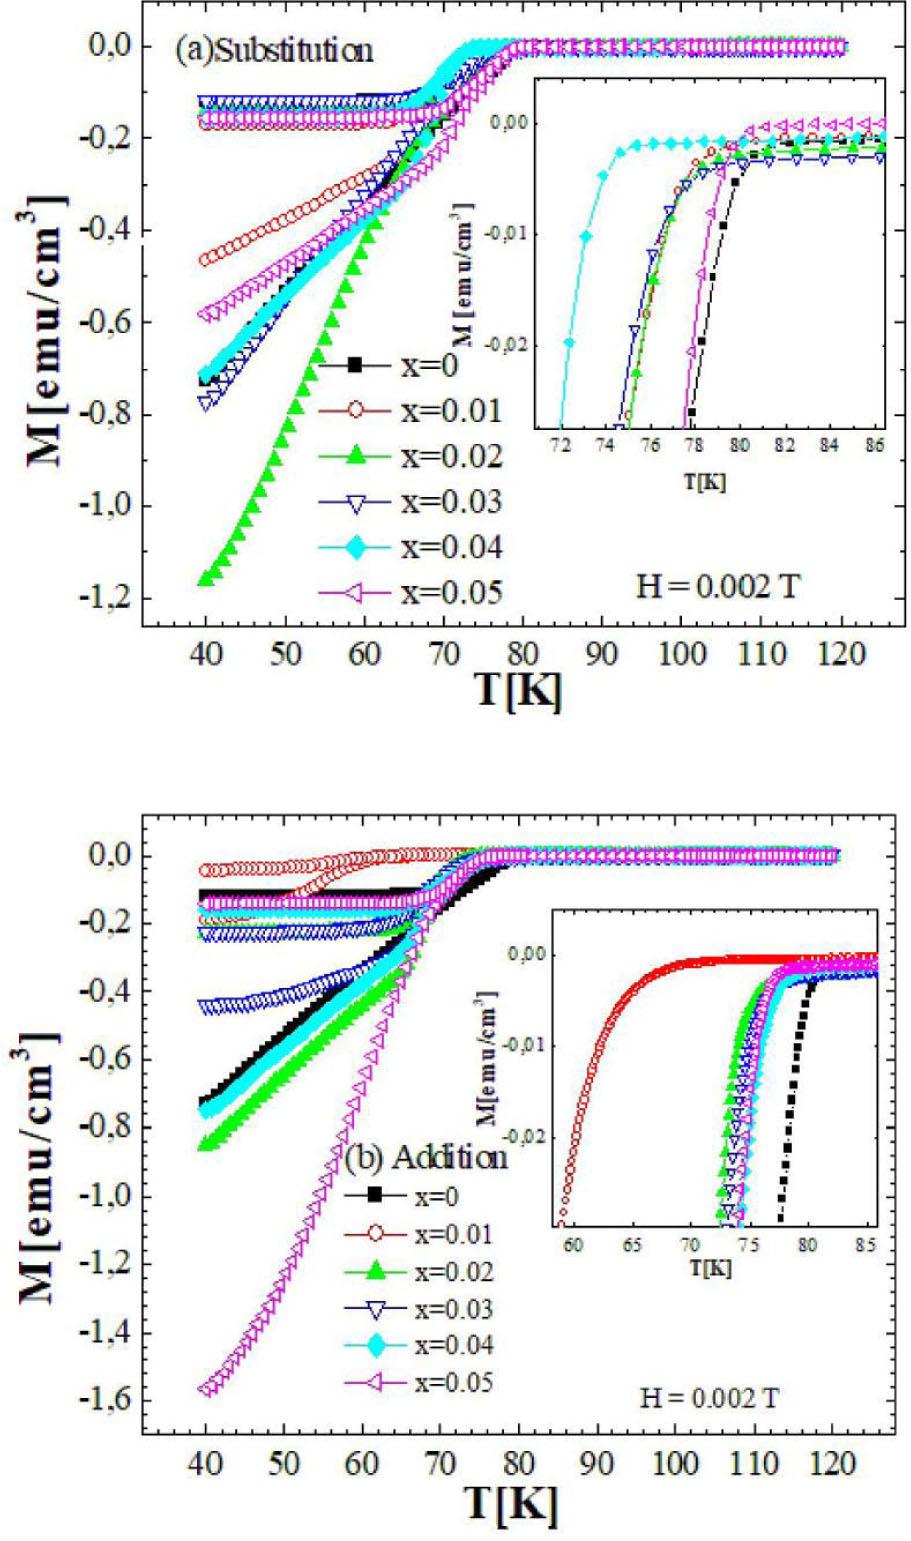
Fig. 3
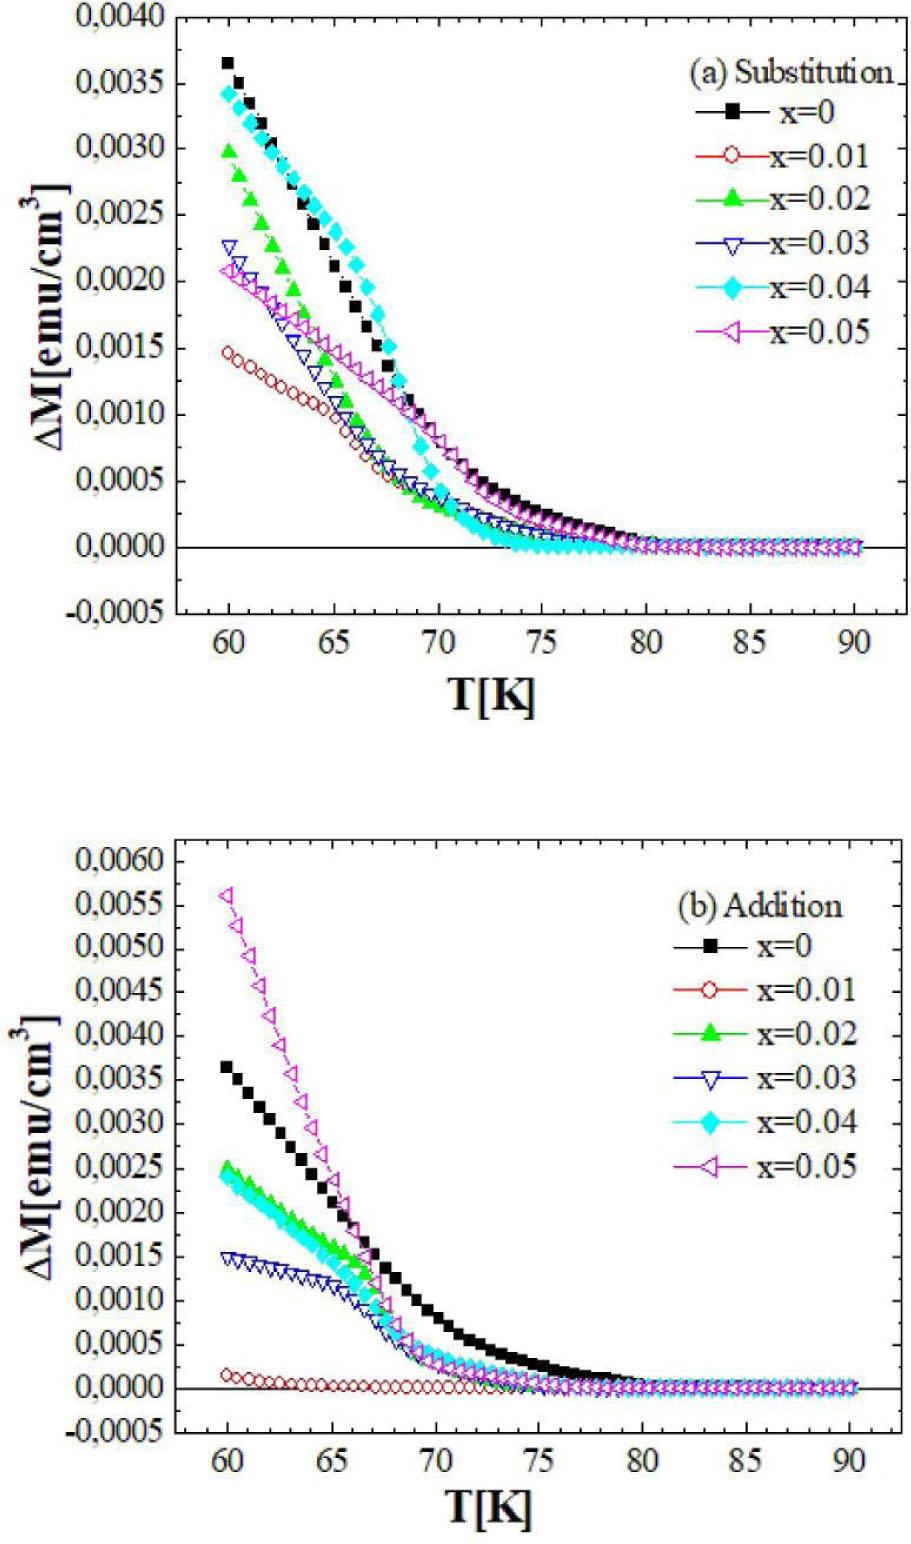
Fig. 4
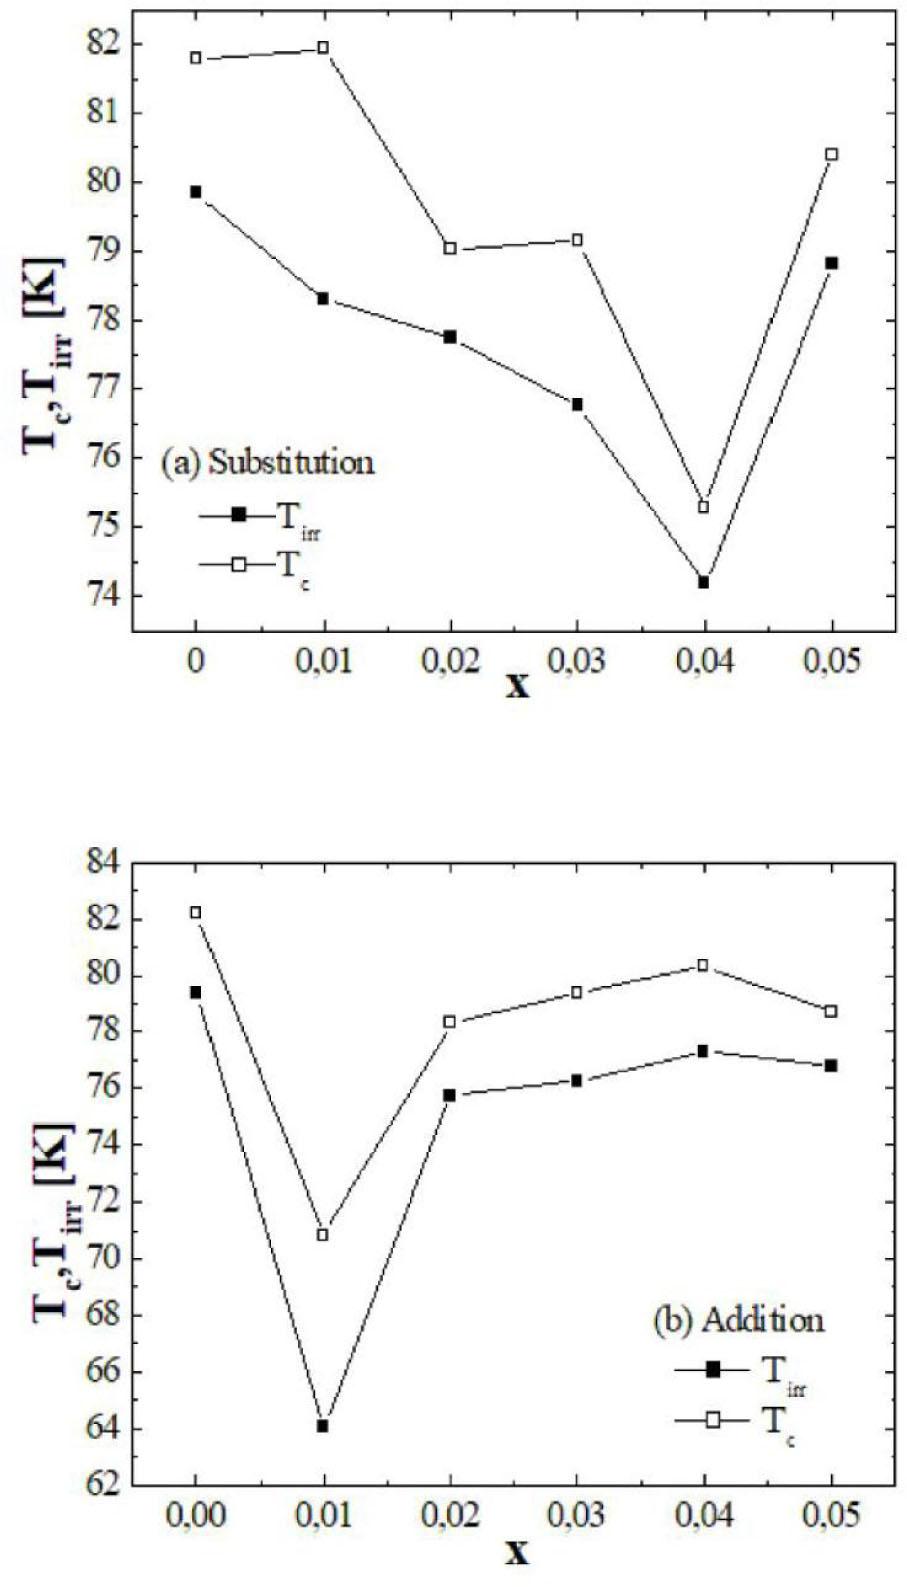
Fig. 5
Fig. 6
Tcoff {\rm{T}}_{\rm{c}}^{{\rm{off}}} of the samples_
| x | 0 | 0.01 | 0.02 | 0.03 | 0.04 | 0.05 |
|---|---|---|---|---|---|---|
|
| 79.27 | 73.73 | 74.56 | 75.71 | 74.43 | 77.68 |
|
| 79.27 | 47.31 | 73.78 | 73.56 | 76.13 | 72.05 |
Variations of the orthorhombic strain (b−a)/(a+b) versus x content of potassium for samples obtained by substitution and addition [21]_
| x | 0 | 0.01 | 0.02 | 0.03 | 0.04 | 0.05 |
|---|---|---|---|---|---|---|
| (b−a)/(a+b)×103 substitution | 0.00413 | 0.00374 | 0.00552 | 0.00501 | 0.00375 | 0.00452 |
| (b−a)/(a+b)×103 addition | 0.00413 | 0.00412 | 0.00361 | 0.00429 | 0.00269 | 0.00439 |
Variations of lattice parameter c versus x content of potassium for samples obtained by substitution and addition [21]_
| x | 0 | 0.01 | 0.02 | 0.03 | 0.04 | 0.05 |
|---|---|---|---|---|---|---|
| c[Å] substitution | 30.6841 | 30.71 | 30.5705 | 30.5124 | 30.6947 | 30.7269 |
| c[Å] addition | 30.6841 | 30.7985 | 30.7479 | 30.7203 | 30.6479 | 30.7074 |
Tconset {\rm{T}}_{\rm{c}}^{{\rm{onset}}} of the samples_
| x | 0 | 0.01 | 0.02 | 0.03 | 0.04 | 0.05 |
|---|---|---|---|---|---|---|
|
| 82.19 | 81.94 | 79.03 | 79.14 | 75.28 | 80.4 |
|
| 82.19 | 70.85 | 78.3 | 79.38 | 80.31 | 78.72 |