Walnut (Juglans regia L.) stands as one of the most widely consumed nuts globally, with its consumption steadily increasing. Like other nuts, walnuts are valued as a healthful food with a high content of fatty acids and proteins. They also contain phytochemicals such as vitamin E, melatonin, ellagic acid, carotenoids and polyphenols, all of which have antioxidant properties. These compounds help to reduce the risk of cancer, type 2 diabetes, coronary heart disease and neurological disorders (Han et al., 2018; Gülsoy et al., 2019).
However, recent studies have indicated that nuts can also serve as a source of contamination with toxic elements (Kafaoğlu et al., 2014). Therefore, the potential negative effects on human health that may result from excessive walnut consumption should not be overlooked (Bielecka et al., 2021). According to the regulations in the Official Journal of the European Union (OJEU, 2023), the contents of Pb and Cd in nuts should not exceed 0.6 mg kg-1 and 0.2 mg kg-1, respectively. Metals that enter the food through soil, water and air can damage the kidneys and nervous system of human and lead to symptoms such as weakness, headaches, abdominal cramps, diarrhea, anemia, and mental disorders (Pratush et al., 2018).
The main sources of lead (Pb) pollution come from industrial activities, especially those related to fossil fuels, batteries and household paints. Pb, a highly toxic heavy metal, interferes with the physiological processes of plant and, unlike trace elements such as zinc, copper and manganese has no biological function. It is often found as a contaminant in various foods and poses risk to almost all organs of the human body. Even low levels of Pb exposure in children can lead to behavioral disorders, learning difficulties and growth retardation. In adults, Pb can lead to cardiovascular complications and impair the function of the kidneys and reproductive system (IARC, 2020).
Cadmium (Cd) and its various compounds are carcinogens associated with the development of various types of cancer, such as breast, stomach, kidney, bladder, liver and pancreatic cancer. The toxicity of cadmium is attributed to the induction of oxidative stress and irreversible DNA damage underlying the mechanism of carcinogenesis (Bielecka et al., 2021).
The widespread use of nickel containing products leads to environmental pollution by Ni and its derivatives. As a toxic and carcinogenic compound, Ni can have numerous adverse health effects depending on the intensity and duration of exposure, including respiratory tract cancers, cardiovascular damage and contact dermatitis, pulmonary fibrosis and asthma (Seilkop & Oller, 2003; Genchi et al., 2020).
Chromium (Cr) pollution is due to various industrial and agricultural activities that lead to increased chromium concentrations in groundwater and soil. Exposure to Cr is associated with allergic reactions and skin rashes, while increased exposure can induce respiratory problems such as shortness of breath, coughing and asthma. Prolonged or excessive exposure can even increase the risk of serious respiratory diseases such as lung and bowel cancer (Jaishankar, 2014).
The aim of this study was to evaluate the contamination of Ni, Cd, Cr, and Pb in walnut genotypes grown in four different locations in the Aras Basin of eastern Türkiye. It also aimed to determine whether the concentrations of these metals vary according to the geographical location.
In the Aras Basin, walnut is generally grown from ungrafted seedlings, resulting in uniform trees that are not compatible with standard walnut varieties. Twenty promising genotypes, five each from Kağızman, Tuzluca, Iğdır and Karakoyunlu sites, were selected as material for this study. Fifteen walnut fruits from each genotype were sampled for heavy metal analysis in the laboratory. The Aras Basin, located in the eastern Anatolian region of Türkiyelongs to the eastern agro-ecological zone. This region is characterised by high mountains and hills and a continental climate. Due to the extent of the Aras Basin, the sampling area was divided into four different regions: Karakoyunlu, Igdir, Tuzluca and Kagizman. The details of these sampling areas are as follows (Fig. 1):
Karakoyunlu: latitude 39°58'15" N, longitude 44°10'41" E, altitude 842 m,
Iğdır: latitude 39°55'10" N, longitude 44°10'59" E, altitude 580 m,
Tuzluca: latitude 40°20'30" N, longitude 43°39'45" E, altitude 1092 m,
Kağızman: latitude 40°80'25" N, longitude 43°70'90" E, altitude 1420 m.
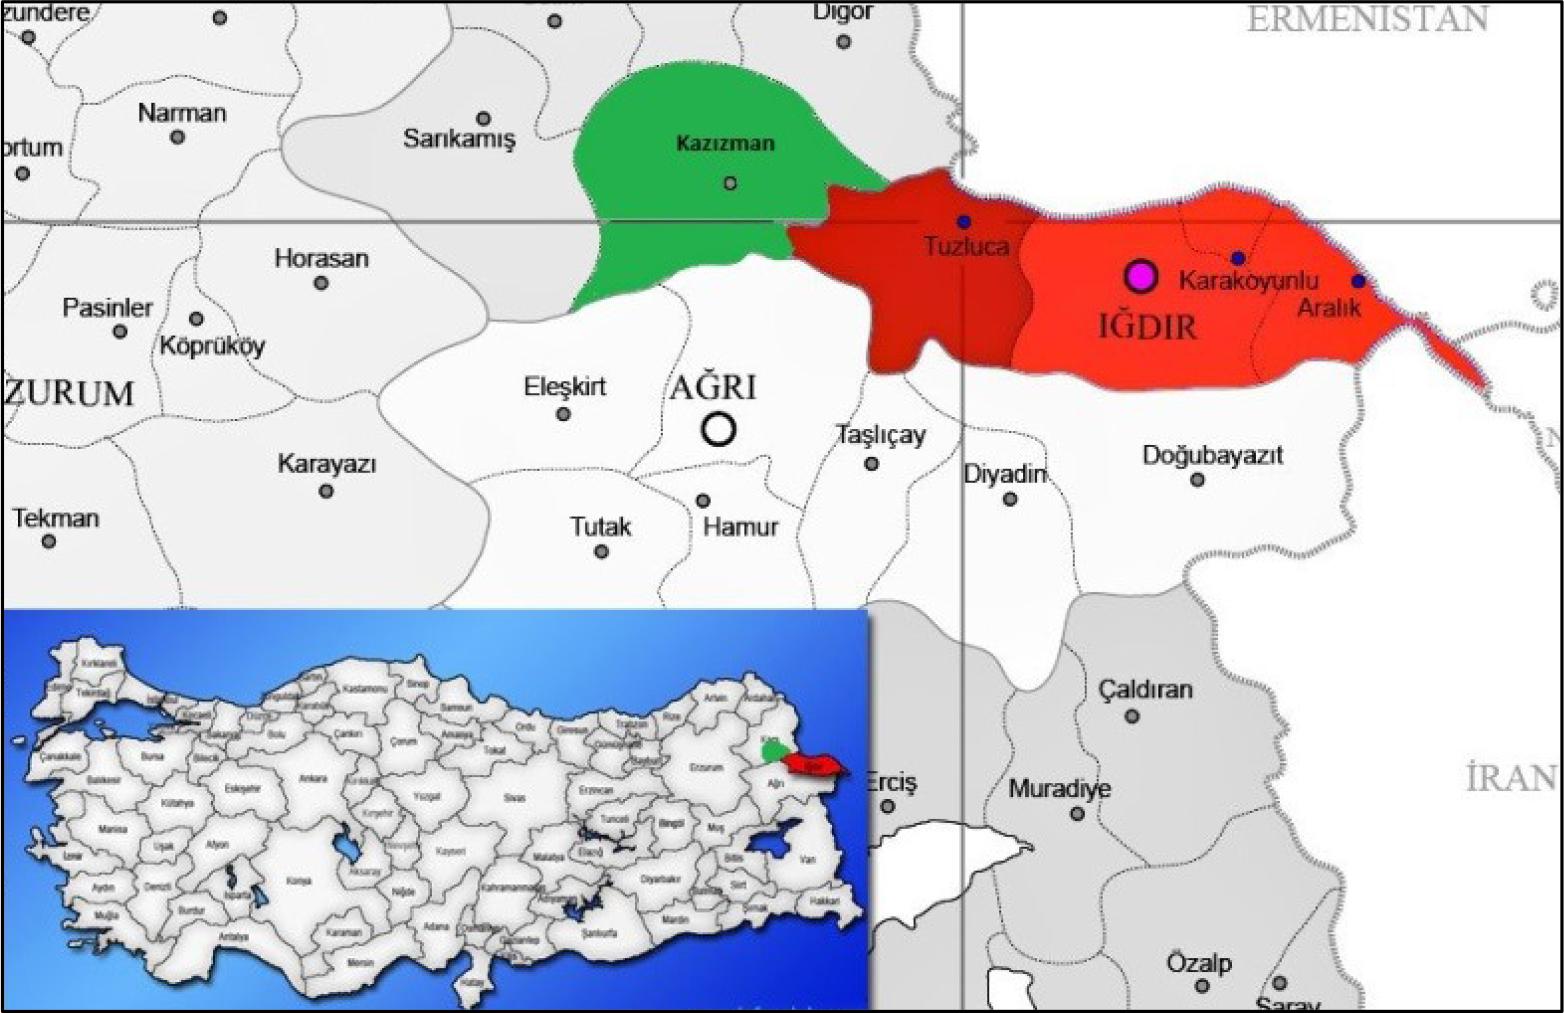
Map of the study area in the Aras Basin of Türkiye.
The walnut samples were first dried in an oven at 68 °C for 48 hours and then ground until they passed through a sieve. Each accurately weighed sample (0.5 g) was digested in a concentrated HNO3-H2O2 acid mixture (2:3 v/v) using a microwave (Bergof Speedwave Microwave Digestion Equipment MWS-2) in three stages: the first stage at 145 °C, 75 % RF for 5 minutes; the second stage at 180 °C, 90 % RF for 10 minutes; and the third stage at 100 °C, 40 % RF for 10 minutes (Mertens, 2005). The concentrations of Cr, Pb, Cd and Ni in the plant tissues were determined using an ICP-MS (Agilent 7500cx, Agilent Technologies, CA, USA).
The standard stock solution (1000 μg L-1) of each metal was used to prepare the standard solution in 2 % HNO3. The standard stock solution was diluted with 2 % HNO3 and the following concentrations were prepared (μg L-1): 10 μg L-1, 30 μg L-1, 50 μg L-1, and 100 μg L-1 for Cd, Pb, Ni, and Cr. Blank solutions were also prepared with the same medium. Calibration intervals were determined based on the expected concentration range for each element. The precision of the method was evaluated by calculating the relative standard deviation of the duplicate determinations of the analyses. The sensitivity of the method for each metal was determined from the resulting slope of the calibration curves. The correlation coefficients for all curves (including digestion solutions and diluted samples) were above 0.990. Data are expressed as μg kg-1 for Cd, Pb, Ni and Cr.
The daily intake rate (DIR) of heavy metals from walnuts was calculated using the following equation (Sharma et al., 2009): DIR = (C*D)/BW, where C is the average concentration of the analyzed element in the sample (mg kg-1), D is the average consumption level of walnut fruit (0.042 kg person-1, day-1), and BW is the average body weight (70 kg) for adults (Bielecka et al., 2021). The hazard quotient (HQ) for consumers from walnut consumption was assessed as follows (USEPA, 2013): HQ = DIR/RfD, where RfD represents the reference dose for heavy metals. For Pb, Cd, Cr, and Ni, oral RfD is 0.0035, 0.001, 1.5, and 0.02 mg per kg, respectively (USEPA 2010, USEPA 2013). HQ values less than 1 are considered as no risk, while values greater than 1 are considered as indicating high risk for toxic metals with potential long-term adverse health effects (Singh & Kumar, 2017).
The normality test (Shapiro-Wilk) was applied to the data set prior to the analysis of variance and the probability value was significant for all dependent variables (Cr, Cd, Ni and Pb). However, as the skewness and kurtosis values of these variables were found to be between +1.5 and -1.5, the data were accepted as normally distributed (Tabachnick & Fidell, 2013). The analysis of variance, principal component analysis (PCA), biplot PCA design, heat map and correlation coefficient with scatter matrix were performed using JMP 17 pro software package (Trial, JMP Statistical Discover LLC, North Carolina, USA). The Fishers’s least significant difference (LSD) test was used to evaluate the results at p ≥ 0.05 level. Data are presented as mean ± SE (standard errors).
The concentrations of heavy metals (Cd, Pb, Ni, and Cr) in walnuts are summarized in Tab. 1. In walnut fruits, these metal concentrations ranged from 1.2 to 4.0 μg kg-1 for Cd, 13.7 to 82.9 μg kg-1 for Pb, 71.5 to 380.6 μg kg-1 for Ni, and 169.4 to 892.1 μg kg-1 for Cr. The lowest amounts of Ni and Cr were found in genotype 76IGD26, Pb in genotype 76IGD22 at the Igdir site, and Cd in genotype 76KAR05 at the Karakoyunlu site. However, the highest amounts of Ni and Cd were found in genotype 79TUZ36, Pb in genotype 76TUZ22 at the Tuzluca site, and Cr in genotype 36KAG30 at the Kağızman site. As shown in Tab. 1, highly significant differences were found between the walnut genotypes with respect to the analysed metals at the p<0.001 level. In walnut genotypes, the average values of heavy metals increase in the order of Cd (2.1 μg kg-1) < Pb (30.6 μg kg-1) < Ni (202.8 μg kg-1) < Cr (474.9 μg kg-1). The present study was compared with the previous studies carried out worldwide and in Türkiye as seen Tab. 2. In this table, the scientists reported Cr content in walnut in the range of 1.3-1454.0 μg kg-1, Ni content 1.6-1727.0 μg kg-1, Cd content 0.6-705.0 μg kg-1 and Pb content 0.2-61.3 μg kg-1.
Comparison of walnut genotypes with respect to trace elements examined.
| Genotypes | Cr μg kg-1 | Ni μg kg-1 | Cd μg kg-1 | Pb μg kg-1 |
|---|---|---|---|---|
| 76 IGD-05 | 650.4±0.8 f | 243.9±1.3 h | 2.4±0.1 de | 55.9±0.4 c |
| 76 IGD-22 | 300.7±0.7 o | 167.2±2.3 k | 1.3±0.2 ijk | 13.7±0.2 r |
| 76 IGD-26 | 169.4±0.4 t | 71.5±0.3 t | 1.4±0.0 ijk | 15.9±0.4 p |
| 76 IGD-66 | 209.4±0.4 r | 150.3±1.0 m | 1.3±0.1 jk | 43.1±0.1 d |
| 76 IGD-94 | 601.9±0.7 g | 337.6±0.5 b | 1.9±0.1 g | 28.6±0.6 h |
| 76 KAR-03 | 313.1±0.4 n | 144.7±0.7 n | 1.3±0.1 jk | 20.5±0.4 mn |
| 76 KAR-05 | 236.8±0.3 q | 108.4±0.7 p | 1.2±0.0 k | 17.7±0.3 o |
| 76 KAR-09 | 264.6±0.4 p | 99.1±0.8 r | 1.4±0.1 ijk | 31.4±0.2 g |
| 76 KAR-12 | 419.5±0.3 k | 165.3±0.4 l | 2.7±0.2 c | 24.9±0.5 j |
| 76 KAR-45 | 343.0±0.4 m | 101.8±0.3 q | 1.4±0.1 ijk | 14.8±0.4 q |
| 76 TUZ-03 | 714.5±0.7 d | 305.2±0.7 d | 2.5±0.1 cd | 57.2±0.3 b |
| 76 TUZ-22 | 793.1±0.7 b | 298.7±0.4 e | 3.4±0.1 b | 82.9±0.6 a |
| 76 TUZ-36 | 745.5±0.5 c | 380.6±0.3 a | 4.0±0.1 a | 26.7±0.5 i |
| 76 TUZ-59 | 577.2±0.2 h | 291.1±0.3 f | 2.1±0.1 fg | 22.1±0.5 kl |
| 76 TUZ-82 | 540.2±0.4 i | 178.5±0.7 j | 1.8±0.2 gh | 21.4±0.7 lm |
| 36 KAG-02 | 387.4±0.8 l | 116.9±0.5 o | 1.6±0.1 hi | 19.9±0.2 n |
| 36 KAG-30 | 892.1±0.7 a | 267.2±0.7 g | 3.6±0.1 b | 35.1±0.3 f |
| 36 KAG-33 | 478.8±1.2 j | 318.3±0.6 c | 2.4±0.2 cde | 18.4±0.8 o |
| 36 KAG-51 | 198.6±0.4 s | 96.8±0.4 s | 1.5±0.1 ij | 40.0±0.2 e |
| 36 KAG-58 | 662.9±0.4 e | 213.5±0.7 i | 2.2±0.2 ef | 22.6±0.9 k |
| Minimum | 168.7 | 71.1 | 1.1 | 13.5 |
| Maximum | 893.1 | 381.2 | 4.2 | 83.7 |
| Std. error of mean | 28.1 | 12.1 | 0.1 | 2.2 |
| Average | 474.9 | 202.8 | 2.1 | 30.6 |
| LSD (0.05) | 1.4 | 1.1 | 0.3 | 1.1 |
| Sig. Level | *** | *** | *** | *** |
Different letters in the same column indicate significantly different values according to Fisher’s LSD test.
highly significant at p<0.001.
Comparison of trace element concentration (μg kg-1) in different countries of walnut origin.
| Location | Sampling site | Cr | Ni | Cd | Pb | References |
|---|---|---|---|---|---|---|
| Türkiye | Production areas | 474.9 | 202.8 | 2.1 | 30.6 | Present study |
| Sweden | Supermarket | 1.3 | 1.6 | 0.6 | 0.2 | (Rodushkin et al., 2008) |
| Brazil | Supermarket | / | / | <2.0 | <6.0 | (Muller et al., 2012) |
| Bulgaria | Growing area | / | / | 15.9 | 61.3 | (Arpadjan et al., 2013) |
| Chile | Supermarket | 82.4 | 719.0 | 1.3 | 9.2 | (Kafaoğlu et al., 2014) |
| Türkiye | Near highway area | 503.0 | 1160.0 | 55.0 | / | (Kalkışım et al., 2014) |
| China | Supermarket | <0.9 | / | 20 | <11 | (Yin et al., 2015) |
| Serbia | Supermarket | 1423.7 | 969.7 | ND | ND | (Tosic et al., 2015) |
| China | Farmer’s markets | 290.0 | / | 16.0 | 6.9 | (Ni et al., 2016) |
| Spain | Supermarket | 1454 | 1727 | 705 | <0.8 | (Moreda-Pineiro et al., 2016) |
| China | Production areas | 184.1 | / | 7.3 | 55.6 | (Han et al., 2018) |
| China | Production areas | 400.0 | 1600.0 | 3.0 | 30.0 | (Wu et al., 2020) |
| Poland | Supermarket | / | / | 5.4 | 13.0 | (Bielecka et al., 2021) |
Humans can be exposed to pollutants due to various potential reasons. Pollutants can enter the body through absorption, through the respiratory system, and by ingestion during food intake (Hun et al., 2018). Among these pathways, ingestion is one of the most significant routes for toxic substances to enter the body. Therefore, conducting research to determine the hazard quotient (health risk) of these toxic substances is crucial in the food chain (Galal, 2016; Ahmad et al., 2023). The daily intake rate (DIR) for heavy metals (Cd, Cr, Ni and Pb) of the walnut genotypes analyzed in the present study did not exceed the value of 1 and remained within the confidence limits (Tab. 3). HQ is frequently used to assess the risk of harmful substances in foods (Asgari & Cornelis, 2015). USEPA consider HQ values greater than 1 to be hazardous to human health. The HQ values of the examined heavy metals are given in Tab. 3. Because of HQ<1 for Cr, Ni, Cd, and Pb, walnut genotypes grown in the Aras Basin did not pose a risk.
Daily intake rate (DIR), the reference dose (RfD) and the hazard quotient (HQ) values of the studied heavy metals in walnuts.
| Heavy metals | Cr | Ni | Cd | Pb |
|---|---|---|---|---|
| DIR mg day-1 | 0.01995 | 0.00852 | 0.0000865 | 0.00128 |
| RfD | 1.5 | 0.02 | 0.001 | 0.0035 |
| HQ | 0.0133 | 0.4260 | 0.0865 | 0.3657 |
Fig. 2 illustrates the average heavy metal contents of the walnut genotypes at the individual location. Depending on the locations, the average heavy metal content decreased in the following order: Tuzluca (674.1 μg kg-1) > Kağızman (523.9 μg kg-1) > Igdir (386.4 μg kg-1) > Karakoyunlu (315.4 μg kg-1) for Cr, Tuzluca (290.8 μg kg-1) > Kağızman (202.6 μg kg-1) > Igdir (194.1 μg kg-1) > Karakoyunlu (123.9 μg kg-1) for Ni, Tuzluca (2.7 μg kg-1) > Kağızman (2.3 μg kg-1) > Igdir (1.7 μg kg-1) > Karakoyunlu (1.6 μg kg-1) for Cd, and Tuzluca (42.0 μg kg-1) > Igdir (31.5 μg kg-1) > Kağızman (27.2 μg kg-1) > Karakoyunlu (27.9 μg kg-1) for Pb (see Fig. 2). Walnut genotypes at the Tuzluca location exhibited higher heavy metal levels compared to genotypes at other locations. This could be the result of a combination of climatic conditions, soil parent material, walnut genotypes and plant protection measures. Similarly, differences in the heavy metal content of walnuts from different regions have been reported in literature. (Han et al., 2018; Wu et al., 2020).
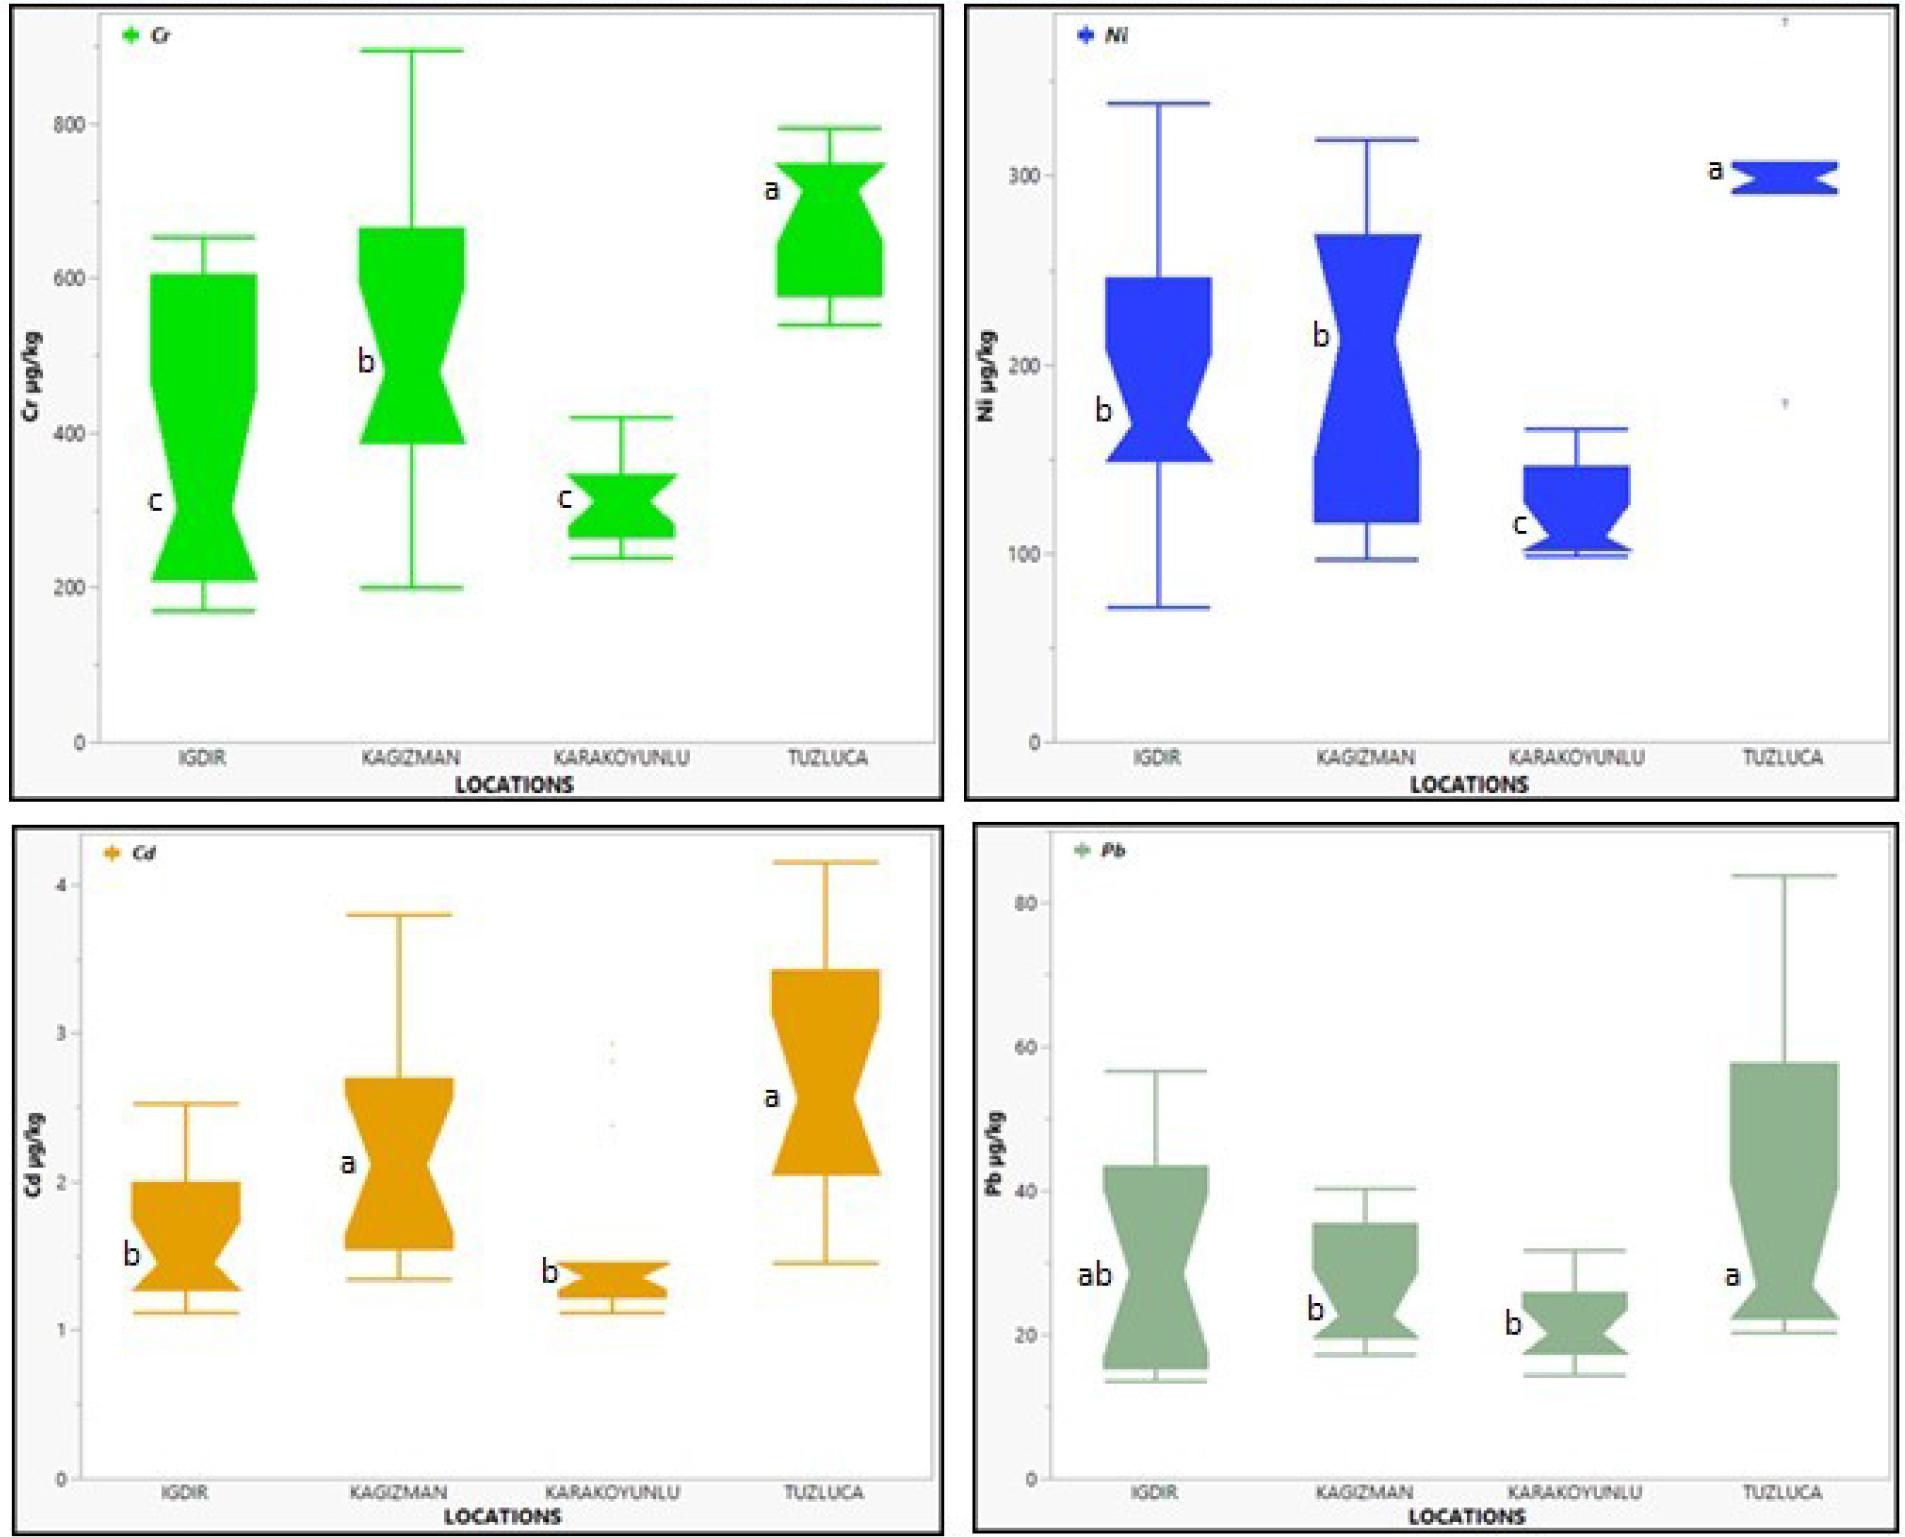
Box and Whisker plots for Cr, Ni, Cd and Pb levels in walnut genotypes at different locations of the Aras Basin. The differences between locations are significant at P≤0.05 according to LSD test.
When examining the correlation between heavy metals (Fig. 3), a strong, positive, and statistically significant correlation was found between Cr and Ni (r=0.83), as well as between Cr and Cd (r=0.85). In addition, a positive and moderate correlation was observed between Cr and Pb (r=0.46). Similarly, a positive, and significant correlation was found between Ni and Cd (r=0.76), while a weaker, but still significant, positive correlation was found between Ni and Pb (r=0.36). Finally, the relationship between Cd and Pb was moderate, positive, and significant (r=0.43). In a previous study, a positive correlation between Cr and Cd was identified in walnuts (Han et al., 2018).
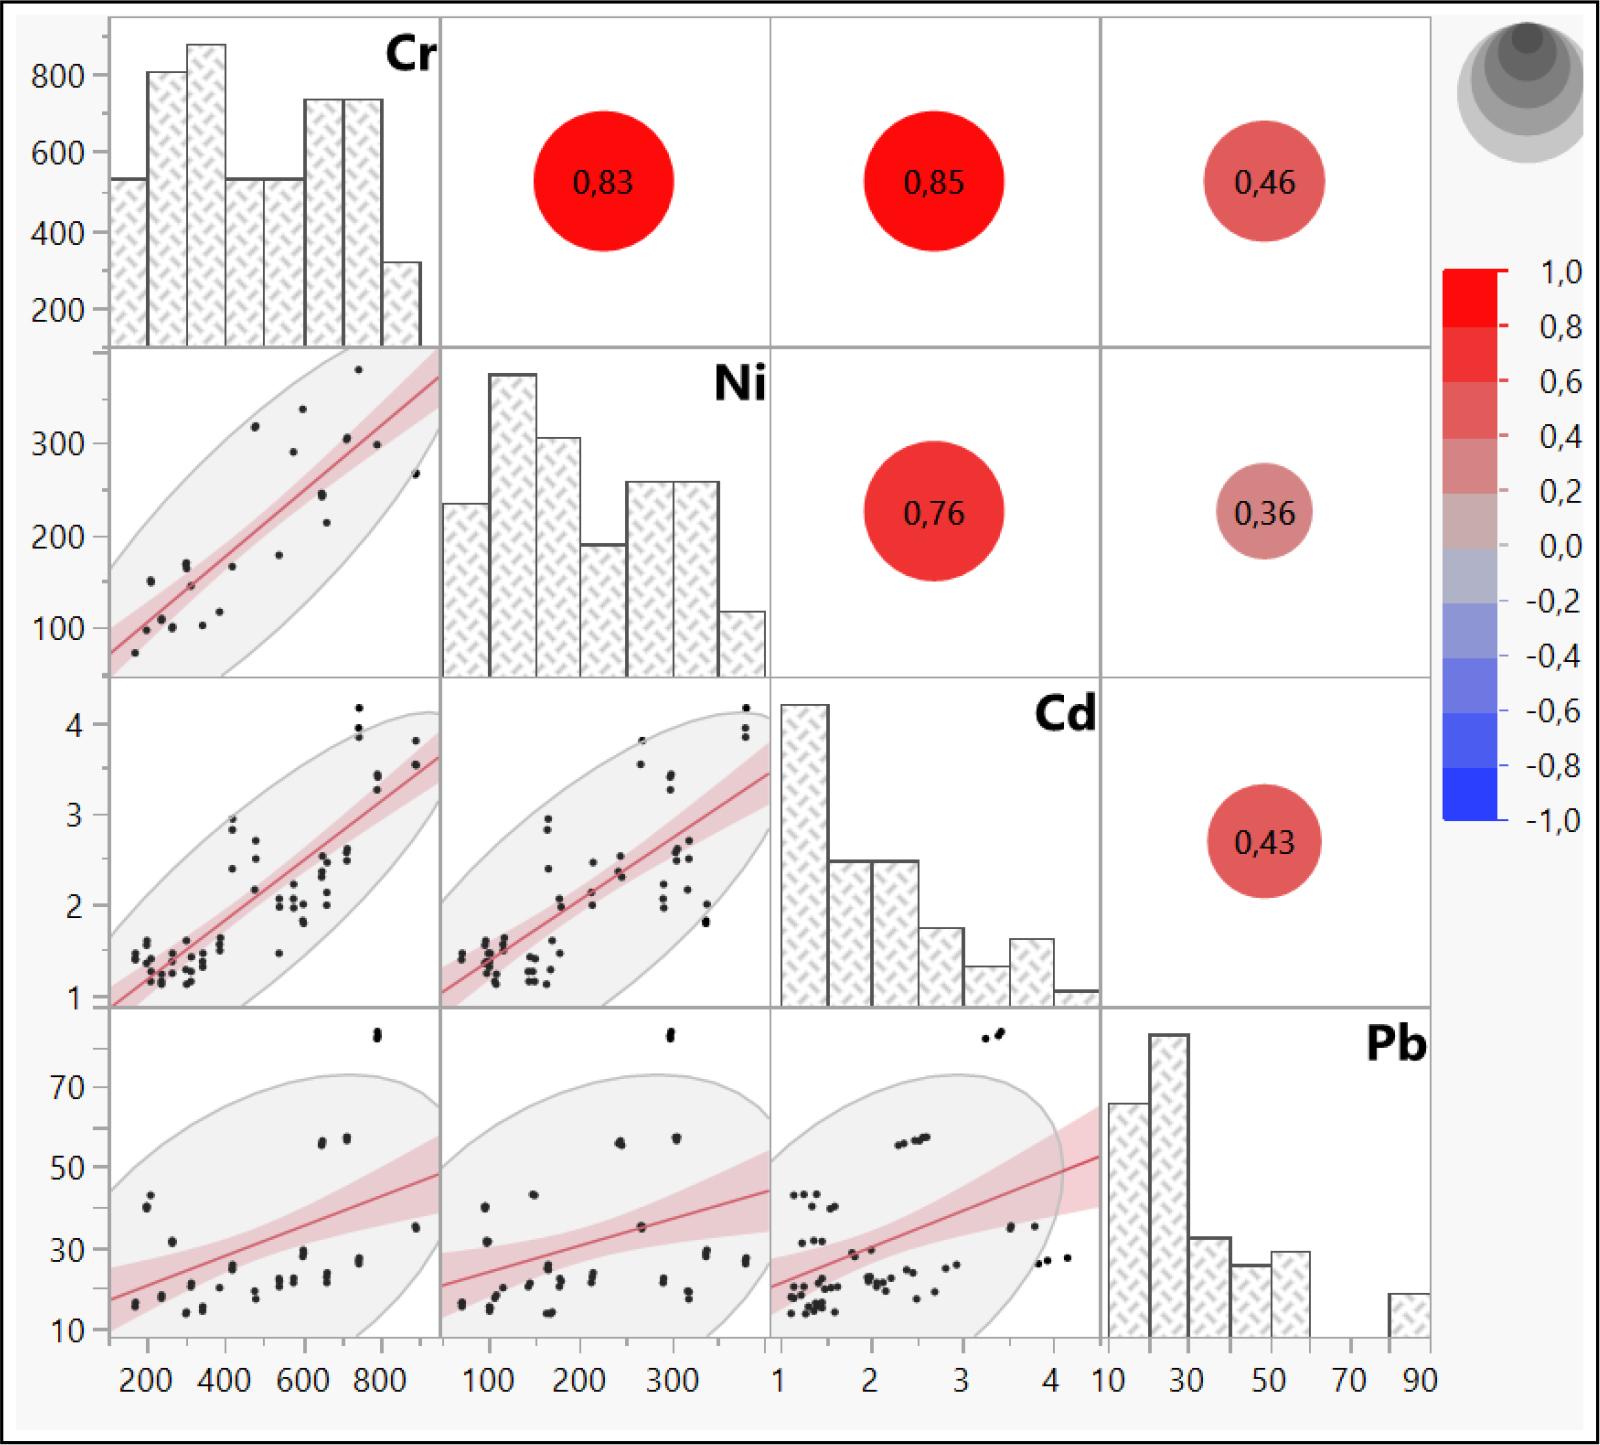
Scatterplot matrix depicting the relationship between pairs of characteristics, accompanied by Person's Correlation Coefficient. The correlation between all pairs is positively significant at p≤0.05.
In order to determine the influence of walnut genotypes on heavy metal values, the principal component analysis (PCA) in Fig. 4, by the two PCs (PC1 and PC2) explained about 90.8% of the total variance in the dataset. PC1 had high loadings for Cr, Cd, Ni and Pb. A similar result was obtained by Han et al. (2018) who found that the elements Cd, Pb and Cr had high loadings in the first principal component to explain the variance in walnuts. Genotypes “76TUZ22”, “76IGD05” and “76TUZ03” in the red ellipse in the upper right quadrant of the PCA image were closely correlated with high Pb levels, indicating possible Pb contamination. Another relationship was also observed between the walnut genotypes ("36KAG30" and "76TUZ36"), located in the green ellipse in the lower right quadrant of the PCA image, and high concentrations of Cr, Cd and Ni. These genotypes were classified as potentially risky. The eight walnut genotypes in the blue ellipse in the lower right and lower left quadrants of the PCA image had moderate concentrations of the toxic metals analyzed. The walnut genotypes in the orange ellipse in the lower left and upper left quadrants of the PCA image were classified as low with respect to the toxic elements. In our study, in addition to the clustering in the PCA image, the accuracy of this clustering was confirmed by the two-way hierarchical cluster analysis (Fig. 5). In this image, the walnut genotypes were divided into four different groups, which show increasing values of the analyzed heavy metals from blue to red, according to the genotypes on this heat map.
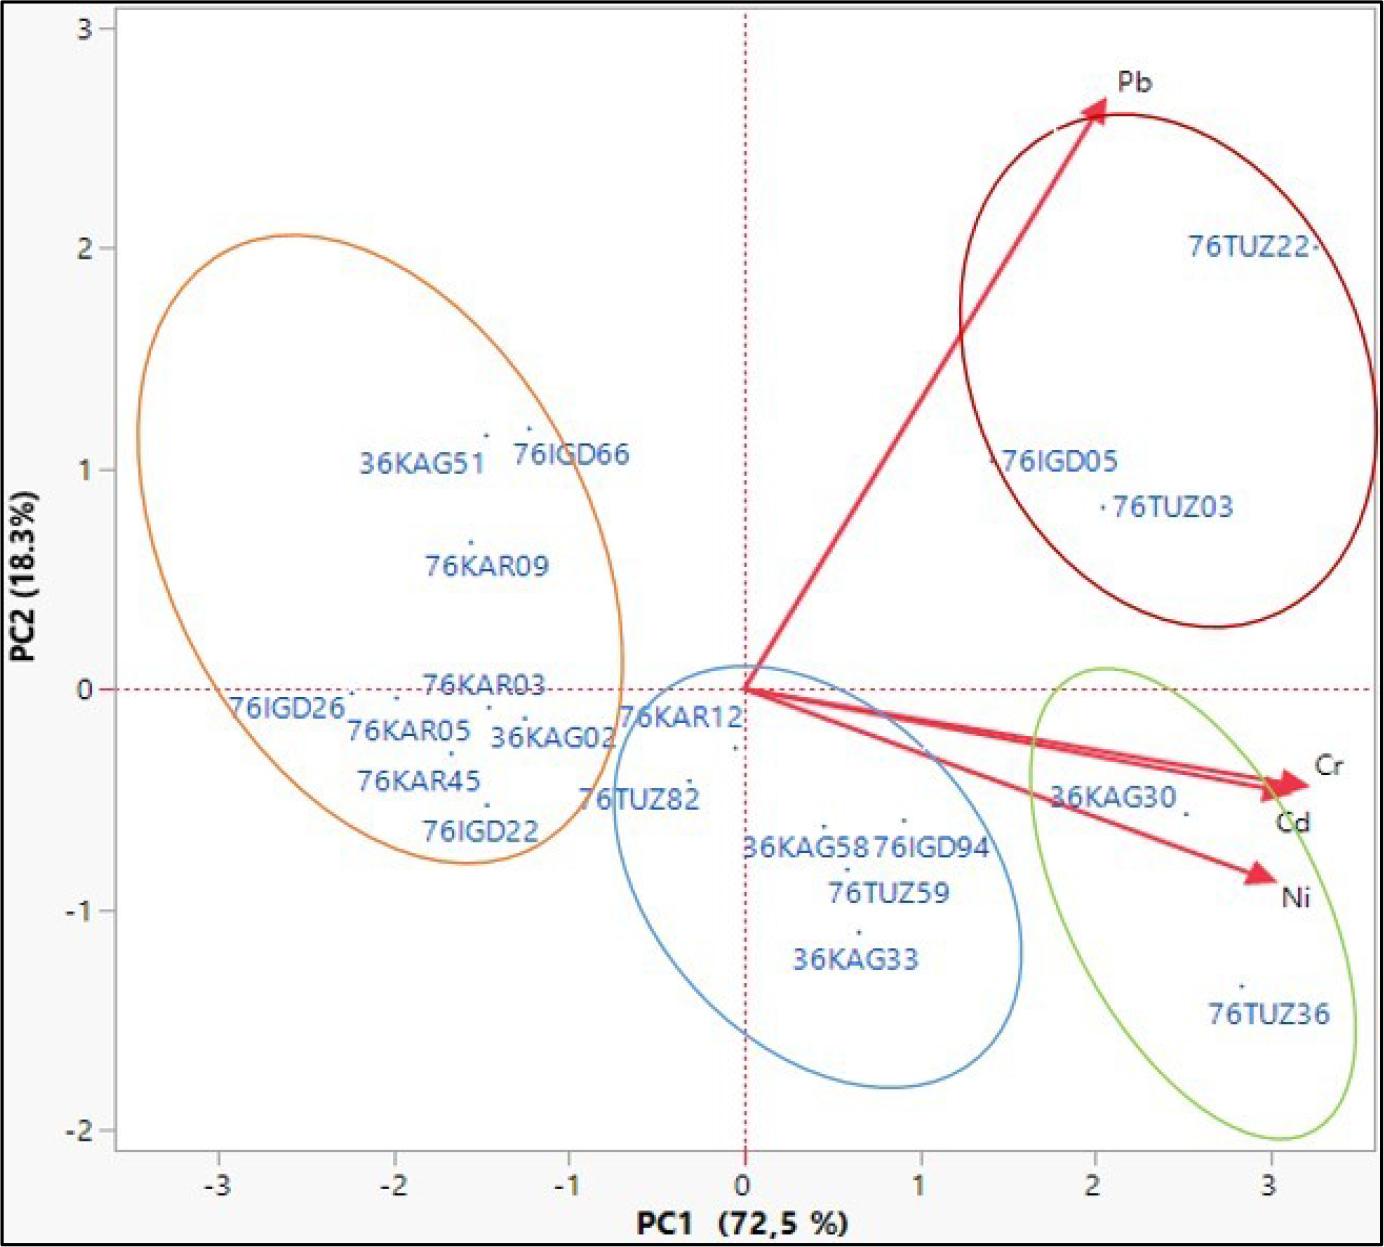
Biplot visual of PCA between heavy metals and walnut genotypes
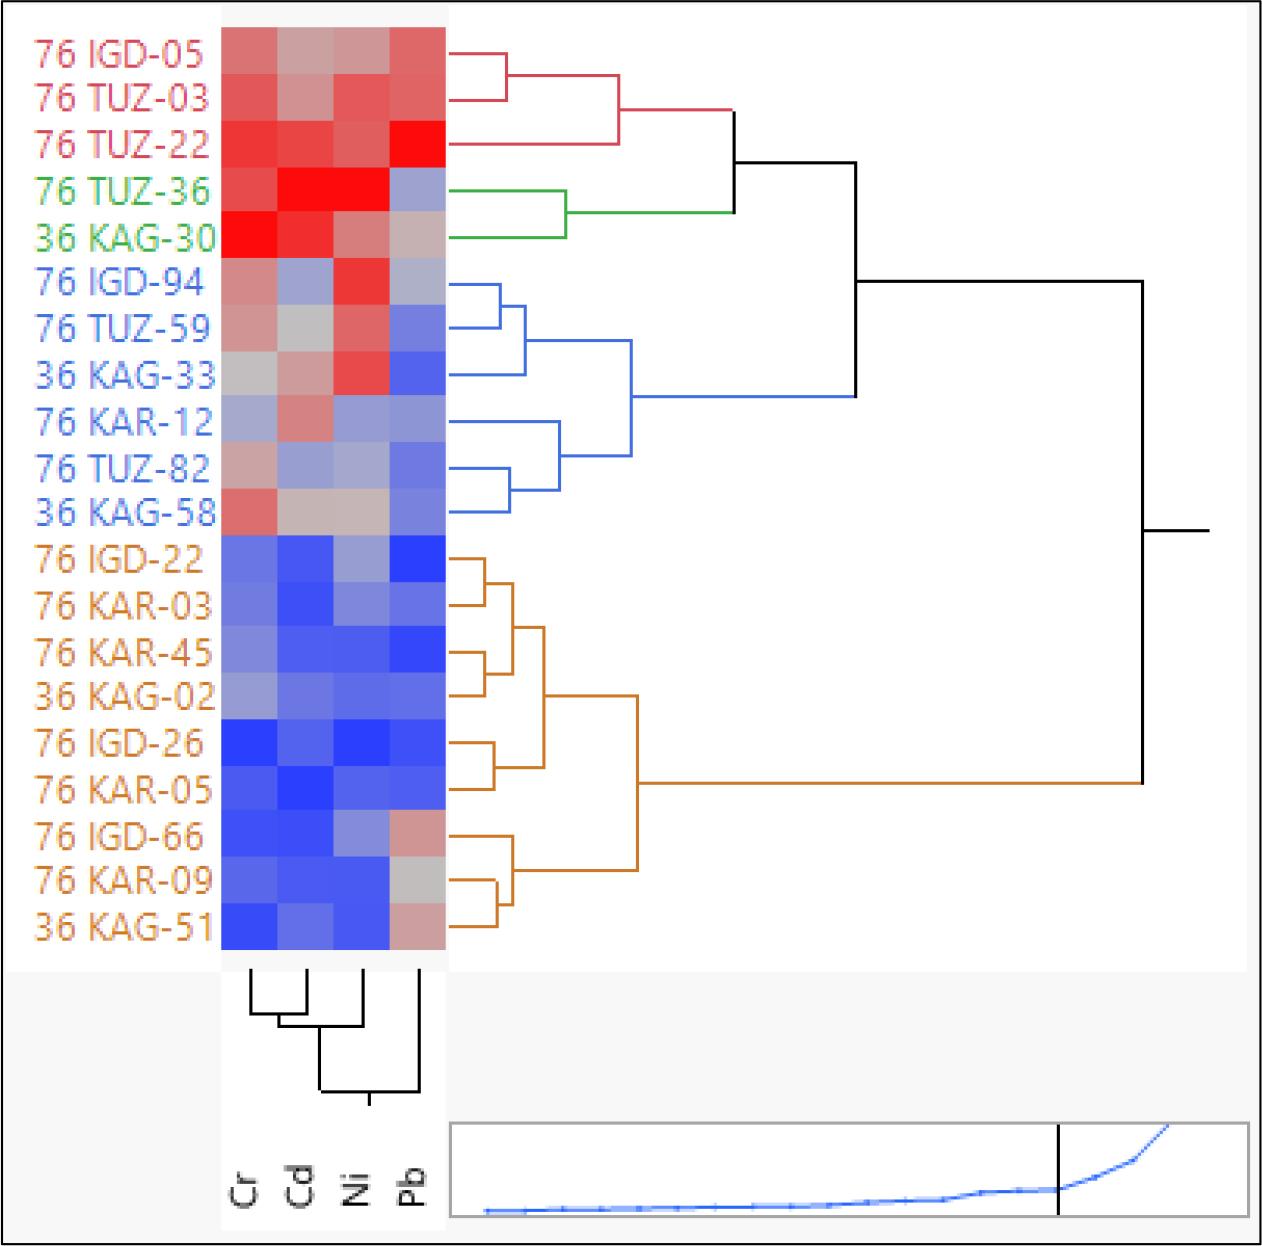
Two-way hierarchical cluster analysis (heat map) between genotypes and heavy metals.
In our study it was found that there was a wide variation in heavy metals between the walnut genotypes tested. However, the genotypes 76IGD22, 76KAR03, 76KAR02, 76IGD26 and 76KAR05 showed a very safe concentration of heavy metals. It was noteworthy that these genotypes were found in areas such as Iğdır and Karakoyunlu, which are characterised by lowlands and plains. In contrast, the walnut genotypes in Tuzluca contained more heavy metals in the form of trace elements than other sites. The result of our study was that the walnut genotypes were safe in terms of HQ levels. It is recommended that future studies should be designed to represent Türkiye in general and that heavy metal levels should be monitored in certain periods.