
1. Introduction
Chevkinite-group minerals (CGMs) minerals have attracted increasing interest from mineralogists and petrologists in recent years (Macdonald & Belkin, 2002), which led us to focus on the hydrothermal transformations of chevkinite (Cvk)-(Ce) into monazite (Mnz)-(Ce) in the present study. CGM minerals crystallize in a variety of pressure–temperature (P–T) conditions and geological environments (Muhling et al., 2014; Vlach & Gualda, 2007; Macdonald et al., 2019), such features can occur across a wide range of magmatic and metamorphic environments, particularly those formed through metasomatic processes.
Cvk-(Ce) is one of the minerals included in the Cvk group, which is referred to by the abbreviation CGM. The most common representatives of this group are Cvk-(Ce) and perrierite-(Ce) (Macdonald & Belkin, 2009). Regarding their composition, both the formula of Cvk-(Ce) and perrierite-(Ce) locate near the ideal stoichiometric formula established for the CGM group, as A4BC2D2 (Si2O7)2O8 (also written as A4BC2D2Si4O22), where A = REE, Ca, Sr, Th; B = Fe2+; C = Ti, Al, Fe3+, Fe2+, Mn, Mg, Zr, Nb; D = Ti (Gottardi, 1960). Beyond their compositional variability, CGM are notable for their broad petrogenetic range. They occur primarily as accessory phases in igneous rocks spanning ultramafic to felsic compositions, crystallizing from both early magmatic and late-stage evolved melts enriched in REE. They are also present in high-grade metamorphic rocks and in metasomatic environments such as skarns and fenites, where they may undergo hydrothermal alteration. This wide distribution reflects their stability over a broad range of P–T conditions and their important role as carriers of REE and high field strength element (Macdonald et al., 2019)
In this work, we experimentally investigate the effect of various hydrothermal solutions on the newly formed mineral phases with a special focus on Mnz-Ce as one of the products of such transformations.
2. Samples and methods
2.1. Experiments
A series of 24 experiments were conducted to understand the process of hydrothermal modification of Cvk-(Ce). The starting material for the experiments was a Cvk-(Ce) crystal from pegmatite from the Diamer district of Pakistan. The average formula of the initial Cvk used can be written as: (Ce1.85La0.79Nd0.64Ca0.39Pr0.22)3.9Fe2+ (Fe2+ 1.03Ti0.75Mn0.16)1.9Ti2(Si2O7)2O8. Its exact chemical parameters are presented in the study by Stachowicz et al. (2024).
Experiments with Cvk-(Ce) were conducted using a cold-seal autoclave in a high-pressure hydrothermal system to simulate mineral assemblages and hydrothermal fluids characteristic of alkaline rock environments. The experiments were conducted at the GFZ Helmholtz Centre for Georesearch in Potsdam, Germany under controlled conditions in the temperature range of 500–600°C and pressures of 200–400 MPa. The durations of the individual experiments ranged from 21 to 63 days, thus making it possible to observe mineral transformations on different time scales.
The main objective of the experiments was to study the stability and transformation products of Cvk-(Ce) in the presence of various hydrothermal fluids. It was also important to observe the process of rare earth element (REE) mobilization and redistribution. By subjecting Cvk-(Ce) to fluid interactions under conditions similar to those known on natural paragenesis (Macdonald et al., 2019), we were able to synthesize and identify a number of REE-containing secondary mineral phases. Among the most notable products were britholite-(Ce), fluorbritholite-(Ce), Mnz-(Ce), and minerals belonging to the epidote supergroup (ESM). In addition, other very interesting phases rich in light rare earth elements (LREE), such as gagarinite-(Ce) (Bagiński et al., 2024), turkestanite/steacyite (Stachowicz et al., 2025), and titanite, were also formed, providing valuable information on the course and mechanisms of geochemical processes governing the distribution and stability of various elements during hydrothermal alteration (Stachowicz et al., 2024).
In order to approximate the composition of the rocks in which Cvk-(Ce) is usually formed, each experimental sample consisted of different amounts of crushed Cvk-(Ce), supplemented with albite (Ab₉₉) and quartz in proportions intended to broadly simulate natural mineral associations. For variability in the results, the content of individual substrates differed in each sample; however, after averaging, the proportions of the main components – Cvk-(Ce), albite, and quartz – were approximately 3.45: 1.07: 1.00. Grain sizes ranged from 100 to 500 µm for Cvk and from 50 to 100 µm for the silicate phases. To this solid assemblage, an aqueous fluid phase containing NaF and H₂O was introduced, thereby creating a fluorine-bearing hydrothermal system conducive to enhanced elemental mobility, particularly for REE.
This ensured that the starting materials roughly reflected the mineralogical and chemical environment found in alkali-enriched granite suites, which are common hosts for REE-rich phases. In addition, a number of additional components were introduced in varying amounts in order to study the effects of varying chemical parameters on mineral transformations. Another and more detailed description of the experiments can be found in Bagiński et al. (2023) and Stachowicz et al. (2024).
2.2. Methodology
All analyses were conducted in the Laboratory of Electron Microscopy, Microanalysis, and X-Ray Diffraction, Faculty of Geology, University of Warsaw. Detailed backscattered electrons (BSE) imaging at high magnification, along with preliminary phase identification, was carried out using a ZEISS AURIGA 60 and ZEISS SIGMA VP field emission (FE) scanning electron microscopes (SEMs). Selected crystals were further analysed for chemical composition using a Cameca SX Five FE electron microprobe, which is equipped with five wavelength dispersive spectrometers with large diffraction crystals. Prior to analysis, all samples underwent a rigorous cleaning procedure to remove any surface contaminants that could interfere with the accuracy of the measurements. This process included ultrasonic cleaning in ethanol and deionized water, followed by drying in a controlled environment to prevent unwanted oxidation or surface changes. After cleaning, the samples were coated with a 20 nm thick layer of carbon using a Leica EM ACE200 carbon coating machine. This coating method provides durability under intense electron beam exposure. Quantitative chemical analyses which were performed operated at an accelerating voltage of 15 kV under standard analytical conditions. The X-ray intensities were measured using wavelength-dispersive spectrometry, with multiple spectrometers equipped with large pentaerythritol (LPET), large lithium fluoride (LLIF), and thallium acid phthalate (TAP) analysing crystals. The selection of these crystals (LPET: 2d = 8.75 Å; LLIF: 2d = 4.0267 Å; TAP: 2d = 25.745 Å) was made on the basis of the characteristic X-ray lines of the analysed elements. A comprehensive array of elements was measured, encompassing major elements (e.g. Si, Al, Ca, Mg, Fe, Na, K), high field strength elements (e.g. Zr, Nb, Ta, Hf, Ti), REEs (La, Dy), and additional trace elements (e.g. P, S, Cl, F, Pb, Th, U). Optimization of peak and background positions was conducted for each element, with counting performed in integral or differential mode, depending on the characteristics of the peak. The calibration process involved the utilization of both matrix-matched and synthetic standards. These included wollastonite (Si, Ca), orthoclase (Al, K), albite (Na), Fe₂O₃ (Fe), TiO₂ (Ti), zircon (Zr), Nb metal (Nb), UO₂ (U), ThO₂ (Th), BaSO₄ (Ba), and a suite of दुर्लभ various earth element phosphates (e.g., LaPO₄, CePO₄, NdPO₄, SmPO₄, GdPO₄, DyPO₄). The additional standards incorporated included Ca5(PO4)3F for F, ZnS for S, sodalite for Cl, and LiTaO3 for Ta. Standard compositions and calibration factors (in cps/nA) were applied to convert measured intensities into concentrations. Spectral overlap corrections were applied to account for interferences between adjacent X-ray lines (e.g. REE–REE overlaps, Pb–U, Mn–REE interferences). All measured values were standardized to the beam current (expressed as counts per second per nanoampere, cps/nA), thus ensuring consistency across analyses. As an auxiliary method, electron backscattered diffraction (EBSD) was used to investigate the degree of crystallinity of Mnz-(Ce) and the orientation of the newly formed crystals.
3. Results
A detailed analysis of the 24 experiments carried out showed that Mnz-(Ce) was formed in only 6 of them. These are CF-08, CF-12, CF-15, CF17, CF-19, and CF-24 (Table 1). Experiments with Cvk-(Ce) were conducted using a cold-seal autoclave in a high-pressure hydrothermal system in order to simulate mineral assemblages and hydrothermal fluids that are characteristic of alkaline rock environments. As described previously, the experiments were within a strictly controlled environment, encompassing a temperature range from 500 to 600°C and a pressure range from 200 to 400 MPa. The duration of the individual experiments ranged from 21 to 63 days, thus enabling the observation of mineral transformations across diverse temporal scales. In most cases, Mnz-(Ce) was observed to crystallize as small crystals (crystal size does not exceed 20 µm), growing around large, centrally located Cvk-(Ce) crystals or filling gaps within the mineral (Figure 1). Only in the case of sample CF-24 was the growth of a slightly larger Mnz-(Ce) crystal exceeding 20 microns was observed (Figure 1). The typical accompanying phase associated with Mnz are britholite-(Ce) and titanite (Table 1). The unusually small crystal size may indicate rapid nucleation and limited crystal growth, probably influenced by local saturation levels of phosphate and REEs in the hydrothermal system (Laudise & Nielsen, 1961). It should be noted that in the case of the formation of Mnz-(Ce) in the system, most of the REEs obtained from the breakup of Cvk-(Ce) were incorporated into the structure of Mnz-(Ce) (Figure 2), resulting in a small amount of other REE minerals.
Table 1
Compilation of substrates and products of experiments containing Mnz-(Ce)
| Sample (experiment number) | P (MPa) | T (°C) | Time (days) | Components/water fluid with | Products (new phases) |
|---|---|---|---|---|---|
| CF-8 | 200 | 600 | 26 | Cvk, Q, Ab, Byt, Fap, FeS2, CaCO3/NaF, H2O | Bri, Ttn, Px(NaFe), Mnz |
| CF-12 | 200 | 500 | 63 | Cvk, Q, An (glass), Ca3(PO4)2/NaF, H2O | Ab, Mnz, Pl |
| CF-15 | 200 | 550 | 84 | Cvk, Q, Ab, Ca3(PO4)2/NaF, H2O | Mnz, Bri, Px, Ab, Flr, Aes/Nar, Thr |
| CF-17 | 200 | 550 | 84 | Cvk, Q, Ab, Fap/NaF, H2O | Bri, Px, Mnz, Ab, Flr, Nar, |
| CF-19 | 200 | 600 | 42 | Cvk, Q, An (glass), Al2O3/Ca(OH)2, H2O | Pl, Bri, Ttn, Wo, Mnz, Thr* |
| CF-24 | 200 | 600 | 32 | Cvk, Q, Byt, KFs, CaF2, FeO/Ca(OH)2, Mg(OH)2, H2O | Bri, Ttn, Px, ESM, Pl, Mnz, Flr, Thr, Bt |
Abbreviations according to Warr (2021): Ab – albite, Aes – aeschynite, An – anorthite, Bri – britholite, Bt – biotite, Byt – beryllite, Cvk – chevkinite, Fap – fluorapatite, Flr – fluorite, Mnz – monazite, Nar – narsarsukite, Pl – plagioclase, Px – pyroxene, Q – quartz, Thr – thorite, Ttn – titanite, Wo – wollastonite.
*Thorite may also occur as huttonite and in amorphous forms (Bagiński et al., 2023; Stachowicz et al., 2024).
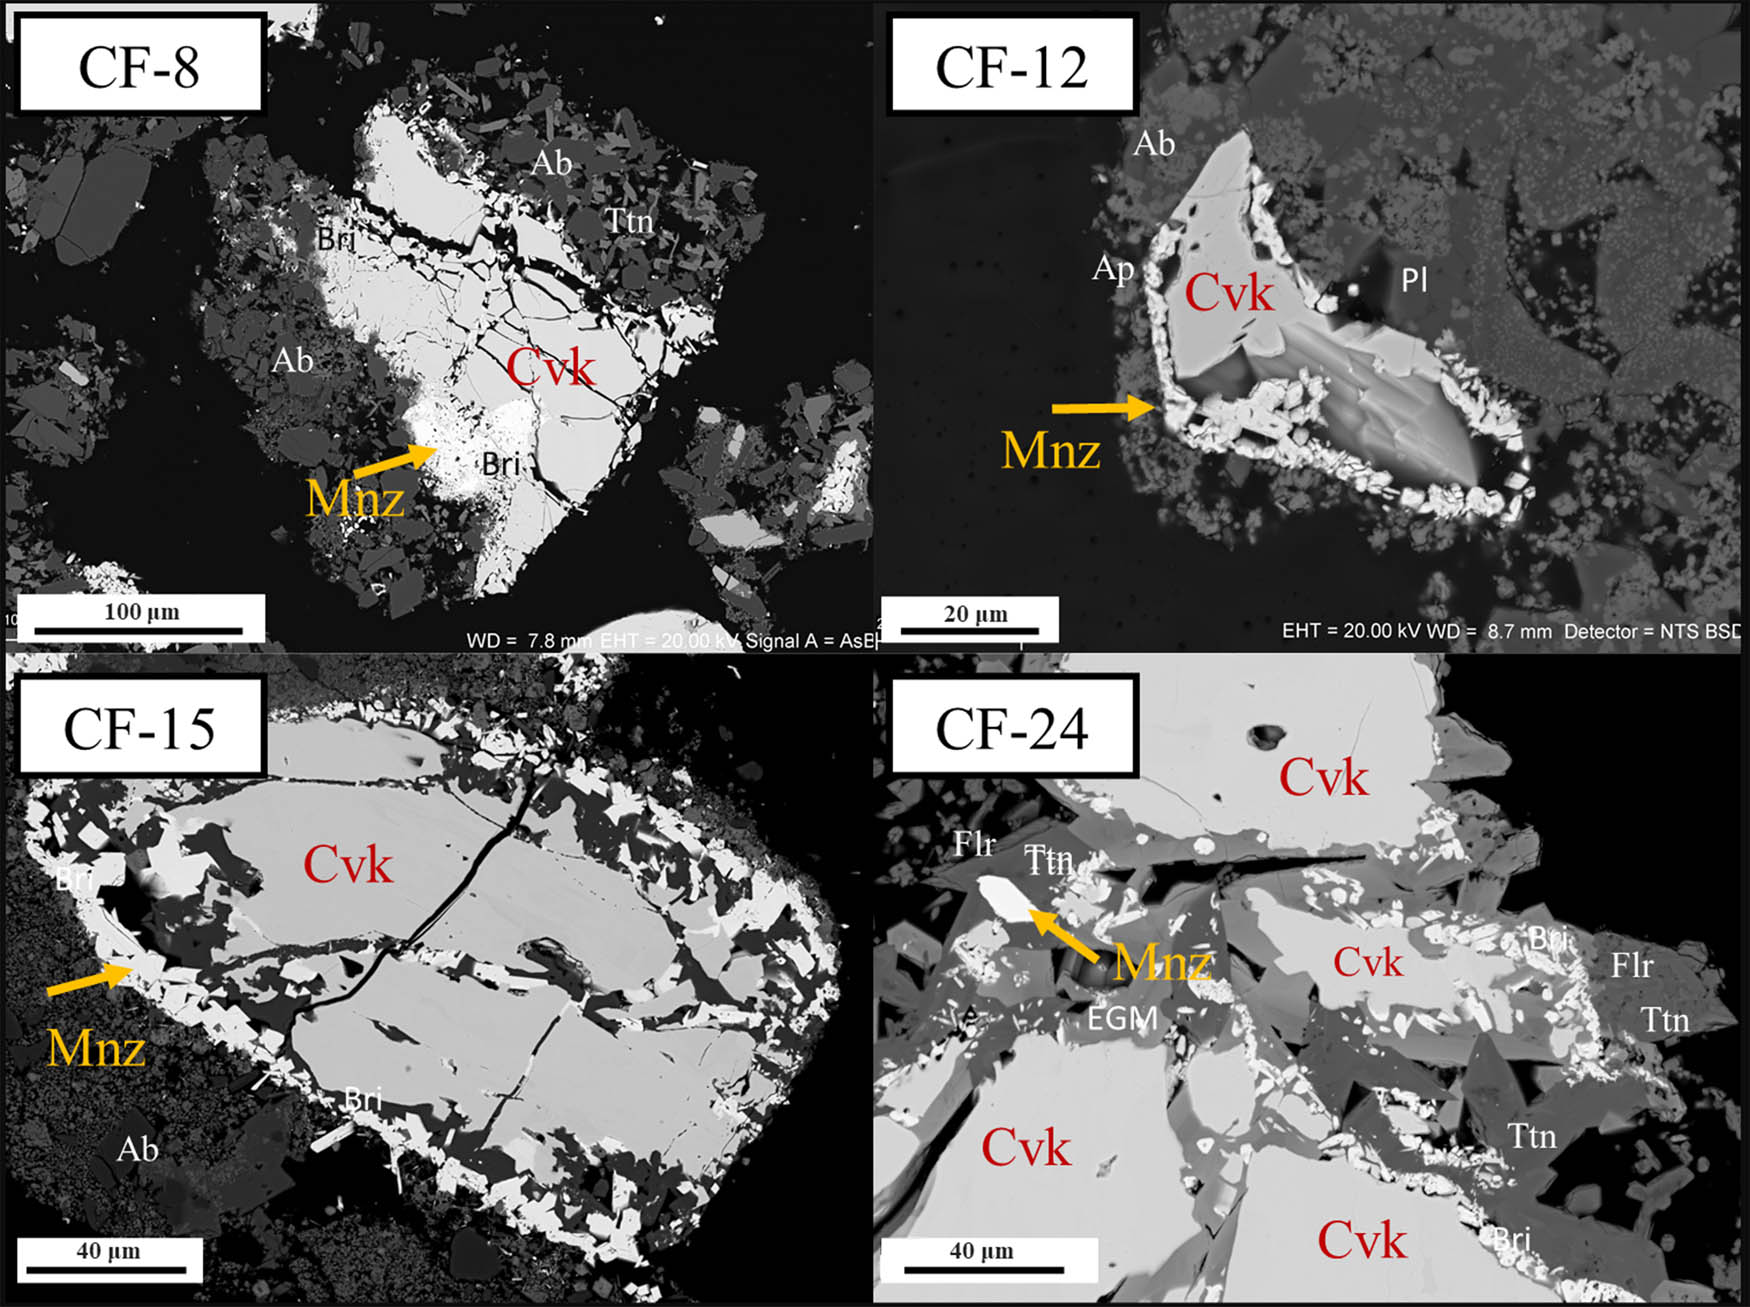
Figure 1
BSE images of Mnz-(Ce) formed as a result of Cvk-(Ce) alteration. Samples from experiments CF-08, CF-12, CF-15, and CF-24.
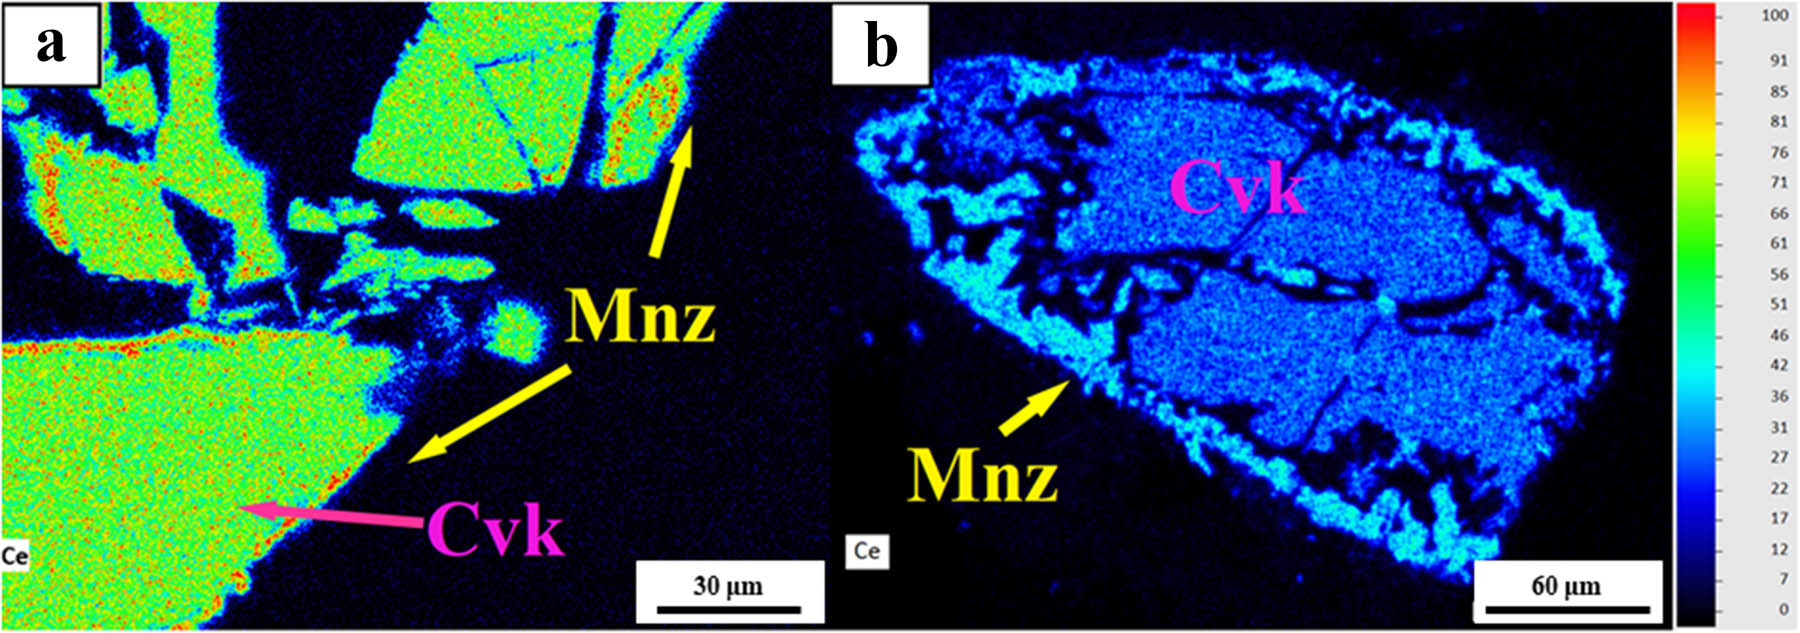
Figure 2
EDS mapping of Ce distribution in the CF-15 sample. False colours Mnz-(Ce) on the edges of the big Cvk-(Ce) crystals (yellow arrows). a) slightly altered czewkinit-(Ce) b) heavily altered czewkinit-(Ce).
As shown by EBSD analyses of samples CF-15 and CF-24, Mnz-(Ce) exhibited full crystallinity (Figure 3). However, despite the well-ordered structure of individual crystallites, no preferential arrangement of crystallites was found.
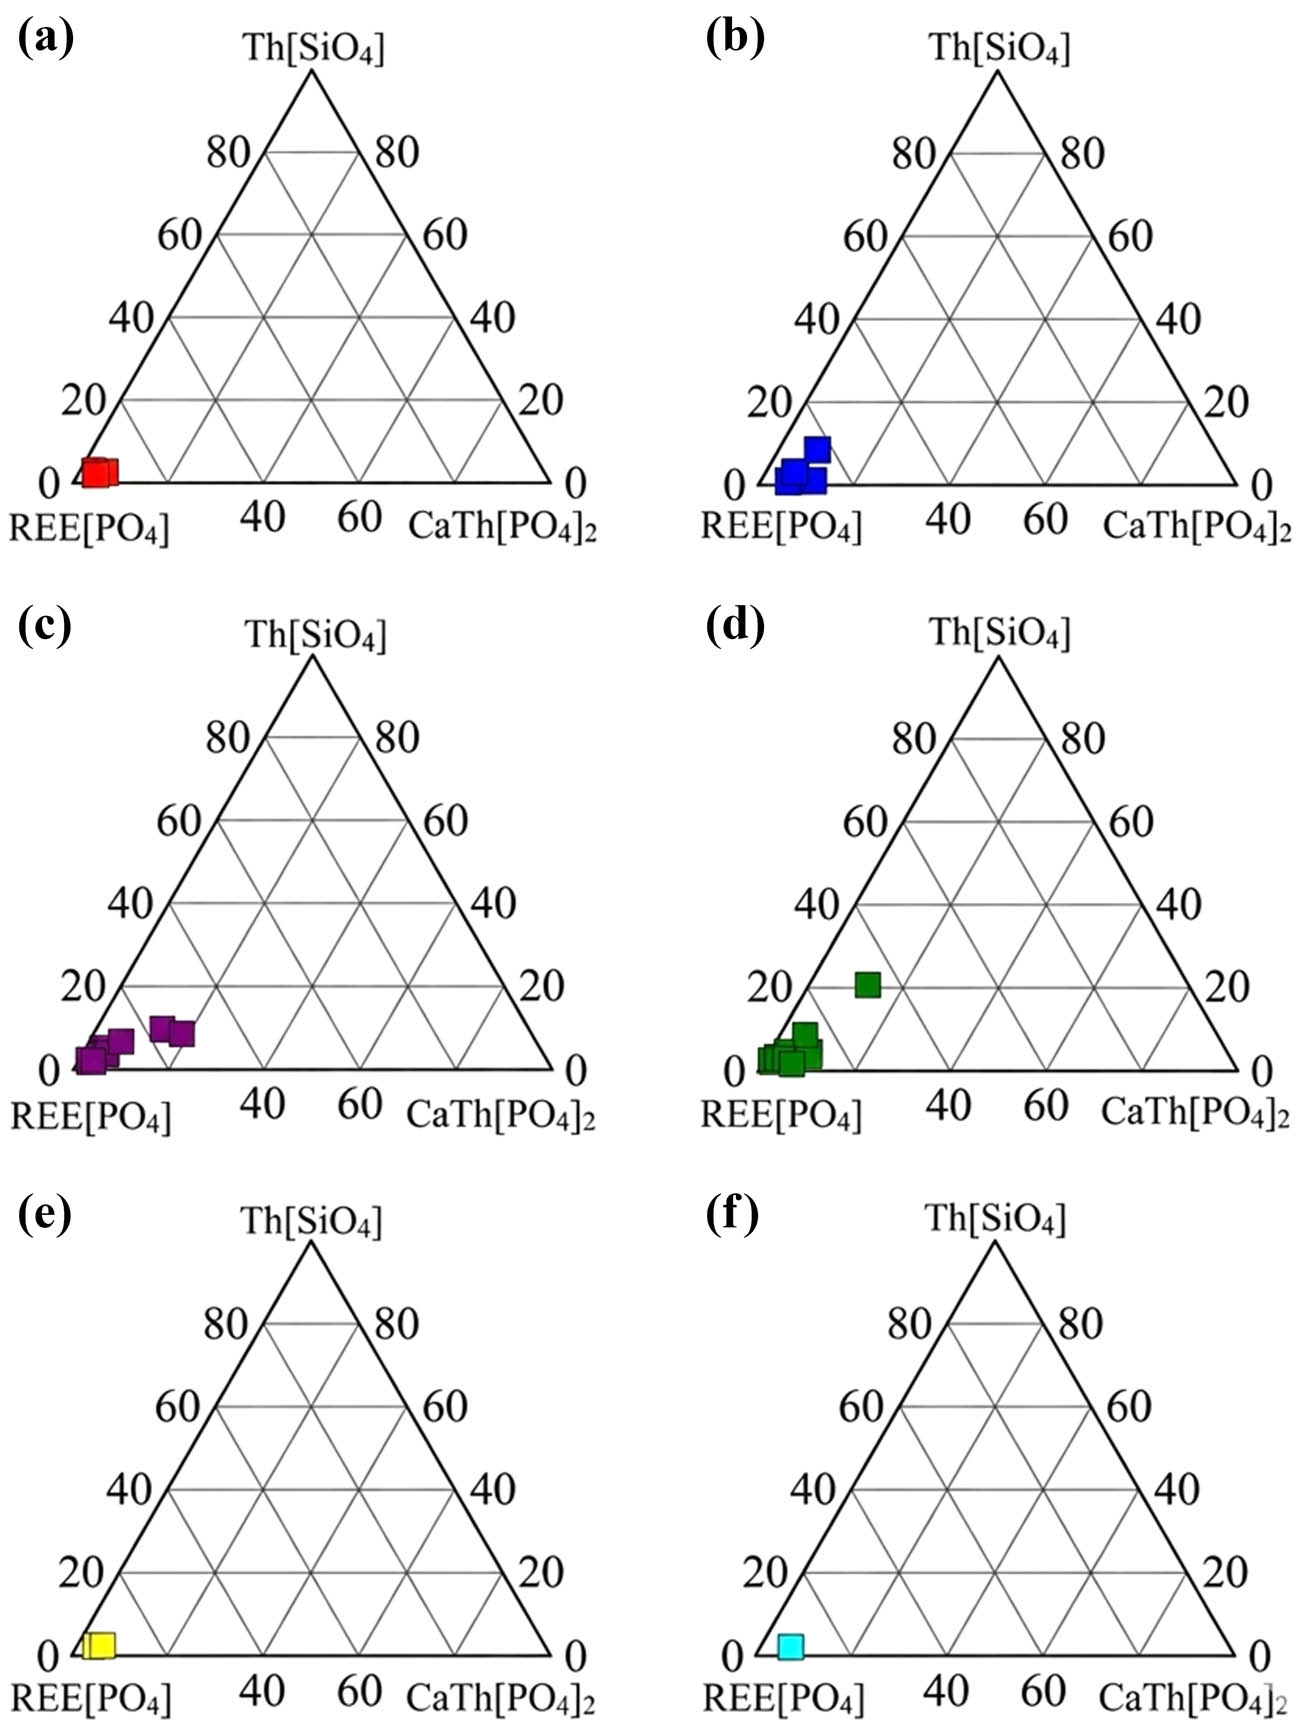
Figure 3
Triangular diagram in REEPO4-CaTh(PO4)2-ThSiO4 system showing the composition of the samples from the experiments. (a) Results of Mnz from the CF-8 analyses, (b) CF-12, (c) CF-15, (d) CF-17, (e) CF-21, and (f) CF-24.
Compiled from Linthout (2007).
In order to obtain an accurate chemical characterization and comparison of the products of different experiments, six Mnz crystals (Table 1) were selected for analysis by electron probe microanalysis (EPMA). A total of 41 chemical analyses were carried out, providing a comprehensive assessment of the compositional variability of the various Mnz grains. EPMA results confirmed that all analysed crystals were classified compositionally as Mnz-(Ce) (Table 2), with no significant deviations in chemical composition.
Table 2
EPMA analyses of Mnz-(Ce)
| CF-8-mon | CF_12_5_Mnz1 | CF_15_D_Mnz | CF_17_A_Mnz | CF19_Mnz_A1_01 | CF24_C2_Mnz | |
|---|---|---|---|---|---|---|
| SO3 | 25.84 | 28.66 | 25.48 | 23.29 | 28.58 | 27.76 |
| P2O5 | 25.84 | 28.66 | 25.48 | 23.29 | 28.58 | 27.76 |
| V2O5 | 0.05 | 0.04 | 0.07 | 0.01 | n.d. | 0.01 |
| Nb2O5 | n.d. | n.d. | n.d. | 0.01 | 0.07 | n.d. |
| Ta2O5 | 0.13 | n.d. | 0.04 | 0.09 | n.d. | 0.18 |
| SIO2 | 1.38 | 0.94 | 3.67 | 4.61 | 1.04 | 1.05 |
| TiO2 | 0.06 | 0.58 | 0.17 | 3.16 | 0.11 | 0.30 |
| ZrO2 | 0.07 | 0.10 | 0.09 | 0.15 | 0.22 | 0.11 |
| HfO2 | 0.10 | 0.01 | n.d. | n.d. | 0.15 | n.d. |
| ThO2 | 1.95 | 1.17 | 4.78 | 2.68 | 1.09 | 1.05 |
| UO2 | 0.02 | 0.05 | 0.01 | 0.10 | 0.05 | n.d. |
| Sc2O3 | 0.02 | 0.02 | 0.03 | 0.02 | 0.01 | 0.04 |
| Cr2O3 | n.d. | 0.03 | n.d. | 0.01 | n.d. | n.d. |
| As2O3 | 0.07 | 0.01 | n.d. | 0.07 | 0.03 | 0.06 |
| Y2O3 | 0.07 | 0.03 | 0.01 | n.d. | 0.01 | 0.02 |
| La2O3 | 17.54 | 15.22 | 19.11 | 17.91 | 15.23 | 16.11 |
| Ce2O3 | 34.60 | 33.99 | 33.45 | 32.48 | 35.19 | 34.18 |
| Pr2O3 | 3.58 | 3.26 | 2.92 | 2.93 | 4.06 | 3.48 |
| Nd2O3 | 10.07 | 11.33 | 8.10 | 9.16 | 11.06 | 10.80 |
| Sm2O3 | 0.85 | 1.08 | 0.49 | 0.56 | 0.84 | 0.88 |
| Eu2O3 | 0.23 | 0.41 | 0.12 | n.d. | 0.05 | 0.14 |
| Gd2O3 | 0.38 | 0.26 | 0.34 | 0.02 | 0.38 | 0.38 |
| MgO | 0.06 | 0.10 | 0.03 | 0.01 | 0.09 | 0.02 |
| CaO | 0.42 | 0.62 | 0.13 | 0.30 | 0.39 | 0.83 |
| MnO | n.d. | 0.06 | n.d. | 0.07 | n.d. | n.d. |
| FeO* | 0.06 | 0.26 | 0.06 | 1.47 | n.d. | 0.33 |
| SrO | 0.04 | n.d. | n.d. | 0.01 | 0.24 | 0.16 |
| BaO | 0.02 | 0.09 | 0.07 | 0.05 | 0.19 | n.d. |
| PbO | n.d. | n.d. | n.d. | n.d. | n.d. | n.d. |
| Na2O | 0.03 | 0.05 | 0.03 | 0.08 | n.d. | 0.04 |
| K2O | 0.01 | n.d. | n.d. | n.d. | 0.01 | 0.01 |
| Cl | n.d. | 0.01 | n.d. | n.d. | 0.01 | n.d. |
| O═Fl | — | — | — | — | — | — |
| Σ | 98.31 | 98.38 | 99.23 | 99.24 | 99.74 | 98.67 |
| S6+ | 0.12 | n.d. | n.d. | n.d. | 0.11 | 0.11 |
| P5+ | 2.24 | 2.40 | 2.16 | 1.95 | 2.37 | 2.33 |
| SI2+ | 0.06 | 0.04 | 0.15 | 0.18 | 0.04 | 0.04 |
| Ti4+ | n.d. | 0.02 | 0.01 | 0.09 | n.d. | 0.01 |
| U2+ | 0.02 | 0.01 | 0.04 | 0.02 | 0.01 | 0.01 |
| Ce3+ | 0.27 | 0.22 | 0.28 | 0.26 | 0.22 | 0.24 |
| Pe3+ | 0.52 | 0.49 | 0.49 | 0.47 | 0.50 | 0.50 |
| Nd3+ | 0.05 | 0.05 | 0.04 | 0.04 | 0.06 | 0.05 |
| Sm3+ | 0.15 | 0.16 | 0.12 | 0.13 | 0.15 | 0.15 |
| Eu3+ | 0.01 | 0.01 | 0.01 | 0.01 | 0.01 | 0.01 |
| Gd3+ | n.d. | 0.01 | n.d. | n.d. | n.d. | n.d. |
| Ca3+ | n.d. | 0.01 | n.d. | n.d. | 0.01 | n.d. |
| Mn3+ | 0.02 | 0.03 | 0.01 | 0.01 | 0.02 | 0.04 |
| Sr2+ | n.d. | 0.01 | n.d. | 0.05 | n.d. | 0.01 |
| Ba2+ | n.d. | n.d. | n.d. | n.d. | 0.01 | n.d. |
| K+ | n.d. | n.d. | n.d. | 0.01 | n.d. | n.d. |
| Σ | 3.42 | 3.45 | 3.42 | 3.33 | 3.45 | 3.45 |
* - indicates the presence of iron in both the +2 and +3 oxidation states (Fe2+ and Fe3+).
Based on calculations obtained from EMPA data, it was determined that the phosphate component in the Mnz accounted for an average of 97.69 wt%, while the silicate component was an average of 2.31 wt%. This suggests that arsenic did not play a significant role in the structure of Mnz under the given experimental conditions, due to its lack of availability in both Cvk-(Ce) and the products used in the experiments. Occasionally, as can be seen in the graphs, thorium was determined, but this was not a significant amount in the overall pattern of composition. The only exception to this general observation occurred in the analysis of Mnz-(Ce) crystals from sample CF-17. In this case, the crystals were so small that the elevated concentrations of Ti and Si (Table 2) may come from ilmenite nano-inclusions not visible under SEM. All Mnz analyses were plotted on a Mnz-huttonite-cheralite diagram (Linthout, 2007).
4. Discussion
The complex compositional evolution of CGMs commences during the early magmatic crystallization stage and may persist through to late- and post-magmatic processes. This evolution exerts a significant influence on the compositions observed in accessory phases within granitic rocks. Evidence from electron microprobe analyses demonstrates that even in primary magmatic environments, CGMs are not compositionally uniform. Intra-crystalline variations, including patchy zoning and element redistribution, indicate that chemical heterogeneity develops during crystallization. These variations can be explained by exchange mechanisms, reflecting changing physicochemical conditions during crystal growth. Data from rapidly quenched volcanic equivalents further support the interpretation that such heterogeneity is, at least in part, a primary feature of magmatic crystallization rather than solely a product of later alteration (Macdonald & Belkin, 2002).
However, the final composition of Cvk in granitic systems is rarely the result of magmatic processes alone. It is further noted that late-magmatic and metasomatic environments may induce additional modifications, particularly in systems influenced by fluid activity. Moreover, hydrothermal alteration has been shown to produce pronounced compositional changes, including depletion in LREEs and Fe, alongside enrichment in Ca, Ti, Th, U, and Nb, and reduced cation totals indicative of structural modification or partial recrystallization. The development of alteration rims and chemically distinct zones within individual grains suggests fluid-mediated element mobility and replacement processes. The graphical representation of the data reveals that in all cases, the analysed samples closely matched nearly end-member compositions of Mnz-(Ce) (Figure 4). This confirms that under the experimental conditions used in this study, Mnz-(Ce) crystallized as a chemically homogeneous phase with limited substitution by elements such as thorium or silicon due to the fact that the Cvk contains limited amounts of Th. The obtained results contribute to a broader understanding of the crystallization behaviour of Mnz-(Ce) under experimental hydrothermal conditions and provide insight into its thermodynamic stability and compositional variability. The results also underscore the importance of microcrystal size studies using EPMA, as the extremely fine phases of Mnz may require specialized approaches to ensure accurate chemical characterization. Particular note is the fact that in five of the six experiments in which Mnz-(Ce) was identified, no ESMs were observed. This suggests a potentially inverse relationship between the crystallization of Mnz-(Ce) and the stability of ESMs under certain experimental conditions. The absence of ESM in these samples suggests that a geochemical environment that favours the crystallization of Mnz-(Ce) is not conducive to the formation of the epidote group minerals, due to the composition of the fluid or the limited availability of essential cations such as Ca, Si, and Al. Alternatively, the presence of Mnz-(Ce) may inhibit the formation of the ESM through competitive elemental partitioning, in which the REEs preferentially partition into Mnz rather than become building blocks for the epidote group phases.
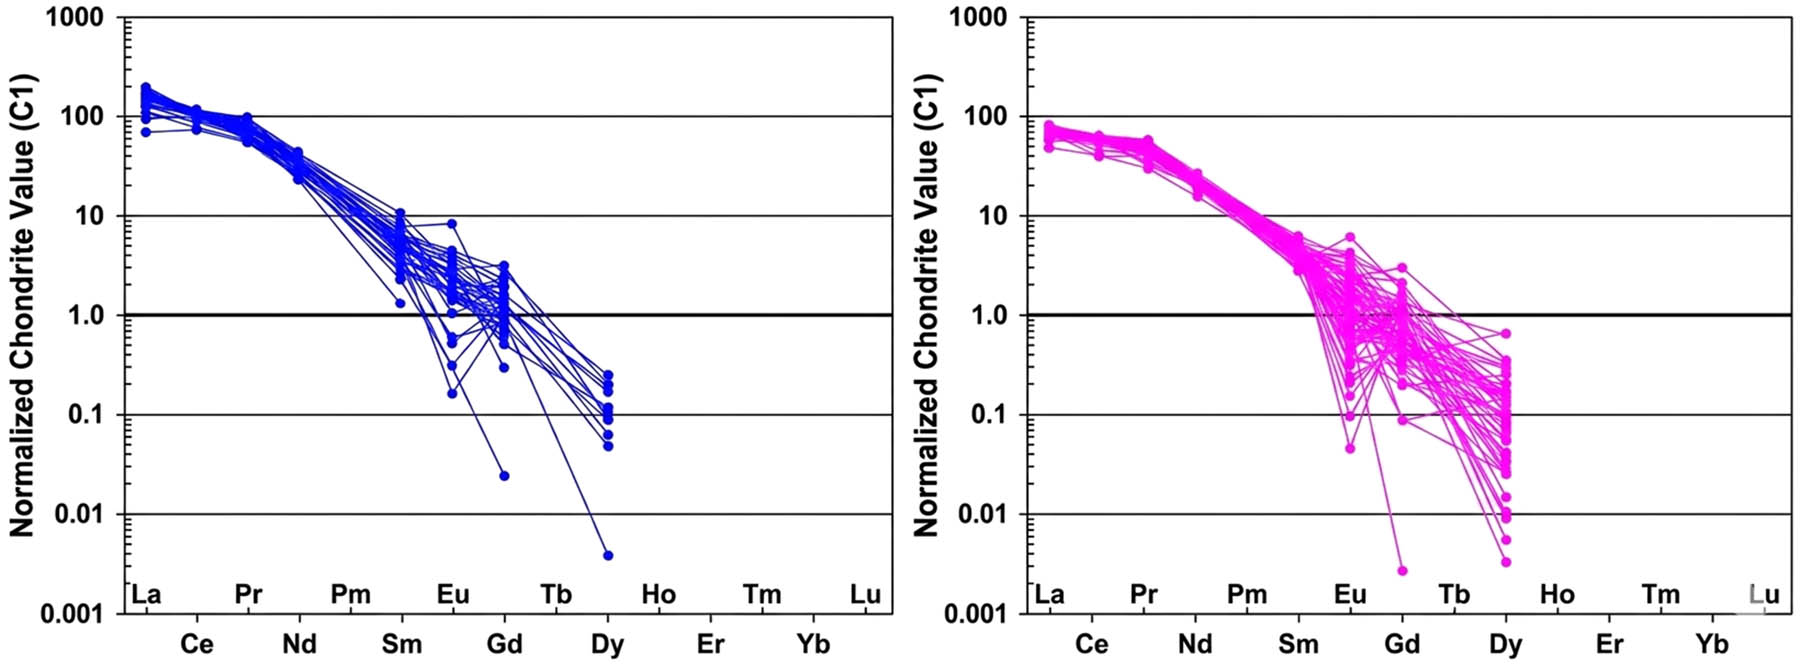
Figure 4
Normalization of REE concentration to chondrite (Nakamura, 1974) for all Cvk-(Ce) (left diagram) and Mnz-(Ce) (right diagram) analyses derived from experiments. Performed using GCDkit 6.2 (Janoušek et al., 2006).
However, this is inconsistent with previous observations from the natural environments in which epidote group minerals (in particular, allanite) were the products of metasomatic alteration of Cvk-(Ce) (e.g. Bagiński et al., 2015, Macdonald et al., 2019). Regarding the transport and redistribution of REEs during the transformation of Cvk-(Ce) to Mnz (Ce), it is significant to note that no REE fractionation was observed in this process (almost identical in appearance of both diagrams in Figure 5). This suggests that all LREEs were incorporated, in approximately equal proportions, from the precursor mineral into the newly formed Mnz-(Ce), without preferential enrichment or depletion of any of them. The lack of LREE fractionation can be attributed to the fact that the experimental system is effectively closed, thus preventing large-scale differentiation in elements that could occur in open-system environments with differential fluid migration.
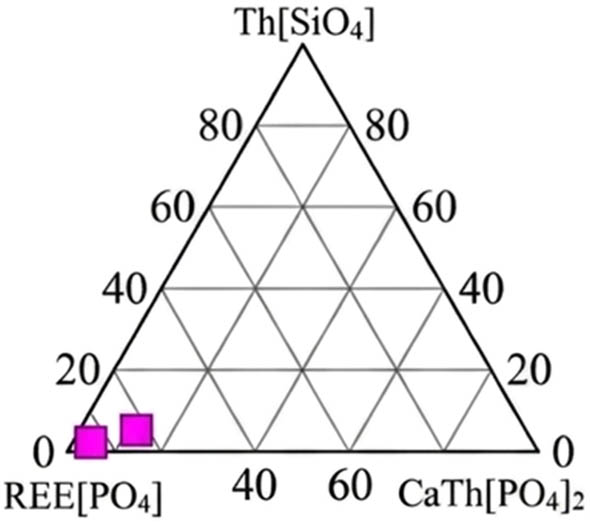
Figure 5
Triangular diagram in the REEPO4-CaTh(PO4)2-ThSiO4 system, showing samples from Saveleva and Karmanov (2008).
Compiled by the authors based on Linthout (2007).
In the data presented, and as natural systems show, it is clear that phosphorus and the presence of a F-rich environment are necessary for the formation of Mnz-(Ce). Of course, not all systems are equivalent, and the presence of P and F alone does not guarantee the formation of Mnz-(Ce). For example, in experiment CF-6 (Table 3), the components contain a F-rich mineral, namely, fluorapatite. However, Mnz-(Ce) was not produced in this experiment. In the similar CF-8 experiment, Mnz-(Ce) was observed, but in this case the environment was enriched in F by adding NaF. A deviation from this rule, that the presence of F and phosphorus determine the formation of Mnz-(Ce), is also evident in experiment CF-11 (Table 3). The fundamental difference between CF-11 and CF-12 (which is rich in Mnz-(Ce)) is that in CF-11, F in the form of CaF2 was used in the experiment, while in CF-12, it is NaF. It is also worth noting that the CF-11 system contains large amounts of Ca. Based on the analysis of the collected data, we can make the following correlations:
Table 3
A list of components and products from other experiments similar to those involving Mnz-(Ce) but not producing Mnz-(Ce)
| Sample | P (MPa) | T (°C) | Time (days) | Components/water fluid with | Products |
|---|---|---|---|---|---|
| CF-6 | 200 | 600 | 26 | Cvk, Q, Ab, Byt, Fap, FeS2, CaCO3 | Bri, Ttn, Wo, Ab, Thr*, Ap |
| Ca(OH)2, H2O | |||||
| CF-11 | 200 | 500 | 63 | Cvk, Q, An (glass), Ca3(PO4)2 | ESM, Bri, |
| Ca(OH)2, CaF2, H2O |
*Thorite may also occur as huttonite and in amorphous forms (Bagiński et al, 2023; Stachowicz et al, 2024). Abbreviations according to Warr (2021). Abbreviations according to Warr (2021): Ab – albite, An – anorthite, Bri – britholite, Bt – biotite, Byt – beryllite, Cvk – chevkinite, ESM – epidote supergroup minerals Fap – fluorapatite, Flr – fluorite, Q – quartz, Thr – thorite, Ttn – titanite, Wo – wollastonite.
High Ca content in the system → ESM and britholite-(Ce) are formed.
Low Ca content in the system → albite and Mnz-(Ce) are formed.
The only exception is the sample from the CF-24 experiment, where the Ca concentration is relatively high, yet Mnz-(Ce) remains stable. A multitude of examples can be sourced from natural environments. In the case of caprocks, such as metapelites, Mnz is the dominant host phase for REEs. Conversely, in ca-rich rocks, typical of tonalite and granodiorite protoliths, allanite is the main stable phase. However, the role of calcium content alone does not fully explain the observed relationships; water activity also plays a key role (Berger et al., 2009).
In conditions of elevated H2O activity, a hallmark of fluid-induced melting, allanite undergoes transformation into Mnz, a process concomitant with the recrystallization of accessory phases. In environments characterized by moderate water activity, allanite exhibits stability, while under conditions of low H2O activity, which are typical of dehydration melting, Mnz stabilizes. This suggests that Mnz is preferentially present in arid environments, while allanite is stabilized by the presence of water.
It is important to emphasize the unique nature of Mnz-(Ce) formation among the products from the Cvk-(Ce) experiment. Such phenomena are rare, and under conditions similar to those used in the experiment, they are rarely documented in the literature. An exception is the publication (Saveleva & Karmanov, 2008) on the Sayan Fault formation in Russia. This location is characterized by a similar mineral composition of rocks subjected to metasomatic processes. In petrographic terms, altered rocks are granite gneisses, which largely correspond to our main experimental components: quartz + albite + microcline + Cvk-(Ce). Importantly, both the experimentally obtained Mnz-(Ce) and the naturally occurring Mnz-(Ce) described in the cited publication have a similar composition. In both cases, the SiO2 content in the Mnz does not exceed 2 wt% (refer Table 2 and Saveleva & Karmanov, 2008). Mnz from the Sayan Fault region appears in a similar manner to that obtained in experiments, crystallizing in direct contact with Cvk-(Ce). The most significant discrepancy between experimental and natural observations concerns the composition of Cvk-(Ce). In this study, the Cvk-(Ce) crystal from Pakistan shows a negligible phosphorus content, while in the samples analysed by Saveleva and Karmanova, the P₂O₅ concentration reaches 3–4 wt%. This observation confirms the conclusions drawn by the cited authors that, under natural conditions, the phosphorus necessary for the formation of Mnz comes from both Cvk-(Ce) and external sources. In contrast, in our experimental setup, phosphorus comes exclusively from other phosphate phases.
ESM minerals, including allanite-(Ce) and ferriallanite-(Ce), are distinguished by a crystal structure wherein Ca is one of the primary cations that occupy structural positions, particularly the A position. Analyses indicate that their crystallization occurs under conditions of increased Ca availability in the system. Concurrently, these minerals effectively incorporate REE released during the decomposition of Cvk-(Ce). This process indicates that Ca plays a dual role: it stabilizes the structure of the forming minerals and enables REE binding in new phases. Consequently, Ca-rich environments favour the formation of allanite and other ESM minerals as the primary REE carriers.
Mnz-(Ce) exhibits distinct characteristics, being an anhydrous REE phosphate that does not necessitate calcium as a substantial structural component. The formation of this mineral is primarily related to the availability of phosphorus and the mobility of REEs released from Cvk-(Ce). In the analysed experiments, Mnz frequently manifests as rims around Cvk relics or as independent crystals in their vicinity, clearly indicating REE migration and secondary crystallization. In conditions where Ca is not the predominant REE binding factor (or when phosphate phases compete), REE exhibits a marked preference for the formation of Mnz.
It can be concluded from the above observations that the calcium (Ca) content is one of the key factors controlling the partitioning of REE between different secondary phases. The hypothesis that high Ca availability leads to the stabilization of ESM minerals and the promotion of REE incorporation into their structures is one that merits further investigation. However, under conditions of relatively lower Ca or increased phosphorus availability, REEs are preferentially bound in the Mnz-(Ce) structure.
In the experiments covered in this study, the role of F, derived from fluorapatite or from CaF2 or NaF in solution, seems particularly important. It most likely contributed to the stimulation of growth not only of Mnz-(Ce), but also of britholite-(Ce), which in the experiments conducted (Table 1) was a mandatory crystallizing phase (the only exception being sample CF-12).
On the other hand, when considering the distribution of REEs, the absence of allanite in the products from these experiments is rather unexpected (refer examples from nature in Bagiński et al., 2015; Macdonald et al., 2019). It appears only in the CF-11 experiment, where the appearance of epidote supergroup minerals (EGM) was probably favoured by a large excess of Ca, which was pointed out by Budzyń et al. (2011) when describing the experimental metasomatic alteration of Mnz.
The above observations confirm that F easily mobilizes REE in low- to medium-temperature hydrothermal processes (Yongliang & Yusheng, 1991). Although it is known that high pressure promotes the mobility of complex F and REE compounds, even without its influence, F can mobilize the transport of REEs in hydrothermal systems, as confirmed by experimental results (Yongliang & Yusheng, 1991).
5. Conclusion
The fairly common presence of Mnz-(Ce) among the products of hydrothermal transformations of Cvk-(Ce) in the experiments conducted was quite surprising, but it should be considered as consistent with natural processes. It allowed for the formulation of interesting conclusions based on observations of reactions under natural and experimental conditions.
(1) The formation of Mnz-(Ce) as a product of hydrothermal transformations requires the presence of large amounts of P and F in the system. An excess of phosphorus and F in the substrates caused the appearance of Mnz-(Ce) in the product in relatively large quantities.
(2) A very important factor influencing the formation of Mnz-(Ce) is the concentration of Ca. The lower the Ca content, the greater the likelihood of Mnz formation.
(3) Low concentrations of Fe and Al in the hydrothermal system also have a positive effect on the formation of Mnz-(Ce) due to the lack of ferriallanite-(Ce) crystallization, which causes the incorporation of REE into phosphate structures.
Acknowledgments
We would like to express our sincere gratitude to the Reviewers for the time and effort devoted to evaluating our manuscript. We highly appreciate their insightful comments and constructive suggestions, which significantly contributed for improving the quality and clarity of the paper.
Author contributions
Kacper M. Urbanik – Writing – Original Draft, Visualization, Investigation, Analysis; Bogusław Bagiński – Writing – Review & Editing, Analysis, Validation; Daniel E. Harlov – Writing – Review & Editing, Validation; Ray Macdonlad – Writing – Review & Editing, Validation; Marcin Stachowicz – Writing – Review & Editing, Validation.
Conflict of interest statement
Authors state no conflict of interest.