![New synthetic [LREE (LREE = La, Ce, Pr, Sm), Pb]-phosphate phases Cover](https://paradigm-files.s3.eu-central-1.amazonaws.com/MIPO/cover-image.jpg)
Table 1.
Composition of the solutions used for the syntheses.
| Phase | Solution 1 | Solution 2 | ||||
|---|---|---|---|---|---|---|
| PO43- [mol/L] | Sm3+ [mol/L] | La3+ [mol/L] | Ce3+ [mol/L] | Pr3+ [mol/L] | Pb2+ [mol/L] | |
| La-P | 0.045 | – | 0.045 | – | – | – |
| LaPb-P | 0.045 | – | 0.045 | – | – | 0.045 |
| Sm-P | 0.044 | 0.044 | – | – | – | – |
| SmPb-P | 0.044 | 0.044 | – | – | – | 0.044 |
| Ce-P | 0.320 | – | – | 0.320 | – | – |
| CePb-P | 0.320 | – | – | 0.320 | – | 0.320 |
| Pr-P | 0.320 | – | – | – | 0.320 | – |
| PrPb-P | 0.320 | – | – | – | 0.320 | 0.320 |
| Pb-P | 0.044 | – | – | – | – | 0.044 |
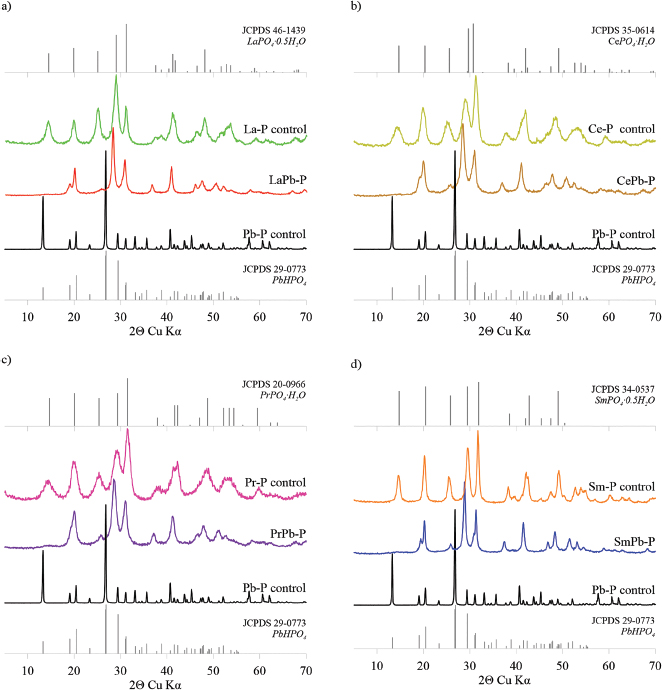
Figure 1.
Comparison of PXRD patterns for products of the syntheses: a) LaPb-P and control samples (La-P and Pb-P); b) CePb-P and control samples (Ce-P and Pb-P); c) PrPb-P and control samples (Pr-P and Pb-P); d) SmPb-P and control samples (Sm-P and Pb-P). Samples with La or Sm were synthesized at pH=2 while samples containing Ce or Pr were synthesized at pH=3.
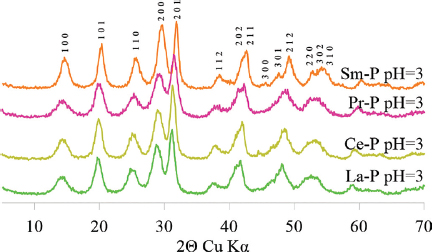
Figure 2.
Comparison of PXRD patterns of (LREE)PO4·0.66H2O (LREE = La, Ce, Pr, Sm) synthesized at pH=3. Miller indices above peaks indicate structure identical with monoclinic rhabdophane. Slight shift of peak position results from decreasing ionic radius of lanthanides.
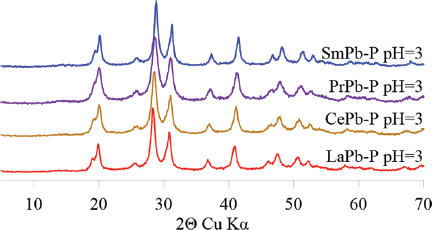
Figure 3.
Comparison of PXRD patterns of (LREE,Pb)-phosphates synthesized at pH=3 indicating identical structure and shift resulting from decreasing ionic radius of lanthanides.
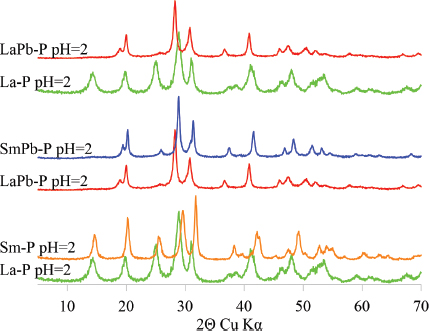
Figure 4.
Superimposed diffraction patterns of selected synthesis products showing the differences or similarities of the structures of the resulting products and systematic shifts due to the different ionic radius of La and Sm.
Table 2.
Calculated unit cell parameters of (LREE,Pb)-phosphates in orthorhombic system.
| Phase | a | b | c | α = ß = γ | V |
|---|---|---|---|---|---|
| [Å] | [Å3] | ||||
| LaPb-P | 4.62 | 5.76 | 7.01 | 186.36 | |
| CePb-P | 4.60 | 5.72 | 6.98 | 90° | 183.66 |
| PrPb-P | 4.56 | 4.68 | 6.94 | 179.80 | |
| SmPb-P | 4.52 | 5.65 | 6.89 | 175.97 |
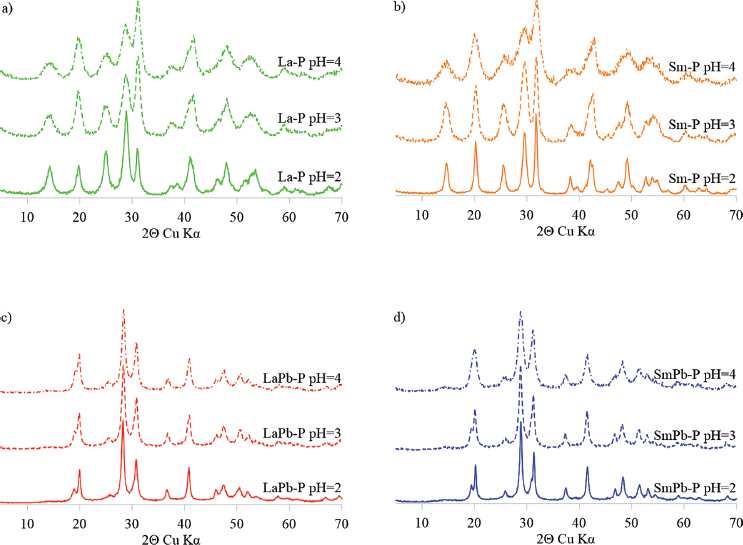
Figure 5.
Comparison of diffraction patterns of La and Sm products synthesized at various pH, in the absence (a and b) or in the presence of Pb (c and d). Peak broadening with increasing pH is apparent in all cases.
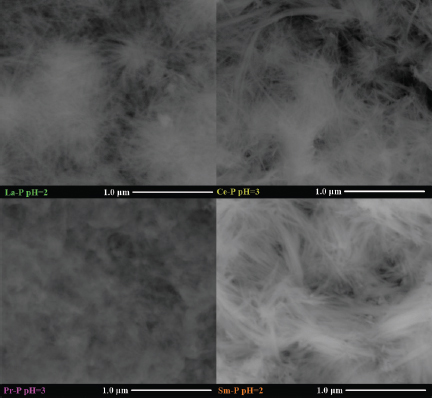
Figure 6.
SEM (BSE) images of LREE-phosphates (rhabdophanes) synthesized at pH=2 or 3 in the absence of Pb.
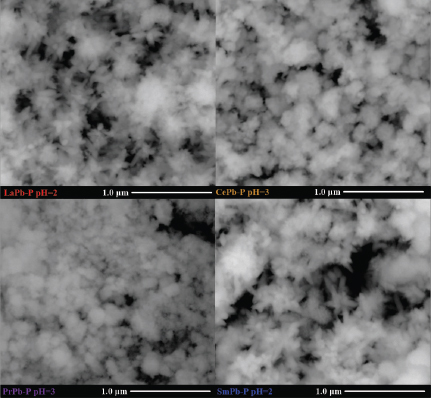
Figure 7.
SEM (BSE) images of (LREE,Pb)-phosphates synthesized at pH=2 or 3 in the presence of Pb.
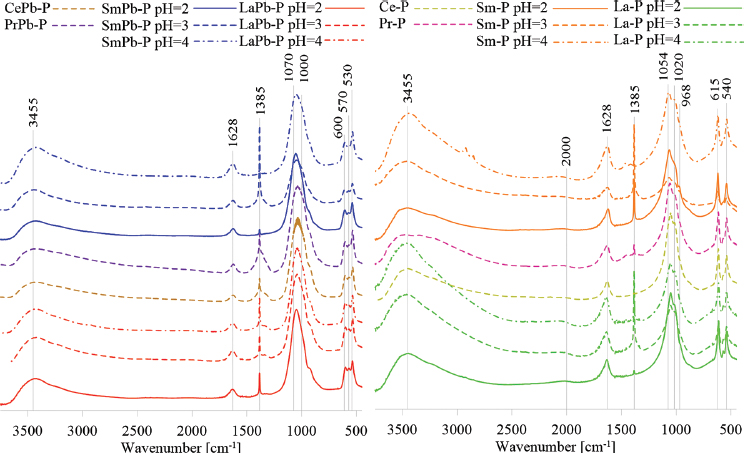
Figure 8.
Comparison of FTIR spectra of LREE phosphates containing Pb (left) and Pb-free control phases (LREE rhabdophanes, right) precipitated at various pH.
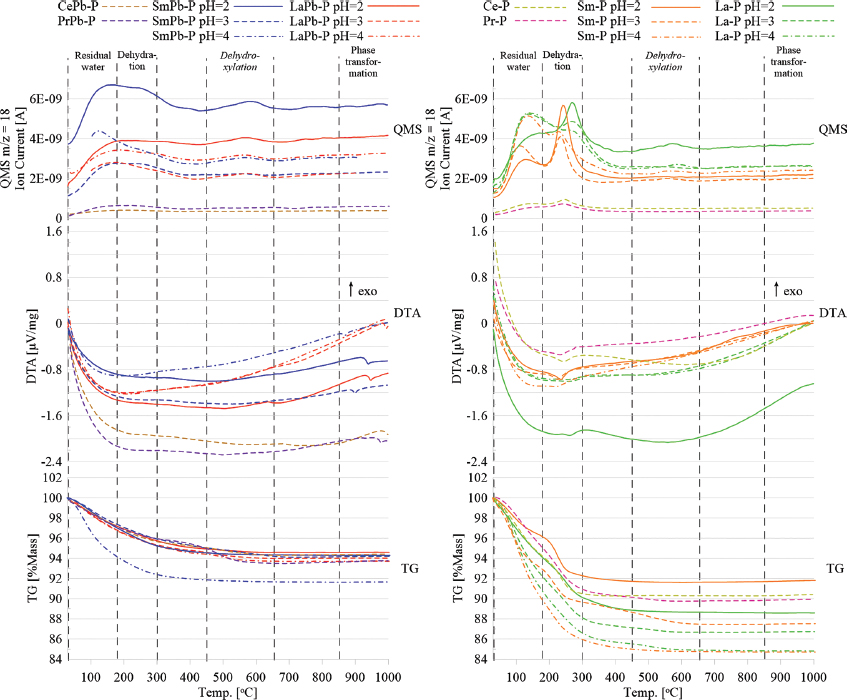
Figure 9.
Comparison of TG, DTA and QMS m/z = 18 plots for Pb-rich (left) and Pb-free (right) LREE phosphates precipitated at various pH.