
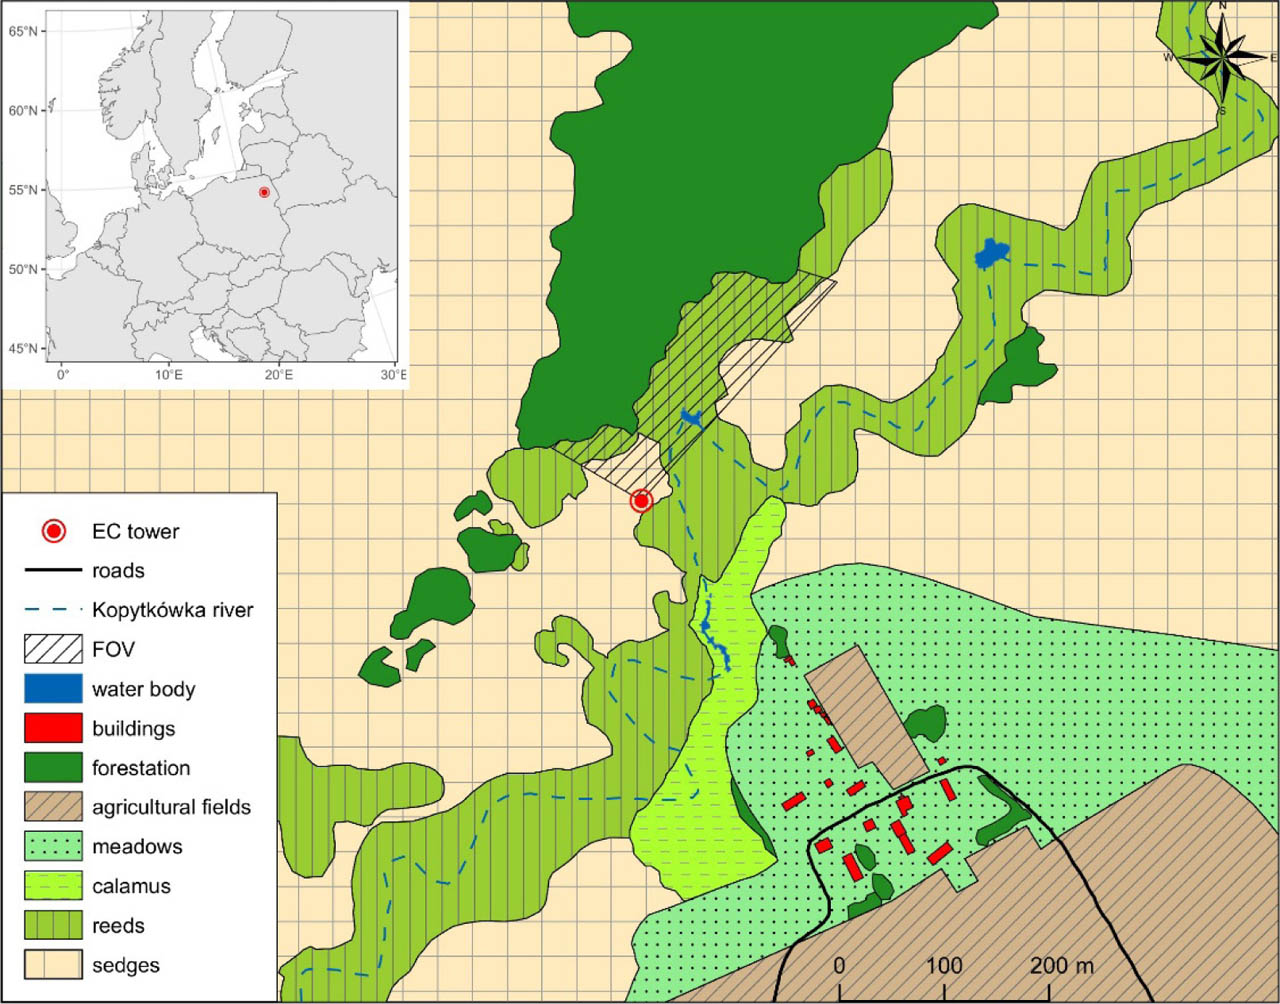
Figure 1.
Measurement site location with a sketch of land use. Hatched black lines represent camera's field of view (FOV) Source: own elaboration based on rnaturalearth (Massicotte & South 2023) and Polish National Geoportal data (Head Office of Geodesy and Cartography 2024)
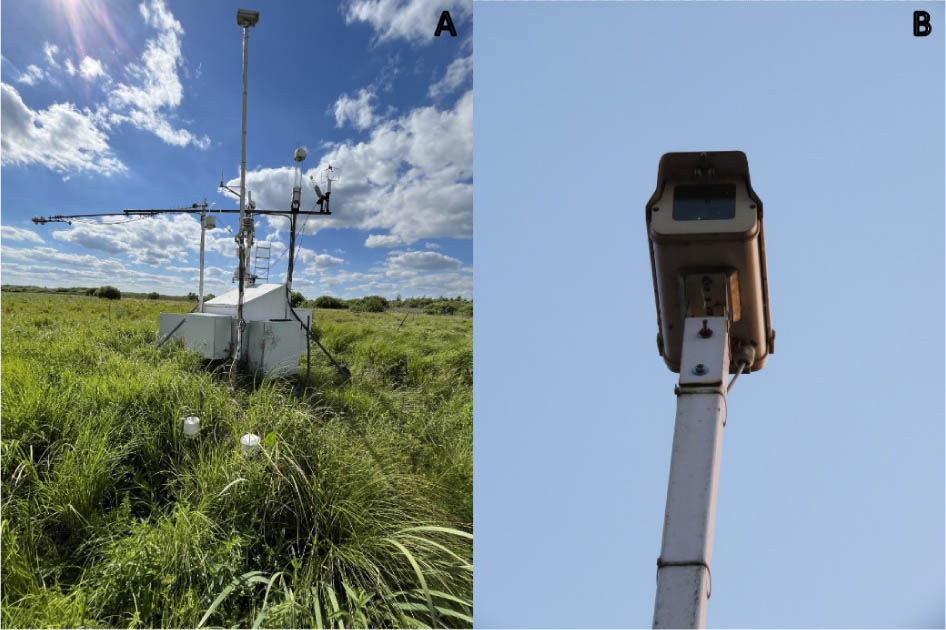
Figure 2.
Measurement site: A – eddy covariance tower, B – Star-Dot NetCam SC phenocamera
Source: Photo taken by author
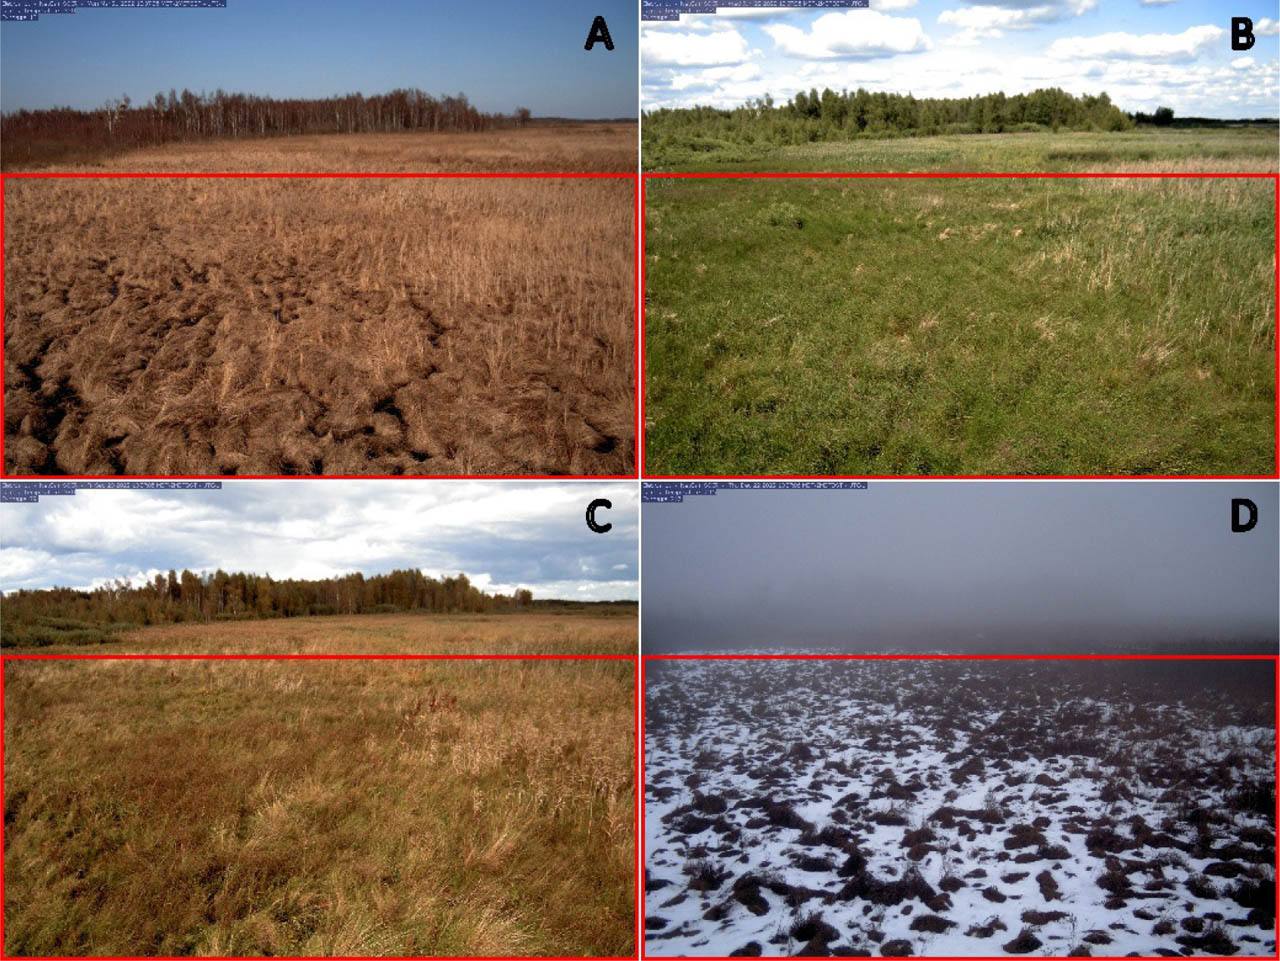
Figure 3.
Sample camera frames from different seasons: A – spring (21.03.2022), B – summer (22.06.2022), C – autumn (23.09.2022), D – winter (22.12.2022); selected ROI outlined in red
Source: Photo taken by author
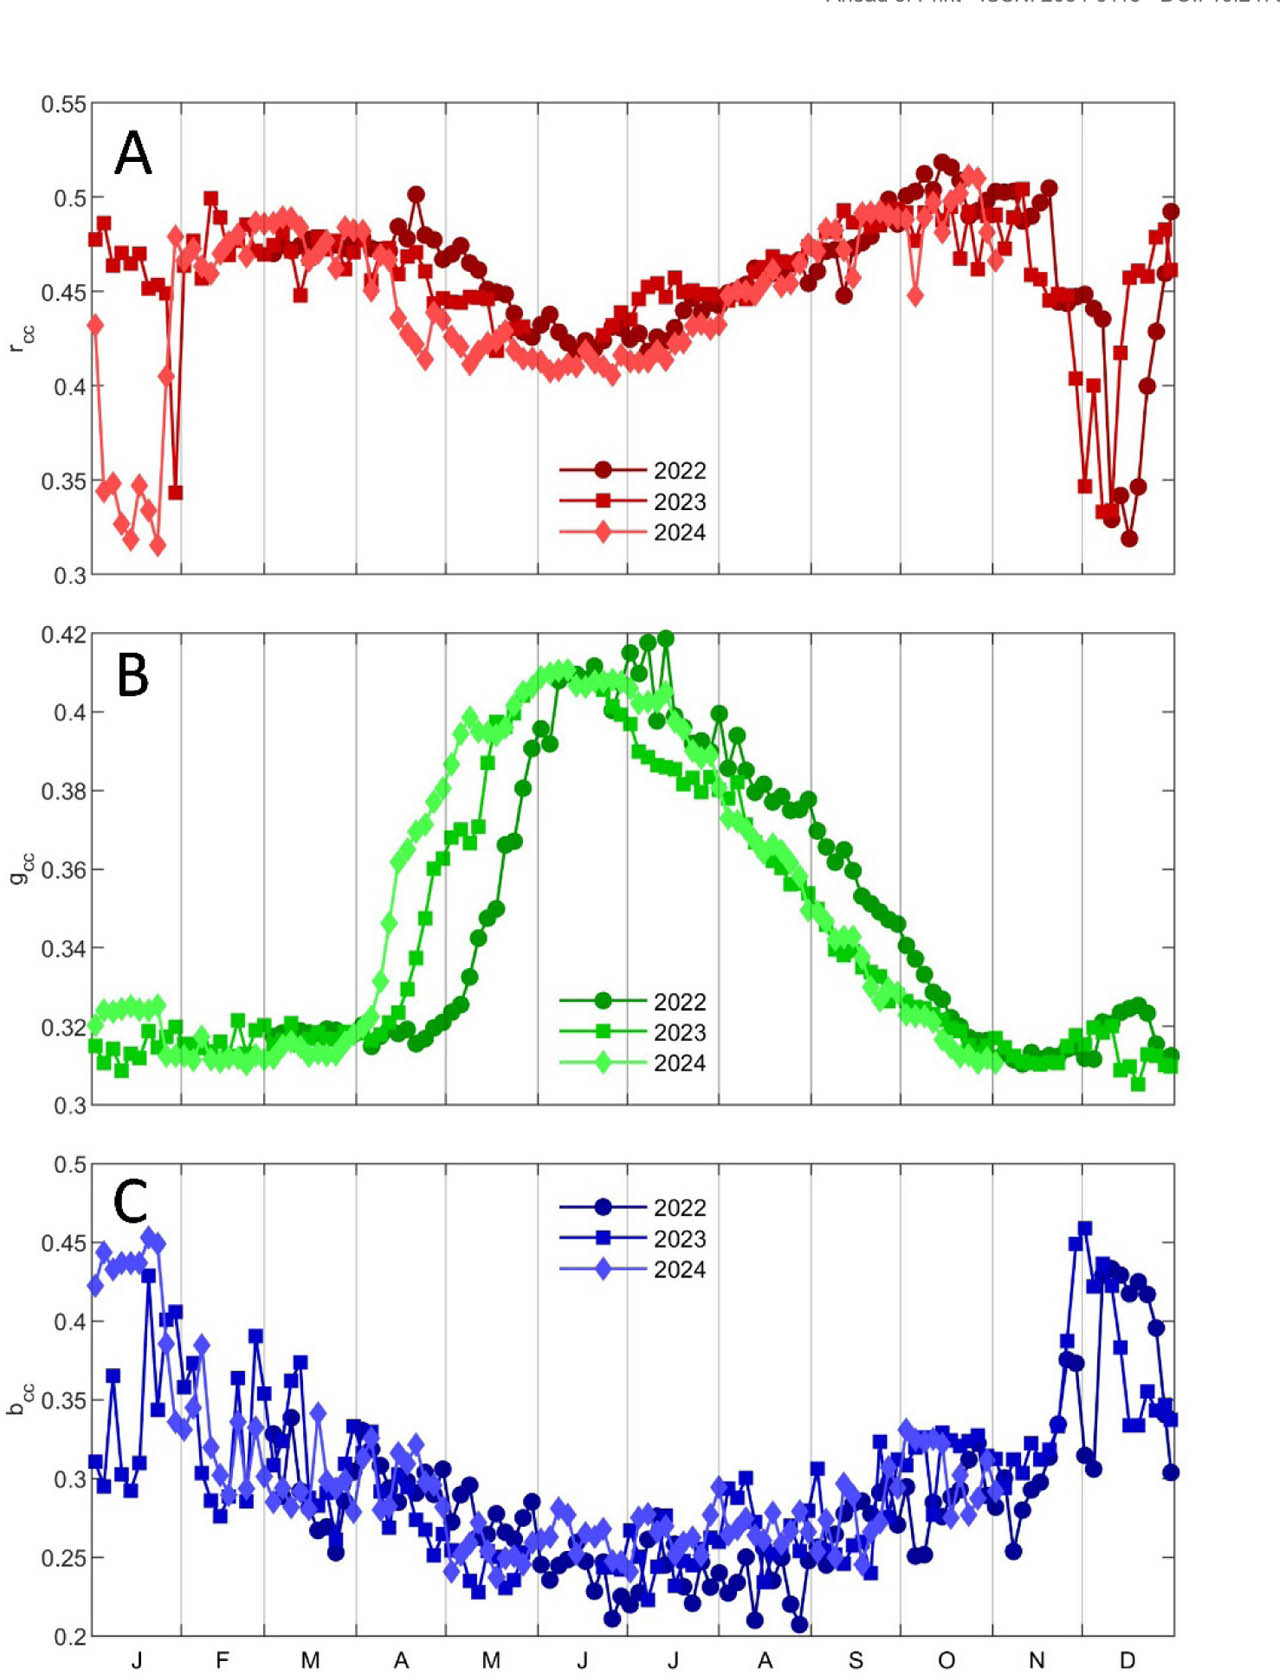
Figure 4.
Course of 3-day averages of chromatic coordinates: A – rcc (red chromatic coordinates), B – gcc (green chromatic coordinates), C – bcc (blue chromatic coordinates)
Source: own elaboration
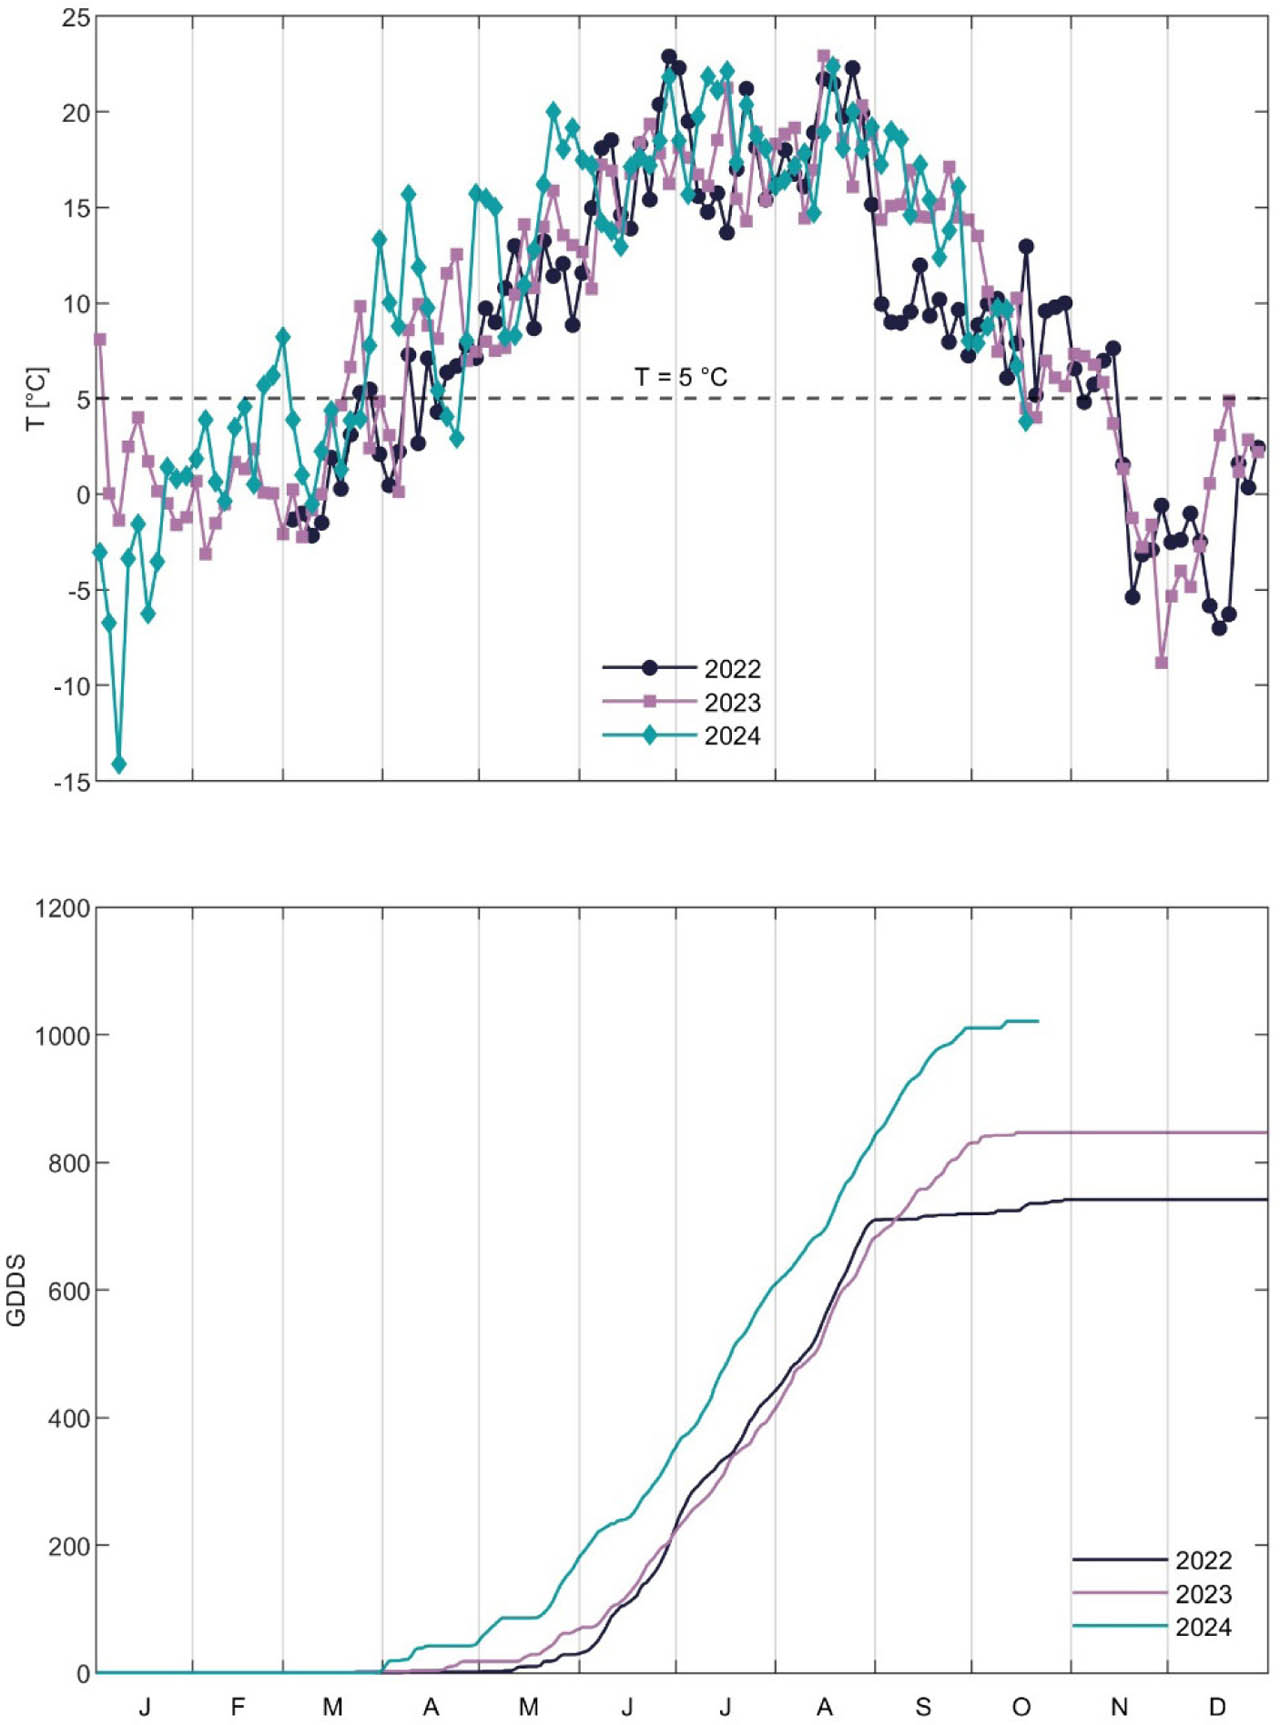
Figure 5.
Upper plot: course of 3-day averages of air temperature; dashed line represents the growing season threshold. Lower plot: comparison of GDDS for each year
Source: own elaboration