
Table 1.
Type of EU regions and eligibility for Cohesion Policy funding (2021–2027 programming period)
| Type of region | GDP/pc criterion | Number of regions | Allocated share of resources for the CP | Maximum level of EU co-financing |
|---|---|---|---|---|
| Less developed | below 75% of EU average | 78 | 59.8% | 85% |
| Transition | between 75% and 100% of EU average | 67 | 14.2% | 60% |
| More developed | above 100% of EU average | 95 | 8.1% | 40% |
[i] Source: own calculations based on Regulation 2021/1130, Regulation 2021/1060, Directorate-General for EU regional and urban policy (2025)
Table 2.
Model of initial individual allocations of EU Cohesion Policy funds (per capita per year, in EUR)
| More developed region | Transition region | Less developed region | |||
|---|---|---|---|---|---|
| Country's GNI/pc of EU avg. | Fixed support (100% of EU avg. < GDP/pc) | Max. support (GDP/pc = 75% of EU avg.) | GDP/pc growth by 1% | Min. support (GDP/pc = 74% of EU avg.) | GDP/pc decrease by 1% |
| < 82% | 15.20(a) | 121.13 | −4.85 | 209.96 | +8.08 |
| 82–99% | 15.20(a) | 53.13 | −2.13 | 92.08 | +3.54 |
| > 99% | 15.20(a) | 31.88 | −1.28 | 55.26 | +2.13 |
Notes: GNI/pc means Gross National Income per capita in purchasing power standards GDP/pc means Gross Domestic Product per capita in purchasing power standards
Source: Zdražil & Kraftova (2023)
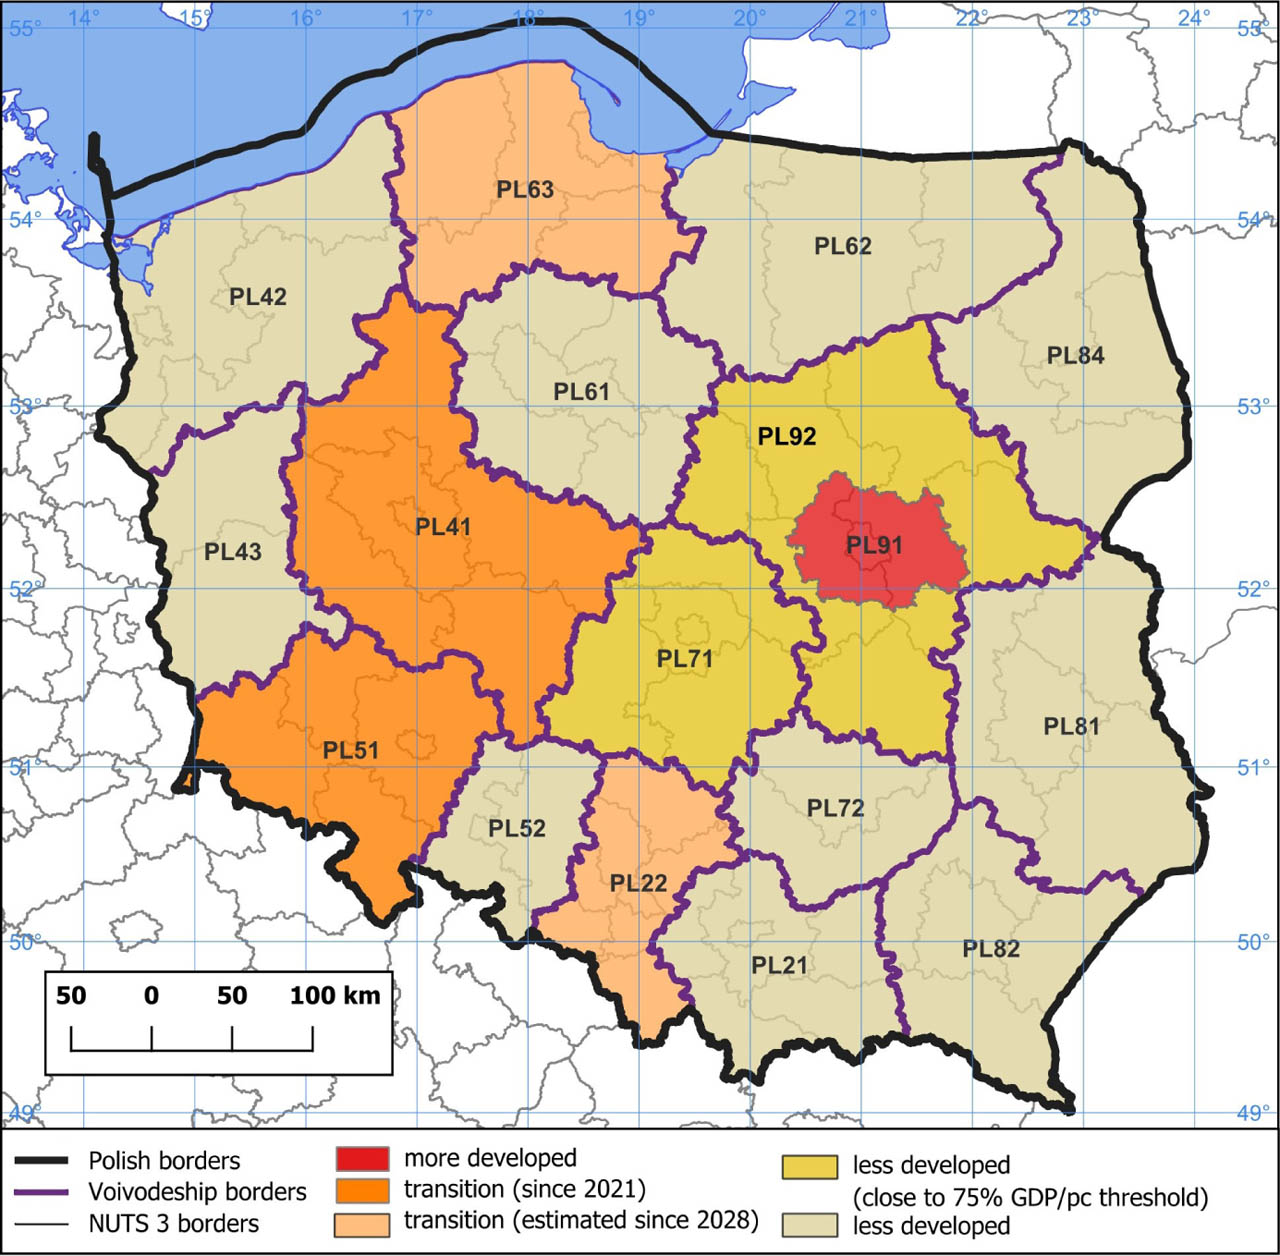
Figure 1.
Classification of Polish regions (2021–2027 vs. 2028+ Cohesion Policy programming period)
Notes: see Table 4 for region codes
Source: own calculations based on Eurostat (2025a)
Table 3.
Situation of Polish regions in EU Cohesion Policy: programming period 2021–2027 vs. 2028+
| 2021–2027 programming period | 2028+ programming period (estimated) | |||
|---|---|---|---|---|
| Type of region | Number of regions | Population share | Number of regions | Population share |
| Less developed | 14 | 75.2% | 10–12 | 43.6–56.0% |
| Transition | 2 | 16.7% | 4–6 | 34.9–47.3% |
| More developed | 1 | 8.1% | 1 | 9.1% |
[i] Source: own calculations based on Eurostat (2025a)
Table 4.
Application of the model of individual allocations of Cohesion Policy funds – current arrangement and projection
| Region | Allocation of funds (per capita per year, in EUR) | Allocation of funds (total, in billion EUR) | |||
|---|---|---|---|---|---|
| Code | Name | 2021–2027 | 2028+ | 2021–2027 | 2028+ |
| PL21 | Małopolskie | 312.3 | 254.4 | 7.5 | 6.1 |
| PL22 | Śląskie | 236.9 | 92.0 | 7.4 | 2.8 |
| PL41 | Wielkopolskie | 119.5 | 89.6 | 2.9 | 2.2 |
| PL42 | Zachodniopomorskie | 344.6 | 302.9 | 4.1 | 3.5 |
| PL43 | Lubuskie | 350.0 | 306.9 | 2.5 | 2.1 |
| PL51 | Dolnośląskie | 113.0 | 79.9 | 2.3 | 1.6 |
| PL52 | Opolskie | 368.9 | 306.9 | 2.5 | 2.0 |
| PL61 | Kujawsko-pomorskie | 360.8 | 302.9 | 5.2 | 4.2 |
| PL62 | Warmińsko-mazurskie | 420.0 | 371.6 | 4.1 | 3.4 |
| PL63 | Pomorskie | 277.3 | 118.7 | 4.6 | 2.0 |
| PL71 | Łódzkie | 293.5 | 222.1 | 5.0 | 3.6 |
| PL72 | Świętokrzyskie | 412.0 | 351.4 | 3.5 | 2.8 |
| PL81 | Lubelskie | 428.1 | 379.6 | 6.3 | 5.3 |
| PL82 | Podkarpackie | 425.4 | 371.6 | 6.3 | 5.2 |
| PL84 | Podlaskie | 414.7 | 327.1 | 3.4 | 2.5 |
| PL91 | Warszawski stołeczny | 15.2 | 15.2 | 0.3 | 0.4 |
| PL92 | Mazowiecki regionalny | 333.9 | 234.2 | 5.4 | 3.7 |
| Poland | 73.2(a) | 53.2 | |||
[i] Note: (a) the model does not include individual bonus payments; in total, EUR 75 billion was allocated to Polish regions for the 2021–2027 programming period
[ii] Source: own calculations based on Eurostat (2025a) and Zdražil and Kraftova (2023)
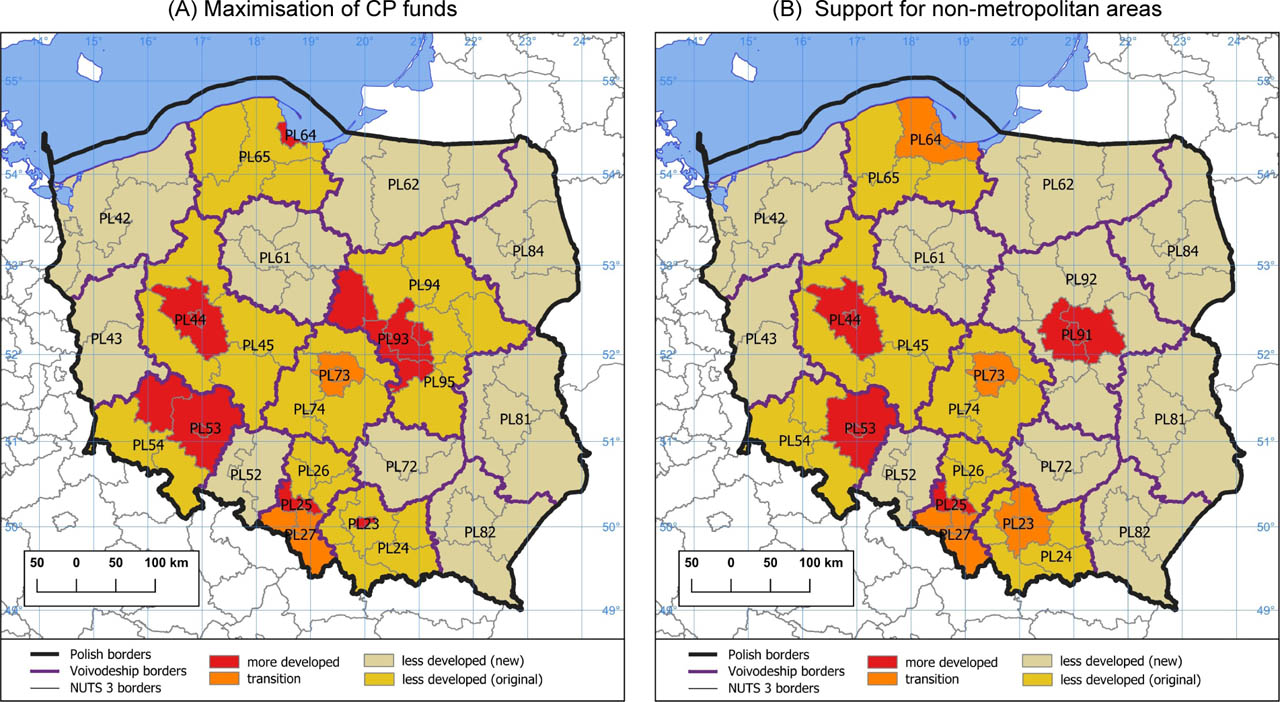
Figure 2.
Classification of NUTS 2 units in two new possible arrangements
Note: see Table 6 for composition details
Source: own calculations based on Eurostat (2025a)
Table 5.
Type of regions in Poland for 2028+ programming period (comparison of arrangements)
| Type of region | Current probable arrangement | New arrangement | ||||
|---|---|---|---|---|---|---|
| Number of regions | Population share | Number of regions | Population share | |||
| A | B | A | B | |||
| Less developed | 10–12 | 43.6–56.0% | 17 | 16 | 69.7% | 65.7% |
| Transition | 4–6 | 34.9–47.3% | 2 | 4 | 7.2% | 15.2% |
| More developed | 1 | 9.1% | 6 | 4 | 23.1% | 19.1% |
[i] Source: own calculations based on Eurostat (2025a)
Table 6.
Possible arrangement of Polish NUTS 2 regions – composition and key facts
| Current | New arrangement | |||||||||
|---|---|---|---|---|---|---|---|---|---|---|
| Code | GDP (%) | Pop. (%) | Alloc. of funds (bn EUR) | Code | Composition (of NUTS 3) | GDP (%) | Pop. (%) | Alloc. of funds (bn EUR) | Alloc. change (%) | |
| PL21 | 70 | 9.0 | 6.1 | A | PL23 | PL213 | 134 | 2.2 | 0.1 | +19.3 |
| PL24 | PL214+PL217+PL218+PL219+PL21A | 52 | 6.9 | 7.1 | ||||||
| B | PL23 | PL213+PL214 | 91 | 4.2 | 0.5 | −7.0(c) | ||||
| PL24 | PL217+PL218+PL219+PL21A | 51 | 4.8 | 5.1 | ||||||
| PL22 | 81 | 11.5 | 2.8 | A,B | PL25 | PL229+PL22A | 106 | 3.0 | 0.1 | +53.9 |
| PL26 | PL224+PL228+PL22B | 67 | 4.1 | 3.0 | ||||||
| PL27 | PL225+PL227+PL22C | 79 | 4.4 | 1.2 | ||||||
| PL41 | 82 | 9.4 | 2.2 | A,B | PL44 | PL415+PL418 | 112 | 3.4 | 0.1 | +118.2 |
| PL45 | PL411+PL414+ PL416+PL417 | 64 | 5.9 | 4.7 | ||||||
| PL42 | 64 | 4.3 | 3.5 | no change(a) | 64 | 4.3 | 3.5 | 0 | ||
| PL43 | 63 | 2.6 | 2.1 | no change(a) | 63 | 2.6 | 2.1 | 0 | ||
| PL51 | 84 | 7.8 | 1.6 | A,B | PL53 | PL514+PL518 | 103 | 3.6 | 0.1 | +87.6 |
| PL54 | PL515+PL516+PL517 | 68 | 4.1 | 2.9 | ||||||
| PL52 | 63 | 2.4 | 2.0 | no change(a) | 63 | 2.4 | 2.0 | 0 | ||
| PL61 | 64 | 5.2 | 4.2 | no change(b) | 64 | 5.2 | 4.2 | 0 | ||
| PL62 | 55 | 3.5 | 3.4 | no change(a) | 55 | 3.5 | 3.4 | 0 | ||
| PL63 | 76 | 6.3 | 2.0 | A | PL64 | PL633 | 126 | 2.0 | 0.1 | +124.3 |
| PL65 | PL634+PL636+PL637+PL638 | 53 | 4.2 | 4.3 | ||||||
| B | PL64 | PL633+PL634 | 91 | 3.7 | 0.4 | +44.9 | ||||
| PL65 | PL636+PL637+PL638 | 56 | 2.5 | 2.4 | ||||||
| PL71 | 74 | 6.4 | 3.6 | A,B | PL73 | PL711+PL712 | 85 | 2.8 | 0.6 | −6.6(d) |
| PL74 | PL713+PL714+PL715 | 65 | 3.5 | 2.8 | ||||||
| PL72 | 58 | 3.0 | 2.8 | no change(a) | 58 | 3.0 | 2.8 | 0 | ||
| PL81 | 54 | 5.3 | 5.3 | no change(b) | 54 | 5.3 | 5.3 | 0 | ||
| PL82 | 55 | 5.3 | 5.2 | no change(b) | 55 | 5.3 | 5.2 | 0 | ||
| PL84 | 61 | 2.9 | 2.5 | no change(a) | 61 | 2.9 | 2.5 | 0 | ||
| PL91 & PL92 | 154 72 | 9.1 6.0 | 0.4 3.7 | A | PL93 | PL911+PL913+PL923+PL926 | 165 | 8.8 | 0.4 | +49.2 |
| PL94 | PL912+PL922+PL924 | 61 | 3.7 | 3.3 | ||||||
| PL95 | PL921+PL925 | 57 | 2.6 | 2.4 | ||||||
| B | PL91 | no change(e) | 154 | 9.1 | 0.4 | 0 | ||||
| PL92 | no change(e) | 72 | 6.0 | 3.7 | ||||||
| Poland | 53.2 | A | Poland | 64.0 | +20.3 | |||||
| B | Poland | 58.9 | +10.7 | |||||||
{ label (or @symbol) needed for fn[@id='j_mgrsd-2025-0050_tfn_009'] } Notes: (a) the existing NUTS 3 regions cannot be used to make any changes in accordance with Regulation 1059/2003;
(c) made to maintain similarity with the remaining divisions (even if less favourable for the region);
(d) if PL71 were classified as a transition region (based on GDP/pc), the maximum allocation would be EUR 2.1 billion; the new arrangement of the region would, therefore, lead to a decrease in the allocation by 40%;
Source: own calculations based on Eurostat (2025a).
| Region | GDP/pc (as % of EU average) | Population share (in %) | ||
|---|---|---|---|---|
| Name | Code | 2015–2017(a) | 2022–2023(b) | 2023 |
| Malopolskie | PL21 | 62 | 70 | 9.0 |
| Slaskie | PL22 | 72 | 81** | 11.5 |
| Wielkopolskie | PL41 | 75** | 82** | 9.4 |
| Zachodniopomorskie | PL42 | 58 | 64 | 4.3 |
| Lubuskie | PL43 | 58 | 63 | 2.6 |
| Dolnoslaskie | PL51 | 77** | 84** | 7.8 |
| Opolskie | PL52 | 55 | 63 | 2.4 |
| Kujawsko-pomorskie | PL61 | 56 | 64 | 5.2 |
| Warmiñsko-mazurskie | PL62 | 49 | 55 | 3.5 |
| Pomorskie | PL63 | 67 | 76** | 6.3 |
| Lodzkie | PL71 | 65 | 74* | 6.4 |
| Swietokrzyskie | PL72 | 50 | 58 | 3.0 |
| Lubelskie | PL81 | 48 | 54 | 5.3 |
| Podkarpackie | PL82 | 48 | 55 | 5.3 |
| Podlaskie | PL84 | 50 | 61 | 2.9 |
| Warszawski stoleczny | PL91 | 149*** | 154*** | 9.1 |
| Mazowiecki regionalny | PL92 | 60 | 72* | 6.0 |
{ label (or @symbol) needed for fn[@id='j_mgrsd-2025-0050_tfn_016'] } Notes: (a) the average GDP/pc of 2015–2017 Cohesion Policy programming period (Regulation 2021/1060);
Source: own calculations based on Eurostat (2025a).