
Introduction
In the first two decades of the 21st century, Poland witnessed a period of substantial development, as evidenced by an increase in its gross domestic product per capita (GDP/pc) and numerous other social and economic indicators. This progression was predominantly enabled by its accession to the European Union (EU), a move that facilitated the integration of the Polish economy into Western European markets and provided access to European structural and investment funds (Gorzelak & Smętkowski 2020).
One of the most important EU instruments is the Cohesion Policy (CP), of which Poland has become the largest beneficiary. The primary goal of this policy is to reduce the scale of spatial disparities in development levels across the EU by improving economic, social and territorial cohesion. The CP has indeed contributed to Poland's convergence towards the European average, with all Polish regions benefiting from its funds by co-financing many important investments and public tasks. However, the speed of development has differed both between and within Polish regions (Churski & Żuber 2022; Churski et al. 2024). This is because the process of convergence with the EU has been quickest in regions associated with large urban centres and the western part of the country, while the slowest progress has occurred in peripheries and the weaker voivodeships of eastern Poland, which has led to increased inter-regional disparities (Szlachta 2017). Moreover, in terms of income and standard of living, well-developed areas, related to large agglomerations, are increasingly gaining, while other areas are developing more slowly and as a result, the distance between the two grows (Śleszyński 2018). However, this is not only a Polish phenomenon; empirical research shows that other transition countries in Europe show similar convergence patterns (Kokocińska & Puziak 2018; Zdražil 2025).
Although opinions on this matter vary, some regionalists in Poland argue that, without intervention, socio-economic disparities between and within regions will continue to widen. They advocate for special funds and dedicated instruments for peripheral and poorly developed areas.
The paper aims to present the possibility of rearranging the NUTS regions in Poland to increase the funds available within the European Union Cohesion Policy, while considering the broader context of the aims of this policy and the controversy surrounding such a reorganisation. Another related aim is to present the position of Polish regions in terms of GDP per capita relative to the EU average, while also highlighting the disparities in development levels between metropolitan areas and their hinterlands.
The introduction to this paper is followed by a short review of the literature on the evolution of the CP in relation to its efficiency. The research methodology and data used are then described. The next two sections present data on how Polish regions are catching up with the EU in terms of GDP/pc and, at the same time, how they are internally uneven. Using these data, we show how Poland could change their NUTS 2 arrangement and discuss the justification and possible implications of such a move. The paper concludes with a summary and discussion.
Target regions and efficiency of the European Union Cohesion Policy
The European Union Cohesion Policy supports its administrative regions financially, dividing target administrative units into more developed (above 100% of the EU average in GDP/pc), transition (75–100%) and less developed (under 75%) categories. The last group gains significant advantage both in terms of funding allocation but also in terms of co-financing of projects (see Table 1 below) (Regulation 2021/1060, Regulation 1260/1999).
Table 1.
Type of EU regions and eligibility for Cohesion Policy funding (2021–2027 programming period)
| Type of region | GDP/pc criterion | Number of regions | Allocated share of resources for the CP | Maximum level of EU co-financing |
|---|---|---|---|---|
| Less developed | below 75% of EU average | 78 | 59.8% | 85% |
| Transition | between 75% and 100% of EU average | 67 | 14.2% | 60% |
| More developed | above 100% of EU average | 95 | 8.1% | 40% |
[i] Source: own calculations based on Regulation 2021/1130, Regulation 2021/1060, Directorate-General for EU regional and urban policy (2025)
Following the launch of the 2021–2027 programming period of the CP, it was observed that certain countries have gained a significant advantage by increasing the allocation of EU funds through a new arrangement of NUTS 2 regions (Zdražil & Kraftova 2023). Hungary, Poland and Lithuania classified their capital cities as separate regions, consequently acquiring the designation of ‘less developed region’ for their extensive and populous areas. Subsequently, Croatia and Portugal underwent a similar reorganisation of their NUTS regions, with the explicit motivation of enhanced access to EU funds being openly disclosed. Consequently, the EU has witnessed an ‘expansion’ of the territory of less developed regions by approximately 125,000 km2 in recent years (nearly equivalent in size to Greece), which is home to a population of approximately 8.5 million people (similar to the population of Austria) (Eurostat 2025a). However, this is merely a nominal change, as no cataclysmic or abrupt changes have befallen these regions or their inhabitants. The delineation of capital cities into discrete NUTS 2 regions would also prove advantageous for Bulgaria, Latvia, Estonia and Romania with respect to access to EU funds (Zdražil & Kraftova 2023); however, it can be posited that this would also motivate other countries, particularly those in the CEE region, to seek modifications to the arrangement of NUTS 2 regions. This is particularly relevant for countries whose NUTS 2 regions might then reach the level of 75% of GDP/pc of the EU average, which would result in their reclassification as ‘transition regions’. This would, in turn, lead to a significant deterioration in the conditions of access to EU funds (Picazo-Tadeo et al. 2024).
In view of the changes within the NUTS 2 arrangement, the CP is becoming a conflicted environment, where individual States make competing claims (Solis-Baltodano, Gimenez-Gomez & Peris 2022). It is intriguing to observe the recent discourse surrounding the efficiency and future of the EU Cohesion Policy. This discourse has emerged as a response to the recognition that it has evolved into a multifaceted policy that has begun to deviate from its original mandate (Scotti, Flori & Pammolli 2022). This assertion was made in light of the failure to impede the proliferation of regional disparities and the augmentation of the disparity between successful and unsuccessful regions (Markowska, Hlavacek & Strahl 2022), the latter being frequently designated as ‘left-behind’ places (Rodríguez-Pose 2018). The impetus for the discourse was provided by a series of documents disseminated in rapid succession by three pivotal international institutions: the World Bank, the OECD and the European Commission.
In relation to the theoretical concept of the New Economic Geography, the World Bank highlighted the importance of policies focused on spatial aspects of territory, mentioning, in particular, the issue of agglomerations and urban growth. Spatially targeted interventions were not recommended to be used in general but mainly to address specific problems (World Bank 2009). Two OECD reports highlighted the negative impact of spatial inequalities and the need to focus policy on less developed regions. They attached fundamental importance to the application of integrated regional policies to help activate the development potential of each region through a tailored approach (OECD 2009a, 2009b). The meaningful Barca report, prepared for the European Commission (2009), contained similar conclusions, advocating interventions that use local knowledge to support the long-term potential of a particular territory, with responsibility for policy design and implementation shared between different levels of government. As Barca, McCann & Rodríguez-Pose (2012) pointed out, the two reports agreed that the spatial dimension of development is of vital importance – it shapes development potential not only of the territory but also of the individuals who live in it. Therefore, EU development strategies should be based on considering the place where the intervention occurs and are largely dependent on the context – this is referred to as a place-based approach.
Despite the special measures directed at less developed areas, most OECD countries recently observed widening income inequalities among their regions (Churski et al. 2024). Still, most authors agree that a place-based development approach can help the EU overcome the perceived inefficiencies of the Cohesion Policy and the underutilisation of regional resources, and ensure a fair and equitable distribution of opportunities across the space (Keller & Virág 2022; European Commission 2024). In this ‘place-sensitive distributed development policy’, Europe's strongest regions are strengthened and, even more importantly, new opportunities are created for industrially declining or less developed regions (Iammarino, Rodríguez-Pose & Storper 2019).
However, neither the documents nor the mainstream debates on the future of EU regional policy assume a formal adjustment of regional boundaries as a good and legitimate tool to follow the place-based approach. Otherwise put, there is no consideration for deliberately changing regional boundaries to gain more funding, for example, from the EU Cohesion Policy. On the other hand, such changes have happened many times before and are discussed in the scientific literature. Maza and Villaverde (2011) pointed out the problematic nature of evaluating and setting Cohesion Policy based on NUTS 2 regions years ago. The principles and effectiveness of the allocation mechanism have also been questioned by De Rynck and McAleavey (2001), Bachtler et al. (2017), Becker (2019) and others. More recently, Zdražil and Kraftova (2023) have also drawn attention to the possibility of the ‘misuse’ of changes in the NUTS classification. This paper's analysis is another critical voice in the discussion about changes solely intended to increase external financial resources, while drawing attention to the growing inequality between metropolitan areas and other regions, and the need to address this issue. While rearranging NUTS units increases available funding, special instruments should first be implemented to improve development opportunities for poorer subregions located outside the richest metropolitan areas.
Method
NUTS 2 regions are classified at the beginning of each programming period of Cohesion Policy based on the value of GDP/pc in purchasing power standards. Allocations are quantified separately, according to the level of development of each region, but the total amount is then country-specific and not linked to the region on which the allocation was based. As shown in Table 1, the less developed regions receive the vast majority of the funding and have the highest co-financing rate allowed. Therefore, the classification of regions is crucial for the potential use of Cohesion Policy funds.
To assess the position of Polish regions, we focused on those that are currently above the 75% GDP/pc of the EU average and those that are close to the threshold (and risk losing the status of ‘less developed’). We calculated the GDP/pc level based on the average of the years 2022–2023, namely the most recent data available at the regional level. It can be assumed that the data used for the classification of regions for the 2028+ programming period will be very close to these values. In the past, data from the beginning of the previous programming periods were used for this purpose (in the most recent 2021–2027 programming period, the classification of regions was based on the average of the years 2015–2017; Regulation 2021/1060).
In the next step, we created possible arrangements of NUTS 2 regions, which would make it possible to increase Poland's allocation potential for the 2028+ and next programming periods. Since the arrangement of NUTS regions is subject to clear rules under EU legislation, it is imperative that the configuration be in compliance with Regulation 1059/2003. In accordance with this step, the latest data on NUTS 3 regions (available for Poland; data from 2022) were applied to recalculate GDP/pc values as a percentage of the EU average, and information on the population distribution in the arrangement was obtained at the same time. Put simply, we added together the reported absolute data on GDP and population in the new units. We then divided and recalculated these figures in relation to the EU average.
We applied our original Model of initial individual allocations of funding (Zdražil & Kraftova 2023) to assess the current position and the merits of the created arrangement. Based on the level of GDP/pc reported, the model can estimate the allocation of EU funds for each region, as summarised in Table 2. In this way, we can estimate how Poland's access to EU funds would change given current GDP/pc values, assuming the conditions of the 2028+ programming period are same as those of the 2021–2027 period. The conditions for the allocation of funds have not change fundamentally and are based on the so-called Berlin formula, which was adopted in 1999 and has since undergone only minor changes (Zimakov & Popov 2021). We also apply the Model of initial individual allocations to the created arrangement of NUTS 2 regions to demonstrate its potential impact on the allocation of funds for Poland in the 2028+ programming period. Finally, we compare the calculations of proposed regional rearrangements with the amounts of funds that would be allocated to Polish regions if the current regions remained unchanged.
Table 2.
Model of initial individual allocations of EU Cohesion Policy funds (per capita per year, in EUR)
| More developed region | Transition region | Less developed region | |||
|---|---|---|---|---|---|
| Country's GNI/pc of EU avg. | Fixed support (100% of EU avg. < GDP/pc) | Max. support (GDP/pc = 75% of EU avg.) | GDP/pc growth by 1% | Min. support (GDP/pc = 74% of EU avg.) | GDP/pc decrease by 1% |
| < 82% | 15.20(a) | 121.13 | −4.85 | 209.96 | +8.08 |
| 82–99% | 15.20(a) | 53.13 | −2.13 | 92.08 | +3.54 |
| > 99% | 15.20(a) | 31.88 | −1.28 | 55.26 | +2.13 |
Notes: GNI/pc means Gross National Income per capita in purchasing power standards GDP/pc means Gross Domestic Product per capita in purchasing power standards
Source: Zdražil & Kraftova (2023)
We should point out that the modelled allocation does not include additional bonus payments intended to help to more intensively eliminate specific regional disparities. For example, the 2021–2027 CP funds provide premiums for unemployed people and the number of migrants admitted (see Regulation 2021/1060, annex XXVI). However, these payments had a marginal impact on the allocation of funding, which is also evident in the case of Poland.
The analysis is based on the Regional Economic Accounts database maintained by Eurostat (2025a). The database provides information on GDP and population distribution in European NUTS 2 and NUTS 3 regions. The indicator values for the created units are calculated according to standard aggregation conventions. The GDP/pc indicator is then related to the population dimension, and then to the EU average. The map outputs are processed using QGIS software and use spatial data on regions in the NUTS 2024 version, with the source of spatial data on regions being Eurostat (2025b).
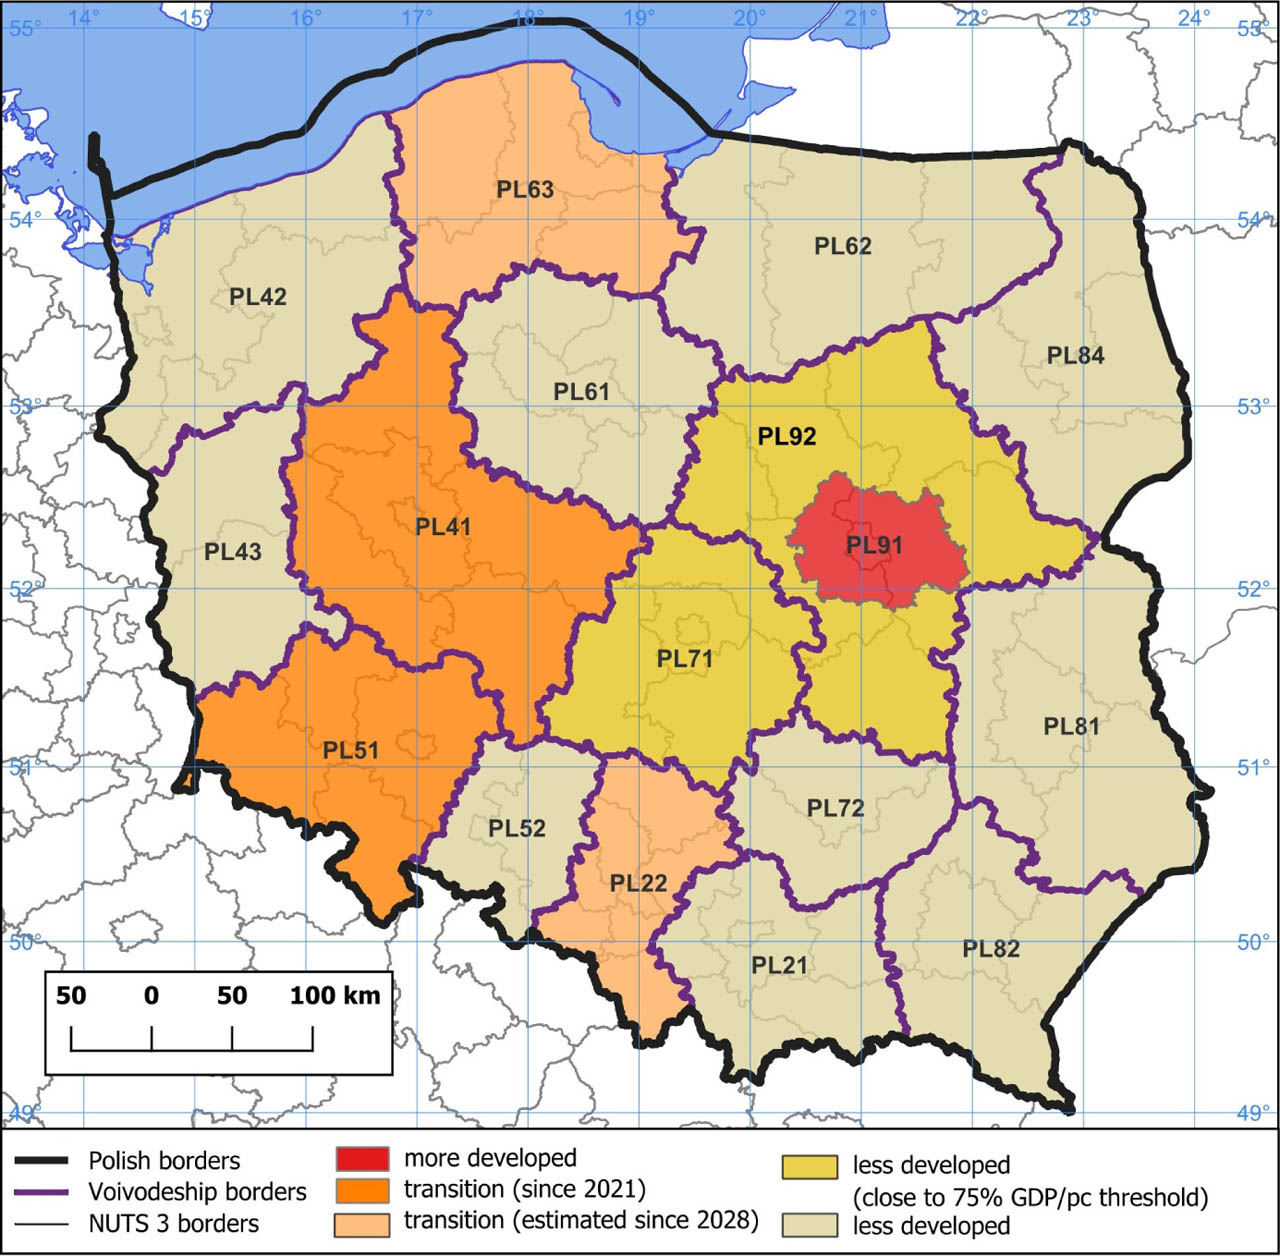
Figure 1.
Classification of Polish regions (2021–2027 vs. 2028+ Cohesion Policy programming period)
Notes: see Table 4 for region codes
Source: own calculations based on Eurostat (2025a)
Results: Polish regions catching up with the EU
As illustrated in Table 3, according to the most recent data, Polish regions are catching up with the EU average in terms of GDP per capita. During the 2021–2027 programming period, 75% of the population resided in less developed regions, with only three regions (Warszawski Stołeczny, Dolnośląskie and Wielkopolskie) not falling into this category. However, the situation has undergone a fundamental shift. In the ‘optimistic scenario’ for 2028+ programming period, we can expect that 12 regions will be classified as less developed (Śląskie and Pomorskie will lose that status), which corresponds to 56% of the Polish population. Conversely, the ‘pessimistic scenario’ posits that a mere 10 regions may ultimately be classified as less developed (Łódzkie and Mazowiecki regionalny will also lose the status) – approximately 44% of the population. The discrepancy between the current situation and the projected outcome, irrespective of the specific variant, is set to be substantial. These changes are illustrated in Figure 1 (see Appendix 1 for details).
Table 3.
Situation of Polish regions in EU Cohesion Policy: programming period 2021–2027 vs. 2028+
| 2021–2027 programming period | 2028+ programming period (estimated) | |||
|---|---|---|---|---|
| Type of region | Number of regions | Population share | Number of regions | Population share |
| Less developed | 14 | 75.2% | 10–12 | 43.6–56.0% |
| Transition | 2 | 16.7% | 4–6 | 34.9–47.3% |
| More developed | 1 | 8.1% | 1 | 9.1% |
[i] Source: own calculations based on Eurostat (2025a)
For the 2021–2027 programming period, an allocation of EUR 75 billion was made in EU funds for Polish regions (European Commission 2021). The application of our original Model of initial individual allocations of funds, namely without additional bonus payments, estimates the allocated amount at EUR 73 billion, which is in close alignment with reality (calculations seem to be reasonably accurate for Poland). Using the same model, it is estimated that, in the optimistic scenario, the allocation of EU funds to the Polish regions, for the 2028+ programming period, would be reduced by approximately one-third, amounting to EUR 53 billion (see Table 4). In the pessimistic scenario, this figure would amount to EUR 50 billion. The reduction in the per capita allocation of funds will be reflected across the board, with the most significant decrease expected to be due to the success of the populous regions of Śląskie, Pomorskie, Mazowiecki regionalny and Łódzkie.
Table 4.
Application of the model of individual allocations of Cohesion Policy funds – current arrangement and projection
| Region | Allocation of funds (per capita per year, in EUR) | Allocation of funds (total, in billion EUR) | |||
|---|---|---|---|---|---|
| Code | Name | 2021–2027 | 2028+ | 2021–2027 | 2028+ |
| PL21 | Małopolskie | 312.3 | 254.4 | 7.5 | 6.1 |
| PL22 | Śląskie | 236.9 | 92.0 | 7.4 | 2.8 |
| PL41 | Wielkopolskie | 119.5 | 89.6 | 2.9 | 2.2 |
| PL42 | Zachodniopomorskie | 344.6 | 302.9 | 4.1 | 3.5 |
| PL43 | Lubuskie | 350.0 | 306.9 | 2.5 | 2.1 |
| PL51 | Dolnośląskie | 113.0 | 79.9 | 2.3 | 1.6 |
| PL52 | Opolskie | 368.9 | 306.9 | 2.5 | 2.0 |
| PL61 | Kujawsko-pomorskie | 360.8 | 302.9 | 5.2 | 4.2 |
| PL62 | Warmińsko-mazurskie | 420.0 | 371.6 | 4.1 | 3.4 |
| PL63 | Pomorskie | 277.3 | 118.7 | 4.6 | 2.0 |
| PL71 | Łódzkie | 293.5 | 222.1 | 5.0 | 3.6 |
| PL72 | Świętokrzyskie | 412.0 | 351.4 | 3.5 | 2.8 |
| PL81 | Lubelskie | 428.1 | 379.6 | 6.3 | 5.3 |
| PL82 | Podkarpackie | 425.4 | 371.6 | 6.3 | 5.2 |
| PL84 | Podlaskie | 414.7 | 327.1 | 3.4 | 2.5 |
| PL91 | Warszawski stołeczny | 15.2 | 15.2 | 0.3 | 0.4 |
| PL92 | Mazowiecki regionalny | 333.9 | 234.2 | 5.4 | 3.7 |
| Poland | 73.2(a) | 53.2 | |||
[i] Note: (a) the model does not include individual bonus payments; in total, EUR 75 billion was allocated to Polish regions for the 2021–2027 programming period
[ii] Source: own calculations based on Eurostat (2025a) and Zdražil and Kraftova (2023)
Due to the substantial decrease in the allocation of EU funds, the safety net would most probably be activated for Poland in the 2028+ programming period. This instrument serves to mitigate the negative effects of the situation in which countries find themselves. For the 2021–2027 programming period, the three most salient safeguard measures for Poland were as follows (EU regulation 2021/1060, Annex XXVI):
– the yearly allocation for regions that were classified as less developed in the previous period, but which have newly become transition regions, shall not be lower than 60% of their previous period's average annual allocation;
– the total allocation of a country for its transition regions, which were already transition regions in the previous period, shall not be lower than 65% of the previous period's allocation;
– the total allocation to the country shall not be lower than 76% of the previous period's allocation.
If the conditions remain unchanged in the 2028+ programming period, our calculations indicate that the first safeguard measure would result in an increase of EUR 1.4 billion in the total allocation; the second would not be activated and the third would lead to an additional increase in the total allocation for Poland, bringing it to EUR 57 billion. While the activation of these safety nets would increase the resources available for the 2028+ programming period, their activation may be a major issue in relation to the subsequent programming period, which is set to begin in the mid-2030s. Indeed, given the current level and dynamics of GDP/pc of Polish regions, it is expected that all of them will continue to catch up with the EU average, leading to a possible further significant decrease in EU fund allocations.
Results: intraregional disparities and possible new NUTS 2 arrangements
Considering the findings, we conducted an in-depth analysis of GDP per capita levels in NUTS 3 regions and identified significant internal disparities (Fig. 2). We examined potential rearrangements of the Polish NUTS 2 regions that would offset the reduction in EU funding allocation and generate development opportunities in poorer areas outside metropolitan areas.
We ensured that the proposal is in accordance with current EU legislation. In particular, the population of a NUTS 2 region should be in the range of 0.8–3 million (Regulation 1059/2003, Article 3) and any modifications to the configuration of non-administrative NUTS 2 regions are permitted exclusively if they contribute to the reduction of standard deviation in the population size of all EU territorial units (Regulation 1059/2003, Article 5).
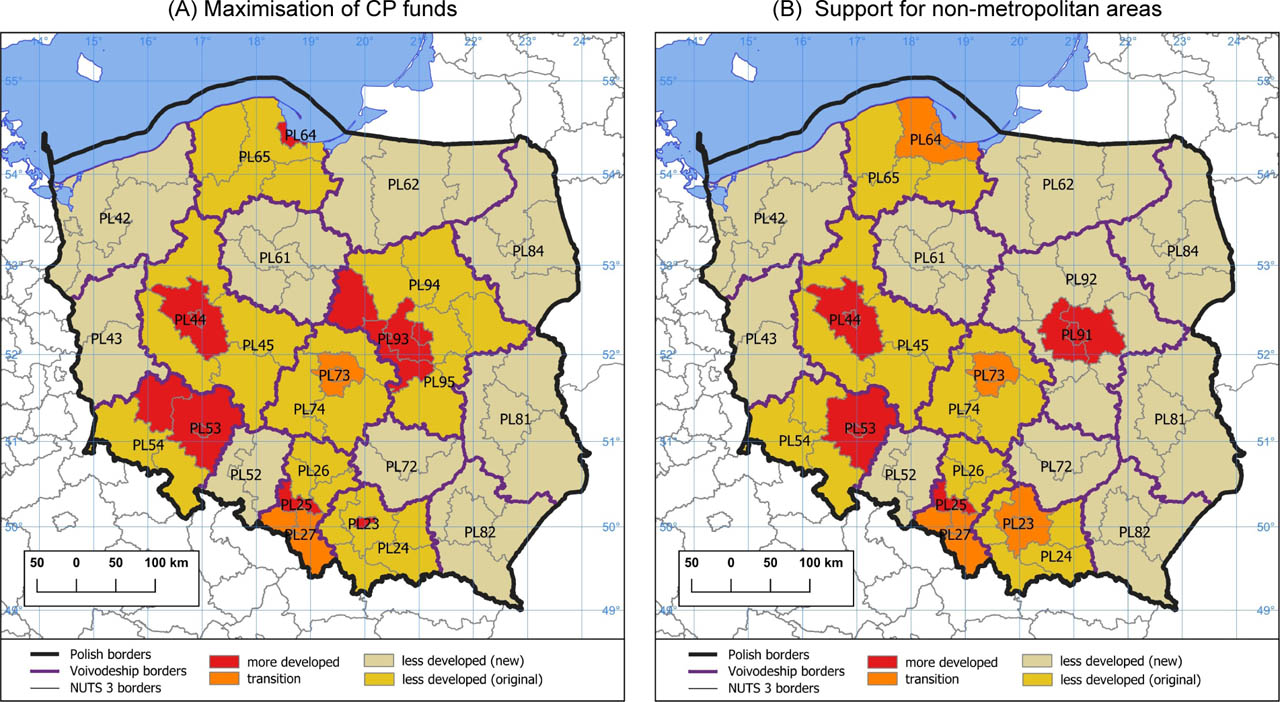
Figure 2.
Classification of NUTS 2 units in two new possible arrangements
Note: see Table 6 for composition details
Source: own calculations based on Eurostat (2025a)
The result entails the exclusion of the more developed areas of larger cities and their functional areas from the existing NUTS 2 regions with the implementation of the delimitation based on existing NUTS 3 regions. This approach ensures the high efficiency of the created arrangements, as Member States already report GDP and population data at the level of NUTS 3 regions. These data are easily used ex ante when modelling the new arrangement of NUTS 2 regions. Furthermore, the availability of other indicators at the NUTS 3 level, in addition to those previously mentioned, obviates the necessity for the computation of a substantial number of time series for these indicators, as would otherwise be required by Regulation 1059/2003, Article 5.
We consider two possible scenarios: (A) the maximisation of total EU Cohesion Policy funds to Poland, and (B) support for non-metropolitan areas under EU Cohesion Policy (by separating the largest cities with their suburbs from the rest of the regions) (see Fig. 2, Table 5). A comparison of Figure 2 and Figure 1 shows that the number of NUTS 2 units would increase from 17 to 25 (A) or to 24 (B). It is also evident that the implementation of the new configuration would lead to a significant expansion of the areas that would be considered as less developed regions by the Cohesion Policy. Conversely, the eight largest and richest cities and their surrounding areas would be affected: Warsaw, Wrocław, Poznań, Katowice and Gliwice would find themselves in the position of more developed regions, while Cracow, Gdańsk and Łódź would become transition regions. Their access to EU funds would worsen but, most probably, they will continue to develop even without higher EU funding (which is not the case for most of the less developed subregions).
Table 5.
Type of regions in Poland for 2028+ programming period (comparison of arrangements)
| Type of region | Current probable arrangement | New arrangement | ||||
|---|---|---|---|---|---|---|
| Number of regions | Population share | Number of regions | Population share | |||
| A | B | A | B | |||
| Less developed | 10–12 | 43.6–56.0% | 17 | 16 | 69.7% | 65.7% |
| Transition | 4–6 | 34.9–47.3% | 2 | 4 | 7.2% | 15.2% |
| More developed | 1 | 9.1% | 6 | 4 | 23.1% | 19.1% |
[i] Source: own calculations based on Eurostat (2025a)
All in all, the implementation of the proposal (scenario A or B) would lead to a significant improvement of Poland's position at the beginning of the 2028+ programming period, as evidenced in Table 5. In the new arrangement, less developed regions would be inhabited by 70% (A) or 66% (B) of the population, which means a drop of 5–10 percentage points compared to the 2021–2027 programming period. However, the more developed regions would more than double their population under the new arrangement.
The possibility is presented in detail in Table 6. The amendments could result in an increase in the allocation of EU funds to EUR 64 billion (A) or EUR 58.9 billion (B), which is approximately 20% (A) or 10% (B) higher than the estimated allocation of the currently most probable arrangement. In a pessimistic scenario (classification of Łódzkie and Mazowiecki regionalny as transition regions), the increase under the new arrangement would even be 29% (A) or 19% (B). Finally, under the presented arrangement, the allocation of both scenarios would be higher than it would be following the safety net interventions in the current NUTS 2 region arrangement.
Table 6.
Possible arrangement of Polish NUTS 2 regions – composition and key facts
| Current | New arrangement | |||||||||
|---|---|---|---|---|---|---|---|---|---|---|
| Code | GDP (%) | Pop. (%) | Alloc. of funds (bn EUR) | Code | Composition (of NUTS 3) | GDP (%) | Pop. (%) | Alloc. of funds (bn EUR) | Alloc. change (%) | |
| PL21 | 70 | 9.0 | 6.1 | A | PL23 | PL213 | 134 | 2.2 | 0.1 | +19.3 |
| PL24 | PL214+PL217+PL218+PL219+PL21A | 52 | 6.9 | 7.1 | ||||||
| B | PL23 | PL213+PL214 | 91 | 4.2 | 0.5 | −7.0(c) | ||||
| PL24 | PL217+PL218+PL219+PL21A | 51 | 4.8 | 5.1 | ||||||
| PL22 | 81 | 11.5 | 2.8 | A,B | PL25 | PL229+PL22A | 106 | 3.0 | 0.1 | +53.9 |
| PL26 | PL224+PL228+PL22B | 67 | 4.1 | 3.0 | ||||||
| PL27 | PL225+PL227+PL22C | 79 | 4.4 | 1.2 | ||||||
| PL41 | 82 | 9.4 | 2.2 | A,B | PL44 | PL415+PL418 | 112 | 3.4 | 0.1 | +118.2 |
| PL45 | PL411+PL414+ PL416+PL417 | 64 | 5.9 | 4.7 | ||||||
| PL42 | 64 | 4.3 | 3.5 | no change(a) | 64 | 4.3 | 3.5 | 0 | ||
| PL43 | 63 | 2.6 | 2.1 | no change(a) | 63 | 2.6 | 2.1 | 0 | ||
| PL51 | 84 | 7.8 | 1.6 | A,B | PL53 | PL514+PL518 | 103 | 3.6 | 0.1 | +87.6 |
| PL54 | PL515+PL516+PL517 | 68 | 4.1 | 2.9 | ||||||
| PL52 | 63 | 2.4 | 2.0 | no change(a) | 63 | 2.4 | 2.0 | 0 | ||
| PL61 | 64 | 5.2 | 4.2 | no change(b) | 64 | 5.2 | 4.2 | 0 | ||
| PL62 | 55 | 3.5 | 3.4 | no change(a) | 55 | 3.5 | 3.4 | 0 | ||
| PL63 | 76 | 6.3 | 2.0 | A | PL64 | PL633 | 126 | 2.0 | 0.1 | +124.3 |
| PL65 | PL634+PL636+PL637+PL638 | 53 | 4.2 | 4.3 | ||||||
| B | PL64 | PL633+PL634 | 91 | 3.7 | 0.4 | +44.9 | ||||
| PL65 | PL636+PL637+PL638 | 56 | 2.5 | 2.4 | ||||||
| PL71 | 74 | 6.4 | 3.6 | A,B | PL73 | PL711+PL712 | 85 | 2.8 | 0.6 | −6.6(d) |
| PL74 | PL713+PL714+PL715 | 65 | 3.5 | 2.8 | ||||||
| PL72 | 58 | 3.0 | 2.8 | no change(a) | 58 | 3.0 | 2.8 | 0 | ||
| PL81 | 54 | 5.3 | 5.3 | no change(b) | 54 | 5.3 | 5.3 | 0 | ||
| PL82 | 55 | 5.3 | 5.2 | no change(b) | 55 | 5.3 | 5.2 | 0 | ||
| PL84 | 61 | 2.9 | 2.5 | no change(a) | 61 | 2.9 | 2.5 | 0 | ||
| PL91 & PL92 | 154 72 | 9.1 6.0 | 0.4 3.7 | A | PL93 | PL911+PL913+PL923+PL926 | 165 | 8.8 | 0.4 | +49.2 |
| PL94 | PL912+PL922+PL924 | 61 | 3.7 | 3.3 | ||||||
| PL95 | PL921+PL925 | 57 | 2.6 | 2.4 | ||||||
| B | PL91 | no change(e) | 154 | 9.1 | 0.4 | 0 | ||||
| PL92 | no change(e) | 72 | 6.0 | 3.7 | ||||||
| Poland | 53.2 | A | Poland | 64.0 | +20.3 | |||||
| B | Poland | 58.9 | +10.7 | |||||||
{ label (or @symbol) needed for fn[@id='j_mgrsd-2025-0050_tfn_009'] } Notes: (a) the existing NUTS 3 regions cannot be used to make any changes in accordance with Regulation 1059/2003;
(c) made to maintain similarity with the remaining divisions (even if less favourable for the region);
(d) if PL71 were classified as a transition region (based on GDP/pc), the maximum allocation would be EUR 2.1 billion; the new arrangement of the region would, therefore, lead to a decrease in the allocation by 40%;
Source: own calculations based on Eurostat (2025a).
In the ‘maximising EU funding’ scenario (A), the most significant effect would be the separation of Tricity (Gdańsk, Gdynia and Sopot) from the Pomorskie region (PL63) and Poznań with its hinterland from the Wielkopolskie region (PL41). This would result in more than double the allocation of money for both places. A separation of the city of Krakow from Małopolskie (PL21) would result in an approximate 19% increase in allocation. Although it is probable that Małopolskie will be classified as a less developed region for the 2028+ programming period, the implementation of the new arrangement would increase the allocation by EUR 1 billion. In the specific instance of Mazowieckie (units PL91 and PL92), a more extensive amendment is given, involving a change in the composition of the Warsaw metropolitan region. Until 2018, Mazowieckie constituted one NUTS 2 region. The division of this region into PL91 and PL92, and the exclusion of Warsaw and its vicinity, creating a new NUTS 2 region, led to an increase in the allocation of EU funds for Poland for the 2021–2027 programming period. Nevertheless, given the current indicators, this composition could be revised again, with three new regions resulting in a 50% increase in the allocation of money to Mazowieckie.
Scenario B is characterised by its uniformity, with the separation of the seven largest metropolitan areas in Poland into separate NUTS 2 categories. However, this approach may not always yield optimal results, particularly in the case of Pomorskie, Małopolskie and Mazowieckie. The adoption of this scenario would place emphasis on the support for non-metropolitan areas, rather than merely maximising possible allocation of EU funds for Poland.
A particular instance of the change under consideration is Łódzkie (PL71), where the recommendation is to divide the city of Łódź and its surrounding area (Łódzki regionalny). This course of action would entail a marginal decrease in financial resources allocated to the region. This approach is predicated on the premise that the region might be designated as a transition region, thereby mitigating the associated risks. It is noteworthy that Łódzkie has nearly attained the 75% GDP/pc threshold of the EU average, and if this benchmark were to be exceeded, the allocation of funds would undergo a 40% reduction.
All units in the possible arrangement meet the criterion of a population of 0.8–3 million. Also, new arrangements meet the criterion for the non-administrative units, since they reduce the standard deviation of the size in terms of the population of all EU territorial units. Before the change, the standard deviation was 1,637; after the change, it would be 1,600 (A) or 1,602 (B). The impact of each arrangement on the standard deviation ranges between −2 and −3 (for Pomorskie and Łódzkie – lowest values) to −7 and −12 (Wielkopolskie and Śląskie – highest values).
The above hypothetical exercise, using data on GDP and the population of subregions and the financial resources from the EU Cohesion Policy that they theoretically ‘deserve’, is important for another reason. It shows the internal heterogeneity of NUTS 2 units on which the policy is based. In the case of Poland, our analysis clearly shows that metropolitan areas are significantly richer than the periphery.
Summary and discussion
Since its inception in the late 1980s, the Cohesion Policy has been a key pillar of the European Union's activities, focusing on regional development. According to the latest EU budget proposal for the next programming period, set out in the Multiannual Financial Framework for 2028–2035, substantial funds – around EUR 450 billion, or a quarter of the total – will be allocated to supporting economic, social and territorial cohesion within the Community. There will be a particular focus on less developed regions (European Commission 2025). This paper addresses the need to analyse support for disadvantaged areas of the Community. The possible changes to the NUTS 2 classification in Poland, as outlined in the paper, entail the delineation of metropolitan areas and their functional hinterland from the remaining less developed parts of administrative regions. The rearrangement of territorial units to gain more CP funds is legally permissible in the EU. It has already been implemented by countries such as Lithuania, Portugal, Croatia and Poland (Zdrazil & Kraftova 2023; Rui André, 2022), while others, such as Bulgaria, are considering similar interventions (Ivanov 2017). While the changes described in this paper have their merits, there are also strong arguments against them.
On the one hand, rearrangement is the answer to the ineffectiveness of the Cohesion Policy in achieving its objectives. It facilitates the allocation of targeted financial support to less developed areas, where intervention is highly anticipated, as opposed to faster-developing areas. Supporting poorer, less developed subregions is a major step towards strengthening the European identity in these regions (Royuela & López-Bazo 2020). Conversely, if the disparities in socio-economic conditions and living standards between metropolitan and peripheral regions persist, individuals residing in left-behind areas may perceive themselves as losers in the process of European integration. This, in turn, may result in the rise of populism and discontent (Rodríguez-Pose 2018). Higher support for poorer areas would fit into the previously discussed concept of ‘territorial justice’. Also, the creation of smaller NUTS 2 regions, encompassing both more and less developed areas, is expected to facilitate the formulation of tailor-made, place-based development policies that more accurately reflect significant developmental factors and the desired trajectories of change (Barca, McCann & Rodríguez-Pose 2012; European Commission 2024). The rearrangement could reverse the recently reported process of convergence of regional strategies in terms of aims and ideas (Dąbrowska & Deegan 2024).
On the other hand, it must be acknowledged that the fairness of such administrative changes to other EU countries, and their alignment with the principles enshrined in the EU Treaties, is an open question. Not everyone believes in the idea of a ‘Europe of regions’, given that the countries in the EU have their own conflicting interests. Funds are not allocated uniformly across all Member States. If some countries or regions benefit from higher allocations, others suffer losses and may seek administrative changes to gain more. This unhealthy competition for resources within the EU is unnecessary. Accordingly, Cohesion Policy should not be conceptualised as a zero-sum mechanism characterised by static redistribution (Sudekum 2025) but, rather, formulated to create win–win scenarios (Wostner & Bachtler 2025). Furthermore, even within countries, governors and policymakers may have conflicting expectations and visions regarding the fair distribution of Cohesion Policy funds (Becker 2019). Losing access to EU funds could lead to a slower race towards competitiveness of more developed regions that often act as growth poles (Amendolagine, Prota & Serlenga 2024; Constantin & Radu 2019). If new arrangements are potentially controversial, their acceptance in Poland may become a political issue as well as a scientific and technical one, with all the pros and cons that that entails.
Moreover, although Cohesion Policy is implemented through financial instruments, its stakeholders should prioritise the relevance, efficiency, effectiveness and utilisation of available funding over the funding itself (Koudoumakis et al. 2022). Reforming Cohesion Policy remains important in order to help isolated, lagging provinces gain the ability to effectively absorb the allocated funds, and to ensure they have sufficient financial and institutional capacity (Charron 2016).
Swianiewicz et al. (2008) demonstrated that, in Poland, the effective absorption of EU funds at the local level is contingent on several factors; these include the financial situation of communes (local administrative units); the quality of personnel employed in a local administration and the leader's role (their experience, knowledge, capabilities) in initiating and supervising the application process and the projects’ implementation; and the thematic ‘match’ of intervention directions to the current development needs (Fuka, Lesakova & Bata 2018). Instead of larger funds, simpler procedures or more favourable spending schemes should be introduced to help poorer areas better benefit from EU funding (European Commission 2025).
Acknowledgments
The authors would like to thank the members of ERSA – Polish Section and three anonymous reviewers for their valuable – and critical – comments on the study. Cooperation between the authors on the study was facilitated by grant no. ID-UB 185/07/POB5/0034 at Adam Mickiewicz University, Poznań.
Appendices
Appendix 1.
Position of Polish regions in relation to EU regions
| Region | GDP/pc (as % of EU average) | Population share (in %) | ||
|---|---|---|---|---|
| Name | Code | 2015–2017(a) | 2022–2023(b) | 2023 |
| Malopolskie | PL21 | 62 | 70 | 9.0 |
| Slaskie | PL22 | 72 | 81** | 11.5 |
| Wielkopolskie | PL41 | 75** | 82** | 9.4 |
| Zachodniopomorskie | PL42 | 58 | 64 | 4.3 |
| Lubuskie | PL43 | 58 | 63 | 2.6 |
| Dolnoslaskie | PL51 | 77** | 84** | 7.8 |
| Opolskie | PL52 | 55 | 63 | 2.4 |
| Kujawsko-pomorskie | PL61 | 56 | 64 | 5.2 |
| Warmiñsko-mazurskie | PL62 | 49 | 55 | 3.5 |
| Pomorskie | PL63 | 67 | 76** | 6.3 |
| Lodzkie | PL71 | 65 | 74* | 6.4 |
| Swietokrzyskie | PL72 | 50 | 58 | 3.0 |
| Lubelskie | PL81 | 48 | 54 | 5.3 |
| Podkarpackie | PL82 | 48 | 55 | 5.3 |
| Podlaskie | PL84 | 50 | 61 | 2.9 |
| Warszawski stoleczny | PL91 | 149*** | 154*** | 9.1 |
| Mazowiecki regionalny | PL92 | 60 | 72* | 6.0 |
{ label (or @symbol) needed for fn[@id='j_mgrsd-2025-0050_tfn_016'] } Notes: (a) the average GDP/pc of 2015–2017 Cohesion Policy programming period (Regulation 2021/1060);
Source: own calculations based on Eurostat (2025a).