
Migration decisions have been widely analysed based on a cost-benefit assessment and the maximization of utility (Su et al. 2019; Bacolod et al. 2021). The motivation to migrate comes from an individual's desire to pursue better income, higher wages, better job opportunities and, ultimately, better living conditions in the destination (Chaplitskaya et al. 2024; Kinnan & Wang 2018; Munshi & Rosenzweig 2016). Therefore, migration decisions are influenced not only by inherent individual factors but also by specific characteristics of localities (Lucas 2015; Ackah & Medvedev 2012), as well as people's evaluation of the differences between the places of origin and destination (Chaplitskaya et al. 2024). People move to places because they are attracted not only by better job opportunities but also by better amenities (Albouy et al. 2021). One important amenity is the presence of universities, which attract not only students and professors but also firms that can profit from the professionals trained in those educational institutions. Universities, as centres of learning, constitute a triggering force that induces agglomeration. According to Everett Lee, universities constitute a pull factor (Faridi 2018), especially with regard to internal migration.
Liu (2015) indicates that the presence of universities has direct and indirect effects on the spatial distribution of populations. The direct effects are related to the direct migration both of families comprising children of higher education age and of education-related staff; the indirect effects are related to general migration, which is provoked by the economic development of cities and agglomeration economies where universities locate. Much of the literature focuses on the direct effects of specific universities or programmes on migration – educational migration. This literature is limited, without a comprehensive framework to fully understand the effects of universities on general migration. Regarding the literature on the role of universities in educational migration decisions, Bacolod et al. (2021), studying the Colombian situation, show that students who move to big cities for college, stay there for work. Concerning the interregional migration of students, distance, curriculum offerings, university prestige, and residency and tuition costs play a significant role (Weisser 2017; Santelli et al. 2020). Addessi et al. (2024) indicated that the attractiveness of universities also depends on the similarity between educational offerings and the local job market. Although these studies show the link between universities and the migration of students, it is worth noting that taking account of the incidence of cities where universities are located in the migration decision is unexplored. Universities are not isolated infrastructures with students and educational staff, they are immersed in an interconnected environment with other services, infrastructure, and cultural background. Therefore, the regional context where universities are located should influence migration decisions. A comprehensive framework is then needed to broadly understand the interrelationship between higher education, development of places, and migration forces.
Stemming from these considerations, the goal of this study is to provide evidence of the influence of the presence of universities on educational migration and on internal migration in general, while considering the economic development of the cities where universities are located.
Accordingly, the first hypothesis to be tested is a verification of the influence of universities in educational migration; the second hypothesis seeks to understand the influence of the broader panorama of cities where universities are located on internal migration, not just educational migration. Within this framework, the existing literature indicates, although separately, that other regional level variables, which have to be considered to explain internal migration flows, are population size, the level of wealth, the employment rate (Chaplitskaya et al. 2024; Su et al. 2019; Détang-Dessendre et al. 2008), the availability of public services (Su et al. 2019; Ackah & Medvedev 2012; Munshi & Rosenzweig 2016), and climate amenities (Su et al. 2019).
Hypothesis 1: Universities induce educational internal migration.
Hypothesis 2: Internal migration is driven by both the presence of universities and the economic development of regions.
The existing literature tackles the relationship between universities and economic development without looking at migration. In the analysis of the relationship between higher education and the economic development of cities, mixed results are obtained since the causal direction is not clear. On the one hand, higher education institutions contribute to regions in aspects such as human capital and creation of knowledge (Bilbokaitė & Bilbokaitė-Skiauterienė 2018). Universities, as centres of learning, constitute a triggering force that improves the attractiveness of regions where they are located, generating substantial positive effects on regional income through job opportunity creation and innovative clusters (Peng & Xu 2024), which induces more agglomeration (Drucker & Goldstein 2007). In fact, Apatov and Grimes (2017) show that regions with a higher number of universities per inhabitant experienced population and employment growth. Positive effects on employment and GDP growth rates might be the result of the investment in research and development by universities (Schubert & Kroll 2016; Hausman 2012). In addition, geographical proximity to universities allows industries to benefit from knowledge externalities (Lendel 2010). On the other hand, developed regions are attractive when selecting the location of universities. According to Miç and Antmen (2021), the location decision for universities depends on the development of a city in many respects, such as social, cultural, economic, and the ease of transportation. Such developed infrastructure in a city would allow universities to attract the attention of more qualified instructors and students. For these reasons, higher education institutions are generally created first in capital cities and big cities and, to a lesser extent, in small cities. Moreover, Lou et al. (2024) identified that, apart from accessibility and infrastructure, resilience to external factors is important in the site selection of higher education institutions.
A third option is possible: universities and economic development go hand in hand; they reinforce each other, consolidating a pull migration force. According to Varga (2000), spillovers from research carried out in universities can be used by firms in places with strong local agglomeration economies. Using the Griliches-Jaffe knowledge production function, Acs et al. (1994) and Varga (2000) show that universities positively influence the productivity of local economies and firms, especially small firms and localities with high technology infrastructure. As part of this positive feedback, a sorting process emerges in response to the heterogeneity of regions in economic terms and job opportunities. Skilled individuals choose to live in places with better labour conditions that are generally more developed economically. Thus, spatial productivity gaps emerge between regions. According to Diamond (2016), locations with a prevalence of skilled workers usually dispose of better urban amenities, which exacerbates the productivity gap between regions or leads to segregation.
Based on these observations, the third hypothesis is:
Hypothesis 3: Universities enhance the attractiveness of economically developed regions for internal migration.
To test the validity of these hypotheses, the case of Peru is used. Peru is of high relevance since the agglomeration pattern in this country shows prominent inequality. By 2022, Lima, the capital city, accounted for 29.32% of the total population (10.45 million out of 35.64 million) and 42% of the total number of firms (1.33 million firms out of 3.1 million firms). The evident predominance of Lima dates to the pre-Hispanic period when the Incas established their empire and, later, to colonial times when Lima, named the City of Kings by colonizers, was chosen as the capital of the Viceroyalty of Peru. In Republican times, Lima was established as the capital of the Republic of Peru in 1824. Since then, it has gained relevance in the country due to favouritism by the government. Regarding the educational offer, which is the focus of this study, 42.6% of the total number of universities in the country are concentrated in Lima. In this framework, young people or entire families, having no or a limited offer of universities in their places of origin, might seek to migrate to big cities with a more diverse educational offer and better availability. Upon finishing their careers, they would be very likely to stay and enter the labour market in such big cities, which generally offer more and better labour opportunities. In fact, Huarancca et al. (2020), in a Peruvian migration study, show that Lima registered more inter-departmental and intra-provincial migrants between 2012 and 2017 than other departments. This fact could indicate that the strong presence of higher education institutions in Lima might be a driver of internal migration to this city. After the process of licensing higher education institutions, the number of universities in this city fell from 118 in 2018 to 70 in 2022; almost 50 universities were closed. The share of universities in Lima with respect to the country also diminished from 42.4% in 2019 to 40.9% in 2022. Still, Lima is the city with the most universities at the national level. It is worth mentioning that, among citizens from 17 to 24 years old, Peru records a low rate of higher education attendance. Only 17.6% of the population in this age range attended higher education institutions in 2022 (National Institute of Statistics and Informatics 2023). In urban areas, the participation of young people in higher education is more than double that in rural areas, whereas ten years ago, it was more than triple. In the highland region, the participation rate in 2022 was 19%, whereas in the coastal and rainforest regions, it was 18% and 10%, respectively.
At the department level, we combined data on universities on the SUNEDU Register, from 2009 to 2022, with data on individuals from the National Household Survey. Using this data, logistic econometric models were estimated to determine the probability of migration for families comprising members of higher education age and the probability of migration for the population in general. Two samples were considered: families with children of higher education age and the population in general. To deal with the relevance of Lima, models were estimated including and excluding the Lima Metropolitan area.
The article is structured as follows: Section 2 describes the existing literature on internal migration and the role of universities; Section 3 describes the data and the methodology; Section 4 discusses the results; and Section 5 provides a conclusion.
We used the publicly available data from the National Household Survey (ENAHO, acronym in Spanish) from 2015 to 2022. The ENAHO survey is representative for urban and rural areas, as well as at the regional level. It collects information on demographic, socioeconomic, and employment characteristics of the Peruvian population. We combined this information with data on universities in each department, obtained from the National Superintendency of University Higher Education (SUNEDU 2022, acronym in Spanish). For this study, two samples were used: (i) the entire population, and (ii) households with members aged between 22 and 23 years who were about to enter university five years before the survey was conducted. The resulting database, using the whole population, accounted for information on 270,381 people from 2015 to 2022, whereas the database using households with children of university age accounted for 22,699 households over the same period. When analysing the evolution of university campuses, a significant decline is observed between 2018 and 2020, coinciding with the initiation of SUNEDU's licensing process. Notably, Metropolitan Lima reflected this trend.
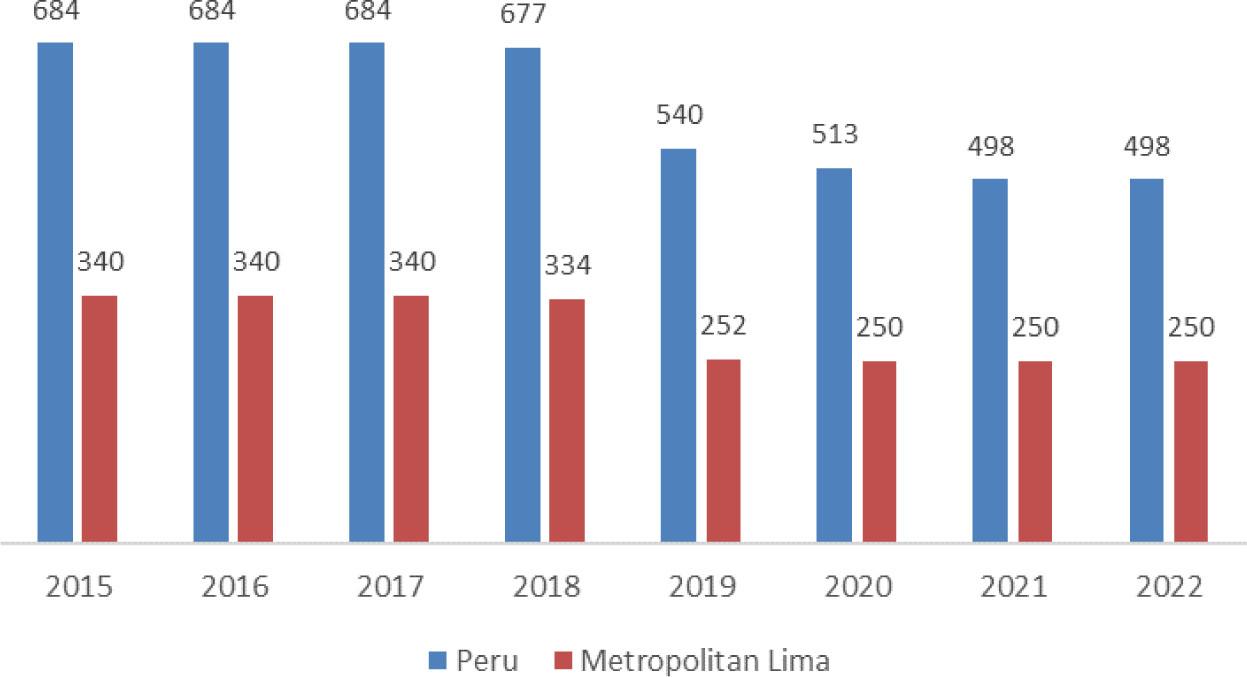
Evolution of university campuses in Peru and Metropolitan Lima 2015–2022
Metropolitan Lima encompasses the province of Lima within the department of Lima and the entire department of the Constitutional Province of Callao, while the remaining provinces in the department of Lima are referred to as Regional Lima.
Source: SUNEDU (2022); authors' elaboration
To analyse the household's choice to migrate between departments within the country, we estimate a binomial linear regression model, for which we assume a logistic link function. The logistic regression model is defined as:
Where P(migranti=1) is the probability that the i-th household migrates to a different department. The dichotomous variable migranti takes the value of 1 if the head of the household declares that, five years ago, they did not live in the department where they lived at the moment of the survey (department migrant household) and 0 if they respond that they had not moved at all (non-migrant household) or moved within the given department. This probability is explained, through a logistic link function, by the linear predictor ηi that contains the model's predictive variables such that:
In this model, Xji represents our main explanatory variable, the presence of universities, using two proxy variables: (i) the number of universities per million inhabitants in department j – Uji, and (ii) the number of high-quality university campuses per million inhabitants in each department j – HQUji. Vector c1 contains characteristics of the household i while c2 is a vector containing variables reflecting the economic development of the department j. Three alternatives to proxy economic development of a department are: population density, GDP per capita, and employment rate. Population density reflects the economic agglomeration in a region. However, since our variable of interest, the number of universities per million inhabitants contains population, the variable of population density is highly multicollinear, which causes instability of its coefficient estimation. GDP per capita is another commonly used proxy measure for economic development. However, in the case of Peru, GDP per capita is an inexact measure of economic development since some regions host mining projects that increase income of related firms but not of the population. The employment rate is a better measure of economic development of departments, avoiding problems of inconsistency and instability. For this reason, the employment rate is used as a measure of the economic development of departments.
To distinguish between migration for educational reasons and migration for economic reasons, two samples were used for the estimations: (i) households with members of higher education age, and (ii) the whole population.
Table 1 presents the variables used in our model with a detailed description and descriptive statistics. Regarding our dependent variable, migrant, the mean indicates that 1.8% of households have migrated from one department to another. As for our main explanatory variables, the number of universities per million inhabitants, ccdd_univ_pm, and the number of high-quality universities per million inhabitants, ccdd_hquniv_pm, the estimated means show an estimated average of 13.98 and 4.00 university campuses per million inhabitants in the destination department, respectively. The number of high-quality university campuses per million inhabitants is considerably smaller than the overall number of campuses.
Description of variables and descriptive statistics
| Variable | Description | Sample Mean | Sample Std Dev | Estimated Mean | Estimated Std Error |
|---|---|---|---|---|---|
| Dependent variable | |||||
| migrant | Dichotomous variable that takes the value of 1 if the household has migrated to a different department, and 0 if it is not a migrant household | 0.024 | 0.152 | 0.023 | 0.001 |
| Main explanatory variables (Xji from the model shown previously) | |||||
| ccdd_univ_pm | Number of university campuses per million inhabitants in the department where the household is located | 16.076 | 8.037 | 14.159 | 0.075 |
| ccdd_hquniv_pm | Number of high-quality university campuses per million inhabitants in the department where the household is located | 3.454 | 4.934 | 4.328 | 0.055 |
| Household characteristics (c1 from the model shown previously) | |||||
| head_age | Age of the head of the household | 49.463 | 13.679 | 49.894 | 0.148 |
| head_educ | Years of education of the head of the household | 8.858 | 4.835 | 9.089 | 0.050 |
| head_employment | Dichotomous variable that takes the value of 1 if the head of the household is employed, and 0 otherwise | 0.868 | 0.338 | 0.849 | 0.004 |
| dep_ratio | Dependence ratio between the number of unemployed and employed household members | 0.356 | 0.233 | 0.345 | 0.002 |
| ln_income | Yearly log-income (PEN) | 10.351 | 0.788 | 10.452 | 0.008 |
| ln_rent_exp | Yearly rent log-expenditure (PEN). For households that do not pay rent or own their homes, we impute the estimated income that would be earned if the house were rented out | 7.684 | 1.155 | 7.908 | 0.0127 |
| Department characteristics (c2 from the model shown previously) | |||||
| ccdd_rural | Percentage of people residing in rural areas in the destination department | 0.257 | 0.192 | 0.198 | 0.003 |
| ccdd_water | Percentage of people with access to public network water supply in the destination department | 0.848 | 0.105 | 0.869 | 0.001 |
| ccdd_employment | Employment rate of the destination department | 0.947 | 0.027 | 0.936 | 0.000 |
| ccdd_crime | Percentage of population older than 14 that have been the victim of a crime in the destination department | 0.234 | 0.076 | 0.252 | 0.001 |
Source: own study
The average head of the household is 52 years old, with 8.5 years of education and with an 81% probability of being employed. The average of the household dependency ratio is 0.32, indicating that there are 3.2 employed members for every 10 unemployed members. The mean of the yearly log-income is 10.1, and the mean yearly log-rent expenditure is 7.78. Regarding the characteristics of departments, the average Peruvian department has 22.5% of its population residing in rural areas, 86.7% of people receiving publicly supplied water, a 93.8% employment rate, a 24.6% crime rate, and an average gross domestic product (GDP) per capita of 8.587, in logarithm.
The variable about the quality of higher education, ccdd_hquniv_pm, was constructed using the National Superintendence of University Higher Education (2021) University Ranking, which analyses the Institutional Performance in Research using three indicators: (1) scientific production per faculty member; (2) scientific impact, measured through the H5 index (2014–2018); and (3) international excellence, measured as the number of research documents included in the top 10% of the most cited publications worldwide. Based on the value of the institutional performance index, universities are ranked and classified into four categories: low (4th quartile), medium-low (3rd quartile), medium-high (2nd quartile), and high (1st quartile). Considering this, the variable of quality of higher education in each department is computed as the number of universities in the 1st quartile in a given department per million inhabitants.
It is worth noting that after the estimation using all the variables, the Variance Inflation Factor (VIF) remains within acceptable limits, so multicollinearity is not an issue in our estimations (see Appendix A).
This section presents the empirical results on the testing of our three hypotheses in tables 2, 3, and 4. Table 2 shows the results using two samples: (i) the entire population, and (ii) households comprising members of higher education age. It also shows different specifications of the model, including the variable of universities without the variables of economic development (columns 1 and 5), the variable of economic development without the variable of universities (columns 2 and 6), both variables of economic development and universities (columns 3 and 7), and an interaction term between universities and economic development (columns 4 and 8). Table 3 presents the same specifications as Table 2 for both samples without Lima. This approach allows us to examine the sensitivity of our results and assess the robustness of our estimates. Table 4 shows the results using the number of high-quality universities per million inhabitants.
Model estimation results with the number of universities per million inhabitants, including Lima
| With Lima | ||||||||
|---|---|---|---|---|---|---|---|---|
| All households | Households comprising members with higher education | |||||||
| Variables | (1) | (2) | (3) | (4) | (5) | (6) | (7) | (8) |
| Odds Ratios – variables of interest | ||||||||
| ccdd_univ_pm | 1.021*** (0.003) | 1.018*** (.003) | 1.126 (.155) | 1.017*** (.007) | 1.017*** (.007) | .737 (.285) | ||
| ccdd_employment | 6049.902*** (7929.715) | 2766.937*** (3603.884) | 10918.55 ***(28106.05) | 4.343 (15.010) | 1.943 (6.710) | .028 (.193) | ||
| ccdd_univ_pm ## ccdd_employment | .899 (.130) | 1.401 (.568) | ||||||
| Average Marginal Effects | ||||||||
| ccdd_univ_pm | .00036*** (.00005) | .00031*** (.00005) | .00035* (.00015) | .00034* (.00015) | ||||
| ccdd_employment | .15353*** (.02278) | .13967*** (.02270) | .03037 (.07113) | .01373 (.07124) | ||||
| head_age | −.00119*** (.00005) | −.00120*** (.00005) | −.00119*** (.00000) | −.00202*** (.00016) | −.00202*** (.00016) | −.00202*** (.00016) | ||
| head_educ | .00079*** (.00012) | .00080*** (.00012) | .00078*** (.00012) | −.00029 (.00042) | −.00027 (.00042) | −.00029 (.00042) | ||
| head_employment | −.00917*** (.00122) | −.00952*** (.00122) | −.00942*** (.00122) | −.00122 (.00447) | −.00135 (.00448) | −.00123 (.00448) | ||
| dep_ratio | −.01184*** (.00165) | −.01191*** (.00165) | −.01195*** (.00165) | −.01725** (.00552) | −.01713** (.00552) | −.01726** (.00555) | ||
| ln_income | −.0014* (0.0001) | −.00156** (.00061) | −.00164** (.00061) | −.00460* (.00196) | −.00458* (.00198) | −.00463* (.00196) | ||
| ln_rent_expenditure | .00156** (.00052) | .00182** (.00052) | .00187*** (.00052) | .07461*** (.01883) | .00746*** (.00182) | .00749*** (.00182) | ||
| ccdd_rural | .00261 (.00236) | −.00949** (.00278) | −.00809** (.00279) | .00034 (.00757) | −.00175 (.00888) | −.00030 (.00895) | ||
| ccdd_water | .00055 (.00399) | .00111 (.00416) | −.00017 (.00385) | .01053 (.01089) | .01227 (.01157) | .01042 (.01078) | ||
| ccdd_crime | −.02467*** (.00631) | −.01074 (.00617) | −.01518* (.00615) | .01689 (.01907) | .02306 (.01934) | .01782 (.01943) | ||
| Time FE | Yes | Yes | Yes | Yes | Yes | Yes | ||
| Sample | 270,381 | 270,381 | 270,381 | 26,285 | 26,285 | 26,285 | ||
| Wald Test – Statistic | 85.84 | 84.50 | 84.34 | 28.59 | 28.35 | 27.14 | ||
| Wald Test – Pvalue | 0.00 | 0.00 | 0.00 | 0.00 | 0.00 | 0.00 | ||
| Sensitivity | 0.5619 | 0.5522 | 0.5684 | 0.6981 | 0.6949 | 0.6981 | ||
| Specificity | 0.8184 | 0.8233 | 0.8131 | 0.8402 | 0.8454 | 0.8402 | ||
| Correctly classified | 0.8130 | 0.8177 | 0.8079 | 0.8368 | 0.8418 | 0.8368 | ||
| AUC | 0.6901 | 0.6877 | 0.6907 | 0.7691 | 0.7701 | 0.7691 | ||
Notes: Delta-method or robust standard errors in parenthesis.
p<0.01,
p<0.05,
p<0.1
Source: own study
Model estimation results with the number of universities per million inhabitants, excluding Lima
| Without Lima | ||||||||
|---|---|---|---|---|---|---|---|---|
| All households | Households comprising members with higher education | |||||||
| Variables | (1) | (2) | (3) | (4) | (5) | (6) | (7) | (8) |
| Odds Ratios – variables of interest | ||||||||
| ccdd_univ_pm | 1.019*** (.003) | 1.019*** (.003) | 1.064 (.160) | 1.019*** (.008) | 1.019*** (0.008) | .865 (.354) | ||
| ccdd_employment | 16500.63*** (28099.76) | 12858.91*** (21430.55) | 26545.38*** (87638.4) | 93.032 (372.544) | 61.370 (240.440) | 3.996 (32.337) | ||
| ccdd_univ_pm * ccdd_employment | .956 (.151) | 1.187 (.510) | ||||||
| Average Marginal Effects | ||||||||
| ccdd_univ_pm | .00034*** (.00005) | .00034*** (.00005) | .00038** (.00014) | .00037* (.00014) | ||||
| ccdd_employment | .17368*** (.03066) | .16910*** (.02999) | .08940 (.07838) | .08110 (.07664) | ||||
| head_age | −.00112*** (.00004) | −.00112*** (.00004) | −.00112*** (.00004) | −.00186*** (.00015) | −.00186*** (.00015) | −.00185*** (.00015) | ||
| head_educ | .00104*** (.00011) | .00106*** (.00011) | .00101*** (.00011) | .00007 (.00035) | .00009 (.00035) | .00007 (.00035) | ||
| head_employment | −.00843*** (.00118) | −.00880*** (.00121) | −.00867*** (.00122) | −.00080 (.00420) | −.00102 (.00420) | −.00112 (.00420) | ||
| dep_ratio | −.00815*** (.00154) | −.00826*** (.00154) | −.00830*** (.00154) | −.00245 (.00537) | −.00237 (.00539) | −.00256 (.00537) | ||
| ln_income | −.00077 (.00059) | −.00073 (.00060) | −.00088 (.00060) | −.00060 (.00208) | −.00053 (.00209) | −.00061 (.00207) | ||
| ln_rent_expenditure | .00110* (.00049) | .00118* (.00049) | .00117* (.00048) | .00380* (.00153) | .00388* (.00153) | .00339* (.00154) | ||
| ccdd_rural | .00122 (.00244) | −.00825** (.00273) | −.00593* (.00274) | .00480 (.00758) | −.00154 (.00814) | .00119 (.00815) | ||
| ccdd_water | −.00006 (.00390) | −.00067 (.00420) | −.00276 (.00384) | .00983 (.01030) | .01143 (.01121) | .00873 (.01021) | ||
| ccdd_crime | −.02105** (.00680) | −.01276 (.00658) | −.01931** (.00667) | .00470 (.01981) | .01374 (.01941) | .00591 (.01978) | ||
| Time FE | Yes | Yes | Yes | Yes | Yes | Yes | Yes | Yes |
| Sample | 239,639 | 239,639 | 239,639 | 239,639 | 22,699 | 22,699 | 22,699 | 22,699 |
| Wald Test – Statistic | 111.04 | 107.64 | 107.20 | 23.50 | 23.35 | 22.40 | ||
| Wald Test – Pvalue | 0.00 | 0.00 | 0.00 | 0.00 | 0.00 | 0.00 | ||
| Sensitivity | 0.6981 | 0.5687 | 0.5870 | 0.7106 | 0.7050 | 0.7124 | ||
| Specificity | 0.8402 | 0.8163 | 0.8045 | 0.8326 | 0.8384 | 0.8323 | ||
| Correctly classified | 0.8368 | 0.8110 | 0.7999 | 0.8297 | 0.8352 | 0.8295 | ||
| AUC | 0.6939 | 0.6925 | 0.6958 | 0.7716 | 0.7717 | 0.7724 | ||
Notes: Delta-method or robust standard errors in parenthesis.
p<0.01,
p<0.05,
p<0.1
Source: own study
Model estimation results with high-quality universities per million inhabitants
| With Lima | Without Lima | |||||||
|---|---|---|---|---|---|---|---|---|
| All households | Households comprising members with higher education | All households | Households comprising members with higher education | |||||
| Variables | (1) | (2) | (3) | (4) | (5) | (6) | (7) | (8) |
| Odds Ratios – variables of interest | ||||||||
| ccdd_hquniv_pm | 1.00883 (.00551) | 1.76362* (.42924) | 1.02472 (.01415) | 3.15456 (1.93880) | 1.00679 (.00560) | 1.51493 (.39645) | 1.02565 (0.01474) | 2.17189 (1.39837) |
| ccdd_employment | 8489.087*** (11343.70000) | 334249.50*** (661539.80) | 10.67778 (37.84495) | 30282.80* (155374.50}) | 21476.780*** (36577.700) | 153989.80*** (320713.90) | 276.35070 (1097.77899) | 13048.570 (66789.360) |
| ccdd_hquniv_pm ## ccdd_employment | .55533* (.14235) | .30605 (.19799) | .65026 (.17918) | 0.45388 (0.30737) | ||||
| Average Marginal Effects | ||||||||
| ccdd_hquniv_pm | .00016 (.00010) | .00050 (.00029) | 0.00012 (0.00010) | 0.00045 (0.00028) | ||||
| ccdd_employment | .15950*** (.02325) | .04895 (.07272) | 0.17839*** (0.02999) | 0.11080 (0.07751) | ||||
| head_age | −.00119*** (.00049) | −.00202*** (.00016) | −0.00112*** (0.00004) | −0.00186*** (0.00015) | ||||
| head_educ | .00080*** (.00012) | −.00026 (.00040) | 0.00106*** (0.00011) | 0.00090 (0.00035) | ||||
| head_employment | −.00951*** (.00122) | −.00129 (.00448) | −0.00879*** (0.00122) | −0.00113 (0.00420) | ||||
| dep_ratio | −.01195*** (.00165) | −.01719** (.00552) | −0.00381*** (0.00154) | −0.00260 (0.00539) | ||||
| ln_income | −.00159** (.00061) | −.00466* (.00198) | −0.00075 (0.00060) | −0.00060 (0.00208) | ||||
| ln_rent_expenditure | .00178** (.00052) | .00731*** (.00184) | 0.00119* (0.00048) | 0.00371* (0.00155) | ||||
| ccdd_rural | −.00876** (.00273) | .00125 (.00877) | −0.00795** (0.00274) | 0.00087 (0.00815) | ||||
| ccdd_water | .00394 (.00457) | .02112 (.01335) | 0.00172 (0.00384) | 0.02108 (0.01346) | ||||
| ccdd_crime | −.01342* (.00652) | .01529 (.02077) | −0.01462** (0.00667) | 0.00612 (0.02069) | ||||
| Time FE | Yes | Yes | Yes | Yes | Yes | Yes | Yes | Yes |
| Sample | 270.381 | 270.381 | 26.285 | 26.285 | 239.639 | 239.639 | 22.699 | 22.699 |
| Wald Test – Statistic | 79.98 | 27.00 | 101.92 | 22.15 | ||||
| Wald Test – Pvalue | 0.00 | 0.00 | 0.00 | 0.00 | ||||
| Sensitivity | 0.5506 | 0.6949 | 0.5656 | 0.7069 | ||||
| Specificity | 0.8239 | 0.8449 | 0.8161 | 0.8387 | ||||
| Correctly classified | 0.8182 | 0.8414 | 0.8108 | 0.8356 | ||||
| AUC | 0.6872 | 0.7699 | 0.6908 | 0.7728 | ||||
Notes: Delta-method or robust standard errors in parenthesis.
p<0.01,
p<0.05,
p<0.1
Source: own study
All estimations are conducted using frequency weights of the sample design of the survey. The odds-ratio results of our estimations are presented in Appendix B. The model coefficients are estimated using the maximum likelihood method, implemented through the Newton-Raphson iterative process. All variables have consistent estimates across different specifications of our model, indicating robustness. Furthermore, at an optimal cut-off point of 0.03, models incorporating the full set of variables exhibit superior predictive power, as demonstrated by both the percentage of correct classification and AUC estimates approaching 1. This predictive strength is further substantiated by the true positive and true negative cases, with sensitivity and specificity values of 60% and 83%, respectively. Notably, specificity exhibits a stronger performance. For the analysis of the first hypothesis, related to the effect of universities in educational migration, model specifications between columns 5 and 8 in Tables 2 and 3, using the sample of households with children of higher education age, are used. When including the number of universities per million inhabitants without the employment rate, the proxy of economic development (column 5 of tables 2 and 3), our results show a significant and positive effect of universities on the probability of migrating for households comprising members of higher education age. However, this result might be biased since universities could not be the only factor affecting migration; the economic development of a region is another attractive factor related to migration. When including economic development, using the proxy employment rate in the destination region (specification 7), the effect of the number of universities per million inhabitants is still significant and positive for educational migration. This result holds true when excluding Lima from the sample. The effect of universities is robust across specifications and samples, which indicates that a stronger presence of universities in regions consistently drives educational migration. In line with the existing literature, the presence of universities in a region generates direct effects on migration (Liu 2015), attracting families with children of higher education age in Peru. Our results validate the first hypothesis that universities induce educational migration. Young people of higher education age are more prone to migrate across departments when the number of universities increases in the destination department.
In addition to the presence of higher education institutions, migration patterns might be influenced by their quality and prestige (Weisser 2017; Santelli et al. 2020) as individuals seek better educational opportunities for improved labour market outcomes in the future. To complete the testing on the first hypothesis, the number of high-quality university campuses per million inhabitants was considered. When analysing the quality of universities, the results from Table 4 show that one additional high-quality university campus per million inhabitants is not associated with the probability that a household migrates in most specifications. The lack of significance of this variable in both samples – households comprising members of university age and the whole population – indicates that the quality of universities does not influence educational migration nor economic migration. This pattern persists even when excluding observations from Metropolitan Lima. Migration decisions seem to be more influenced by the pursuit of higher education in general than high-quality higher education. This result is in line with Czajkowski et al. 2020, who note that individuals, particularly first-generation students, often conceive a higher education degree as a signalling tool for the labour market rather than a means to accumulate human capital. People might prefer enrolling in less prestigious and less demanding universities to achieve degree completion with less effort (Meier & Schiopu 2015). In our analysis, this explanation might be discarded since, in Peru, a low share of the population has access to higher education. Therefore, families are not very likely to migrate for educational purposes. For the population that can access higher education institutions, they would engage in local higher education institutions rather than engage in out-of-department institutions with better quality higher education. Regarding our first hypothesis – that universities induce educational migration in Peru – the insignificant effect of the quality of higher education on migration indicates that the quality of higher education institutions does not lead to migration.
The previous results led us to analyse the effect of universities on the probability of migrating for the population in general to complete the picture of migration responses to the presence of universities. The results, shown in column 1 of Table 2, indicate that, for the population in general, one additional university campus per million inhabitants is associated with an increase in the probability that a household migrates. To disentangle whether this effect of universities on migration is robust, the employment rate, an economic indicator of the attractiveness of a region in terms of migration, is included in specification 3. The results indicate that not only universities genuinely attract internal migration but also that the economic development of the region (employment rate) drives migration. Therefore, our second hypothesis – that internal migration is driven by a mixture of the presence of universities and the economic development of regions – is validated. While the literature points out that developed regions attract universities to locate there (Miç & Antmen 2021), our results show evidence of the separate effects of economic development and universities on migration. The regional context, the dynamics in which universities are immersed, and universities themselves influence internal migration. Moreover, universities attract people beyond educational motives, generating agglomeration economies in cities where they locate. This result supports the existence of indirect effects of universities on internal migration, described by Liu (2015). When excluding Metropolitan Lima, the effect of the number of universities per million inhabitants is still significant and positive for internal migration.
Looking at the effect of the employment rate in specifications 2, 3, 6, and 7, it is significant and positive only for migration in general. This indicates that the economic development of regions, using the proxy employment rate, is a pull factor for internal migration in general, but not necessarily for educational migration. The migration of families with members of higher education age is mainly driven by the presence of universities, rather than the economic development of regions.
To test the third hypothesis – that universities enhance the attractiveness of economically developed regions for internal migration – we include an interaction variable between the employment rate and the number of universities per capita. Our odds-ratio results, shown in columns 4 and 8, indicate that the interaction term is not significant to explain the probability of migrating. This result shows that the economic development and the presence of universities do not reinforce each other to attract migration. Although many scholars assume that the effect of universities on economic development induce immigration flows without really testing it (Liu 2015; Apatov & Grimes 2017), our results show evidence that universities do not influence the relationship between economic development and migration. Therefore, this result does not comply with the third hypothesis.
Regarding control variables, the age of the head of the household is a key individual feature that determines whether a household, with members of higher education age or not, chooses to migrate or not – an additional year is significantly associated with a decrease in the probability of the household migrating. This finding is consistent with research by Chen and Rosenthal (2008) and Détang-Dessendre et al. (2008), which shows that younger individuals are more likely to migrate, as they prioritize career development and are less tied to property ownership or accumulated assets. Older heads of the household are less likely to migrate compared to younger ones due to more established households in the sense of property ownership, asset accumulation, and established social networks (Berck et al. 2014). As the level of education increases, the probability of migrating for the population in general increases. This result is in line with Chen and Rosenthal (2008), who argued that highly educated households tend to move towards places with higher quality business environments and prioritize their career development. Although this effect is positive for educational migration, it is not significant. Within the framework of migration of the population in general, employed people are less likely to migrate than unemployed people; migration is a good alternative to look for better economic opportunities (Kinnan & Wang 2018). The result of the employment status shows that when income levels increase, the probability of migrating reduces, showing that economic stability is a deterrent factor for migration. When the number of unemployed household members increases with respect to the number of employed household members, the probability of migrating decreases, which might indicate that big families are less likely to migrate. An increase in rent expenditure is associated with a higher probability of migrating. This result can be explained by a positive association between rent expenditure in one place and amenities there. Areas with superior amenities exhibit higher costs of living, including rent (Ackah & Medvedev 2012; Su et al. 2019) since better amenities attract more people, leading to stronger competition for land, which, in turn, leads to more expensive rents. Although financial costs are disincentives for migration (Lucas 2015), amenities in the destination overcompensate land costs. Regarding the contextual variables, when a higher percentage of the population in the destination lives in rural areas, the probability of migrating decreases. Rural places might not be attractive for people to live due to scarcity of urban infrastructure. Likewise, when a higher proportion of people have been the victim of a crime in the destination, the probability of migrating to such place reduces.
This study analysed the relationship between the probability of migrating across departments and the presence of universities in Peru at the regional level. Combining survey and administrative data for the 2015–2022 period, we estimate probabilistic logit regression models using two types of populations: families with members of university age and the whole population. This distinction was made to differentiate between educational migration and general migration. Our results allowed us to validate three established hypotheses. The first hypothesis – that universities induce educational internal migration – was validated since the presence of universities positively influences the probability of migrating for households comprising members of higher education age. This result is robust to different specifications of the model and different samples (including and excluding Lima). When considering the presence of high-quality universities, this showed no effect on educational migration. It seems that higher education is often viewed as a signalling mechanism for the labour market rather than a means of human capital accumulation. Consequently, the pursuit of high-quality higher education may not be a strong driver for migration, particularly when relocation – mainly to Metropolitan Lima – requires significant financial investment for individuals from other regions.
To disentangle whether the effect of the presence of universities is merely related to educational migration or whether it is related to economic migration, the whole population was analysed. The results show that universities attract migrants of all types, not only for educational reasons but for other reasons related to agglomeration economies generated by universities. In addition, the economic development of regions, using the proxy employment rate, was also significant to explain the probability of migrating for the population in general. This result confirms the validity of the second hypothesis – that internal migration is driven by a mixture of the presence of universities and the economic development of regions. Given the theoretical relationship between universities and economic development, this study contributes to analysing how this relationship affects migration patterns. Our findings show that the presence of universities does not influence the relationship between economic development and migration. Thus, our third hypothesis – that universities and economic development reinforce each other to impact migration – was not validated.
Indicators of economic stability, such as being employed, being older, and having high levels of income, emerge as deterrent factors for migration. Higher expected rent in the destination is associated with the increased probability of migrating. This reflects the positive relationship between higher rents and the availability of better amenities, which serve as attractive factors for migration. Notably, this effect is more pronounced than that of the household income, demonstrating the greater influence of land prices, using the proxy of expected rent expenditure in the destination department. Furthermore, higher land prices tend to correspond with increased wages, driven by the urban wage premium that companies offer to workers to offset high costs of living in big and expensive urban areas.
Based on our analysis, several key recommendations for policymakers and stakeholders emerge. Given that Peru's capital city concentrates most universities and high-quality institutions, and that individuals from non-capital regions are less inclined to migrate for educational purposes, especially for high-quality education, it is essential to enhance the provision of educational institutions in regions outside the capital. To improve the quality of human capital in these areas, both the number and quality of universities must be significantly increased beyond the geographical boundaries of Metropolitan Lima. Furthermore, recognizing that better amenities increase migration incentives, there is a pressing need for sustained investment in infrastructure and services in non-capital regions. Individuals from these areas often face trade-offs between migrating to larger cities, which offer higher wages and specialized labour markets, and staying in their local regions with lower living costs. To address this, the government should focus on improving amenities in non-capital regions, ensuring that individuals in each department have access to high-quality services and educational opportunities within their local areas. Likewise, it is important to focus on the economic development (employment rate) of lagging regions to attract more people and, thereby, reduce the risk of depopulation and economic decline.