
Figure 1.
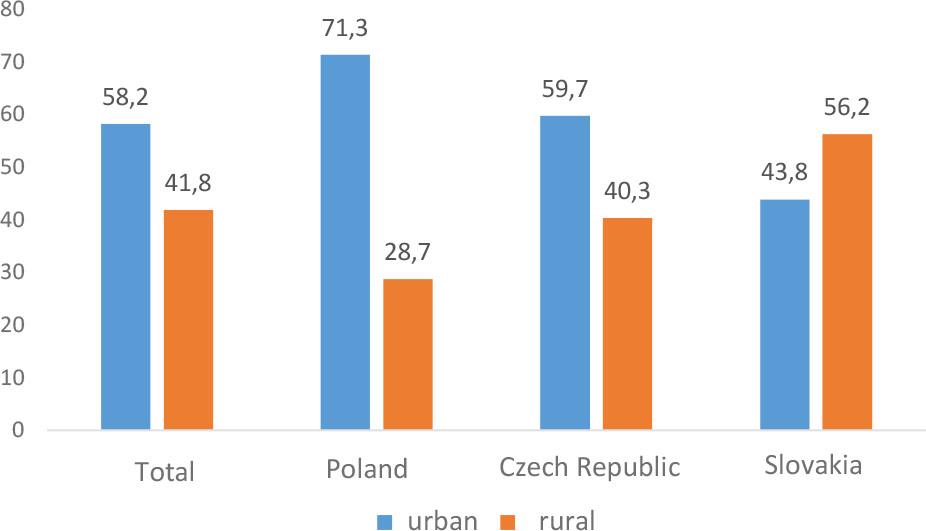
Figure 2.
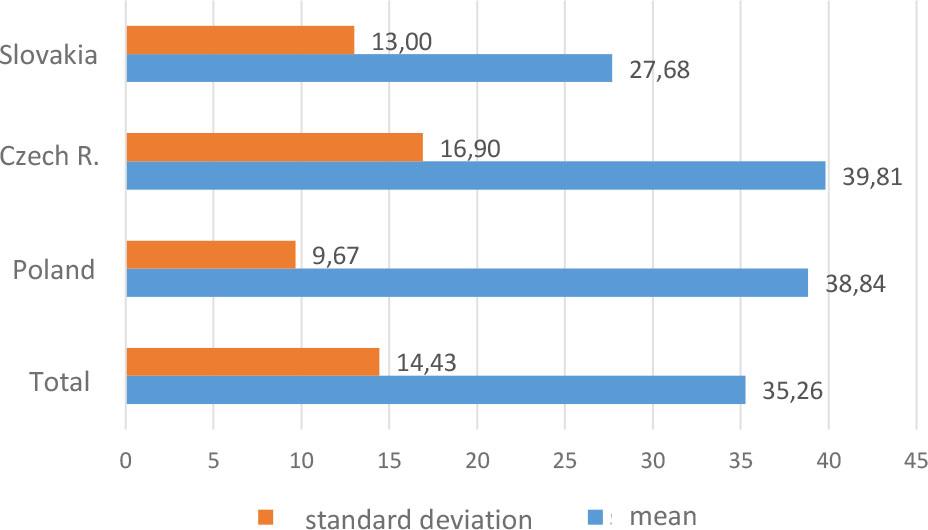
Figure 3.
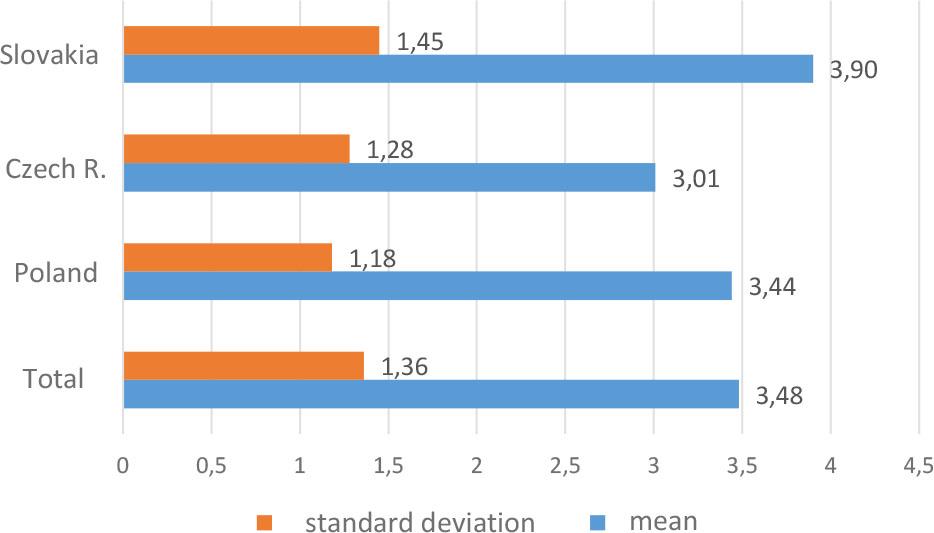
Figure 4.
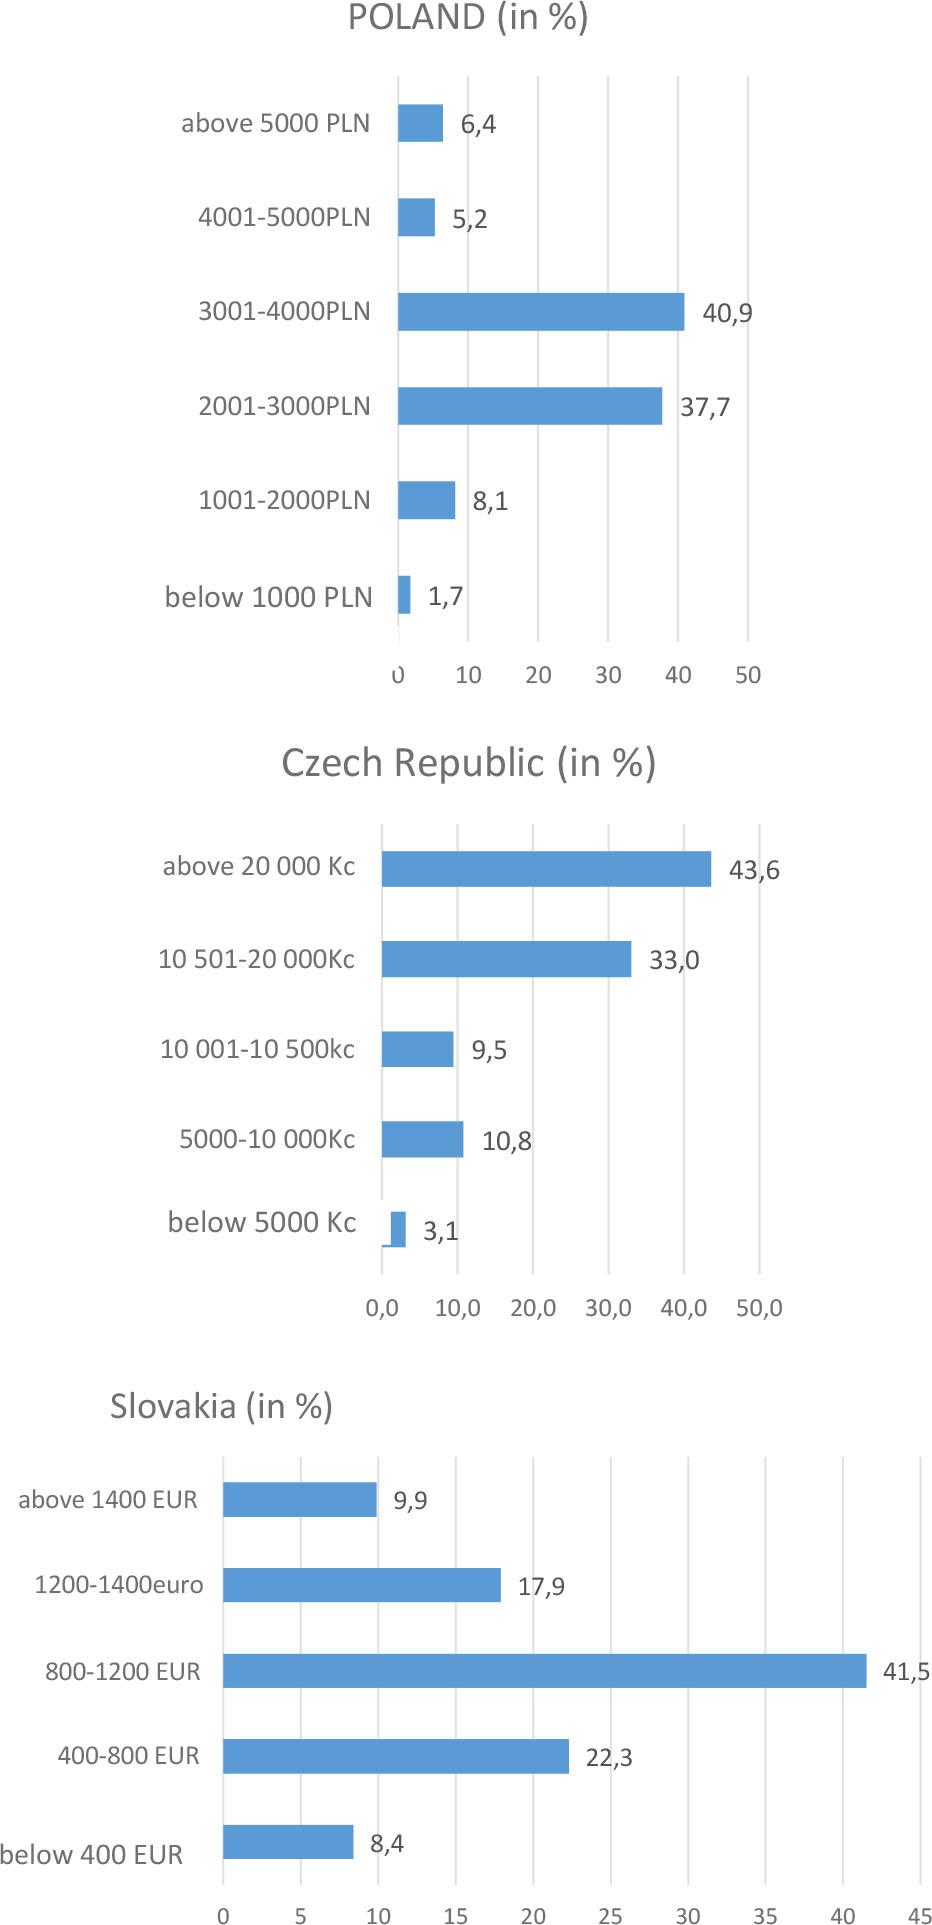
Figure 5.
Reasons for throwing away food in households – mean reported frequency*
| Description | Total | Poland | Czech Republic | Slovakia | p – significance level S – Spearman’s correlation ratio |
|---|---|---|---|---|---|
| Food spoilage | 3.56 (n*=54) | 3.87 (n=1) | 3.35 (n=19) | 3.44 (n=34) | p=0.000 |
| Exceeding expiry date | 3.17 (n=124) | 3.83 (n=11) | 2.49 (n=69) | 3.10 (n=44) | p=0.000 |
| Preparing too much food (e.g. for holidays) | 2.77 (n=243) | 3.45 (n=26) | 1.97 (n=124) | 2.76 (n=93) | p=0.000 |
| Buying too much food | 2.47 (n=326) | 3.10 (n=43) | 1.77 (n=170) | 2.42 (n=113) | p=0.000 |
| Excessive meals | 2.44 (n=332) | 3.08 (n=36) | 1.67 (n=190) | 2.44 (n=106) | p=0.000 |
| Improper storage conditions | 2.18 (n=469) | 3.02 (n=63) | 1.46 (n=212) | 1.95 (n=194) | p=0.000 |
| Lack or insufficient culinary skills | 1.99 (n=647) | 2.94 (n=97) | 1.10 (n=311) | 1.79 (n=239) | p=0.000 |
| Lack of ideas for using ingredients to prepare meals | 2.08 (n=639) | 3.13 (n=82) | 1.11 (n=330) | 1.87 (n=227) | p=0.000 |
| Low product quality | 2.33 (n=443) | 3.19 (n=57) | 1.50 (n=220) | 2.18 (n=166) | p=0.000 |
| Too much packaging | 2.39 (n=406) | 3.23 (n=54) | 1.56 (n=219) | 2.27 (n=133) | p=0.000 |
| Badly planned shopping (no shopping list) | 2.31 (n=506) | 3.15 (n=67) | 1.48 (n=247) | 2.18 (n=192) | p=0.000 |
| Impulse purchases | 2.33 (n=463) | 3.15 (n=55) | 1.54 (n=235) | 2.20 (n=173) | p=0.000 |
| Purchases motivated by promotions | 2.33 (n=477) | 3.19 (n=57) | 1.58 (n=241) | 2.10 (n=179) | p=0.000 |
| Low food prices lead to lack of foresight and, later on, food waste | 2.36 (n=461) | 3.14 (n=83) | 1.58 (n=223) | 2.24 (n=155) | p=0.000 |
Grocery shopping patterns in households in Poland, the Czech Republic and Slovakia [%]
| Description | Total | Poland | Czech Republic | Slovakia |
|---|---|---|---|---|
| I do bigger shops every few days or less often; later on, I buy other products that I currently need or that I forgot to buy | 47.0 | 42.4 | 49.9 | 49.1 |
| I do bigger shops every few days or less often; I generally do not buy other products later on | 21.6 | 31.4 | 12.7 | 19.5 |
| I do not have a dominant shopping strategy and I often change my behaviour in this respect | 15.1 | 15.1 | 15.2 | 14.9 |
| I buy food often, as required, and I generally avoid overbuying | 13.1 | 8.5 | 18.4 | 13.2 |
| I buy food every day | 3.2 | 2.6 | 3.8 | 3.3 |
| Total | 100.0 | 100.0 | 100.0 | 100.0 |
Frequency of throwing away food in the respondents’ households (%)
| Description | Total | Poland | Czech Republic | Slovakia |
|---|---|---|---|---|
| Every day | 3.7 | 1.1 | 3.1 | 6.7 |
| 2–3 times a week | 13.3 | 10.5 | 11.5 | 17.7 |
| Once a week | 27.1 | 19.7 | 29.5 | 32.3 |
| 2–3 times a month | 25.6 | 35.0 | 23.2 | 18.1 |
| Once a month or less | 30.4 | 33.7 | 32.7 | 25.2 |