
An analysis of consumption patterns in households in the context of waste generation allows us to define the following categories of waste: product packaging, leftovers, expired food, used-up products, unused products (Sadowy 2014). Households also contribute to the increasing share of packaging waste, both in terms of quantity and weight. This is driven by the pursuit of convenience, a rising standard of living and the growing demand for ready-to-eat meals. (Holotová, Nagyová & Holota 2020).
An alternative system categorizes waste into food and green waste, paper and cardboard, plastic, glass, metal, rubber and leather, wood and other (Statista 2016). European Union legislation defines very broad categories; waste classification can be found in Directive 2008/98/EC of the European Parliament and of the Council of 19 November 2008 on waste and repealing certain Directives (European Parliament 2008). For the purpose of this study, it is assumed that the most adequate classification of waste is the division into packaging, food, clothes and shoes (textiles), white and brown goods (household appliances), construction materials and bulk waste.
Food is a waste category that has a significant effect both on the structure of household spending and challenges related to the implementation of the Sustainable Development Goals (UNIC Warsaw 2024).
Although food waste levels is a worldwide problem linked to a number of issues, it should be noted that its scale varies by country. Eurostat data indicate that, in 2021, the quantity of food waste per inhabitant in EU countries was 131 kg (Eurostat 2024).
Any attempt to discuss the subject of food waste needs to start from three basic terms supplied by the Food and Agriculture Organization of the United Nations (FAO): food loss, food waste and food wastage. According to the definitions provided by FAO (2013), food loss refers to the reduction in mass or nutritional value of food originally intended for human consumption. This phenomenon mainly results from inefficiencies in food supply chains, such as poor infrastructure, limited access to technology, insufficient skills and management capabilities among market participants, and difficulties in accessing markets. Natural disasters can also contribute to food loss. Food waste, on the other hand, refers to the discarding of food that is still suitable for human consumption, regardless of whether its expiration date has passed or whether it has been discarded due to over-purchasing or inappropriate consumer habits. The term food wastage encompasses both food loss and food waste, and refers to any food that is lost through spoilage or mismanagement.
Food wastage is a part of consumer behaviour and depends on a number of factors, which may be classified as socio-demographic, psychographic, (1) economic, or those related to environmental awareness (in terms of the impact of food production and waste on the environment). Household size is a leading socio-demographic factor (Aschemann-Witzel et al. 2015). Özbük and Coşkun (2020) also mentioned age, sex and ethnic origin as demographic factors. On the other hand, Janssens et al. (2019) emphasized education level as an important factor in food waste. Other factors revealed by researchers include socio-economic status and employment status. These have an impact on food choices and, by extension, on food waste (Pimentel, Misopoulos & Davies 2022). Further factors cited by researchers include environmental attitudes (Stancu, Haugaard & Lähteenmäki) and moral attitudes (Visschers, Wickli & Siegrist 2016).
Another noteworthy phenomenon is the so-called plate waste, a form of food waste present not only in households, but also in restaurants and hotels (Bell & Ulhas 2020). Dolnicar et al. define “plate waste” as food which remains on the plate after the meal is finished (Dolnicar, Emuvan & Grün 2020).
Observing the ongoing and accelerated climate change, one can hope that, in the near future, awareness of the environmental consequences of food waste will increase, and society will be convinced of the need to reduce food waste. In consequence, this will trigger social changes, which are important areas of human activity (Wites 2019).
The diagnostic survey method was employed to study the issue of food waste in selected EU countries. The main study was preceded by a pilot study aimed at verifying the initial version of the survey questionnaire. The questionnaire, prepared by the author, consisted of 30 survey questions, including both closed-ended and open-ended questions. For questions related to the assessment of respondents’ subjective opinions and those illustrating the frequency of phenomena, a five-point Likert scale was used.
From January to April 2023, empirical research was performed based on this questionnaire; respondents included individuals who made purchase decisions in Polish, Czech and Slovak households. The research process was conducted simultaneously in all three countries. The countries selected for the study are part of the Visegrad Group (V4) and share a number of common characteristics resulting from their geographical location, shared history, political transformation, and similar socio-economic challenges.
A total of 802 households in Poland, 685 in the Czech Republic and 810 in Slovakia were surveyed by means of the CAWI (Computer-Assisted Web Interview) method. In conducting the research using this method, the focus was primarily on its key advantages, including the rapid completion time compared to traditional survey methods, such as mailing questionnaires or conducting telephone interviews, as well as the ability to reach a selected segment of the population. The CAWI method ensures the high quality of applied research techniques, utilizes modern technological solutions, and eliminates the costs associated with manual data entry. The use of this form of research significantly reduces the overall costs of project implementation and enables the collection of reliable data, as respondents can participate in the survey at a convenient time and at their own pace. An additional important advantage is the ensured anonymity, which further enhances the honesty of the responses (Malinowski 2012). Another significant strength of this research method includes a far wider reach when compared to other channels (Morawski 2012); CAWI allows researchers to carry out their studies if direct contact is difficult (Kalinowski & Wyduba 2020). In addition, studies employing CAWI enable respondents to remain anonymous, although a sample selected in this way is not representative of the general population.
The empirical material obtained in the above manner was analysed using the STATISTICA suite. The statistical analysis included the calculation of percentage distribution of quantities, as well as relationships between variables by means of Kendall’s Tau test and Spearman’s rank correlation coefficients. The significance of differences was defined as p=0.005. The calculation of percentage distributions allowed for a clear presentation of the structure of responses and the frequency of phenomena. Kendall’s Tau-b test enabled the assessment of the strength and direction of relationships between ordinal variables, while the chi-square test was used to analyse associations between categorical variables. Spearman’s rank correlation coefficient made it possible to identify monotonic relationships in ordinal data. The results were presented in descriptive, graphic and tabular form.
In total, 2,297 household representatives were surveyed between January and April 2023 (802 households in Poland, 685 in the Czech Republic and 810 in Slovakia). The surveyed households were represented mostly by women, who declared they managed the households (i.e. the main decision-maker in running the household and making purchase decisions). Women included 71.9% of respondents in Poland, 59.1% in the Czech Republic and 62% in Slovakia.
The place of residence was a non-economic determinant that played a role in consumer decisions. Among all households in the group, nearly 60% of respondents lived in a city (Figure 1); there were 71.3% city dwellers in Poland, 59.7% in the Czech Republic and 43.8% in Slovakia.
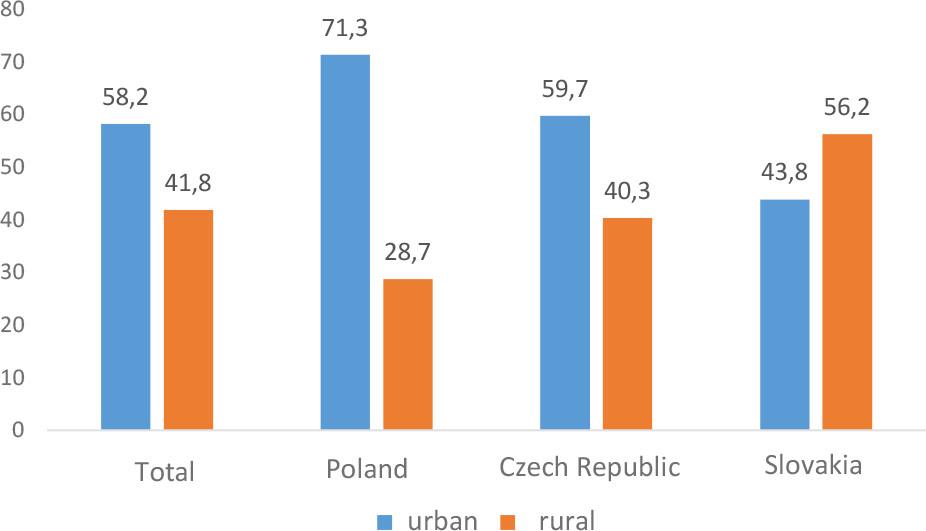
Household structure according to place of residence [%]
Source: results of author’s own research
Age was another socio-demographic characteristic of the respondents. This determinant was considered significant in studies conducted among various consumer groups – for example, in studies by Włodarczyk (2016), Hanus (2021), Jąder (2018), Savarese et al. (2022) and Giacomuzzo et al. (2024). The mean respondent age was 35.26 years, with a standard deviation of 14.43. This value was similar for household decision-makers in Poland and the Czech Republic – 38.84 and 39.81, respectively (Figure 2).
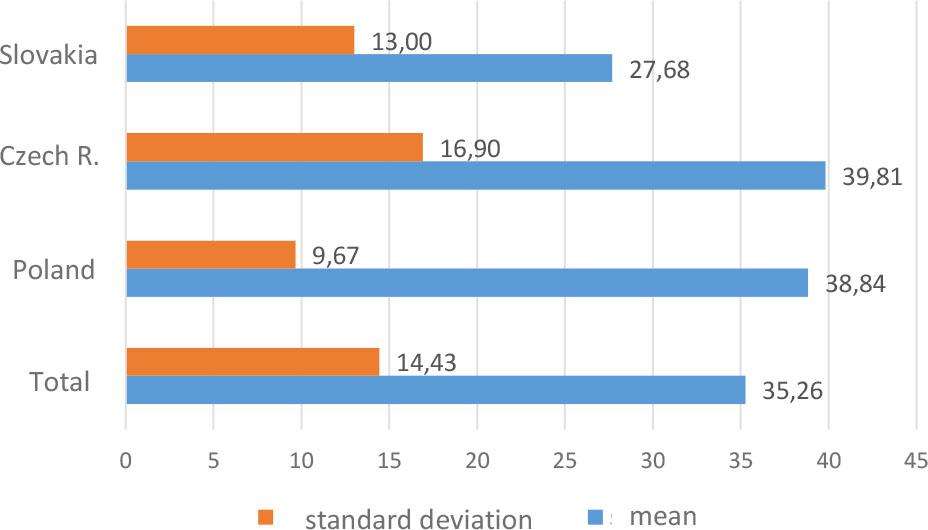
Mean age of respondents
Source: results of author’s own research
Consumption levels and structure depend largely on the size of the household. Household size may be quantified using variables such as the number of individuals or the number of children in the household. Studies by Naveed Hayat et al. show that consumption volume and patterns are also determined by the number of elderly people in the household (Hayat et al. 2023). The older generation in a household has better culinary skills and a different approach towards food (this is especially true of the post-war generation) (Aschemann-Witzel et al. 2015). Having children also has a significant effect on the food waste issue; it was shown that both the number and age of children have an influence (Ankiel & Samotyja 2021). This clearly allows us to conclude that household structure is one of the key determinants of the demand for both groceries and durable goods.
In the group of households surveyed, the mean number of individuals was 3.48; it differed by country (Figure 3). The highest value of the variable – 3.90 – was reported for Slovakia (standard deviation 1.45).
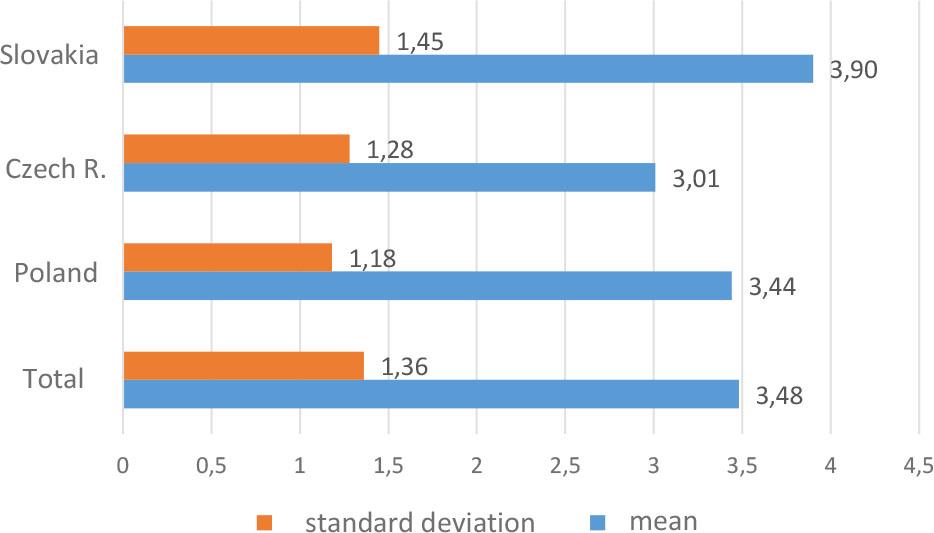
Mean number of individuals in the respondent’s household
Source: results of author’s own research
A classification of factors determining the amount of consumption and consumer behaviour reveals both economic and non-economic determinants. Income level is the most significant economic factor. Not only does it shape the amount but also the structure of consumption, as suggested, for example, in studies by Ana Castanho et al. (2023). This relationship was observed for rice consumption in Portugal. Javier Cantillo and his team analysed seafood consumption and found that income level was highly significant among many other salient factors (Cantillo, Martín & Román 2021). Figure 4 presents mean monthly net income per capita in surveyed households.
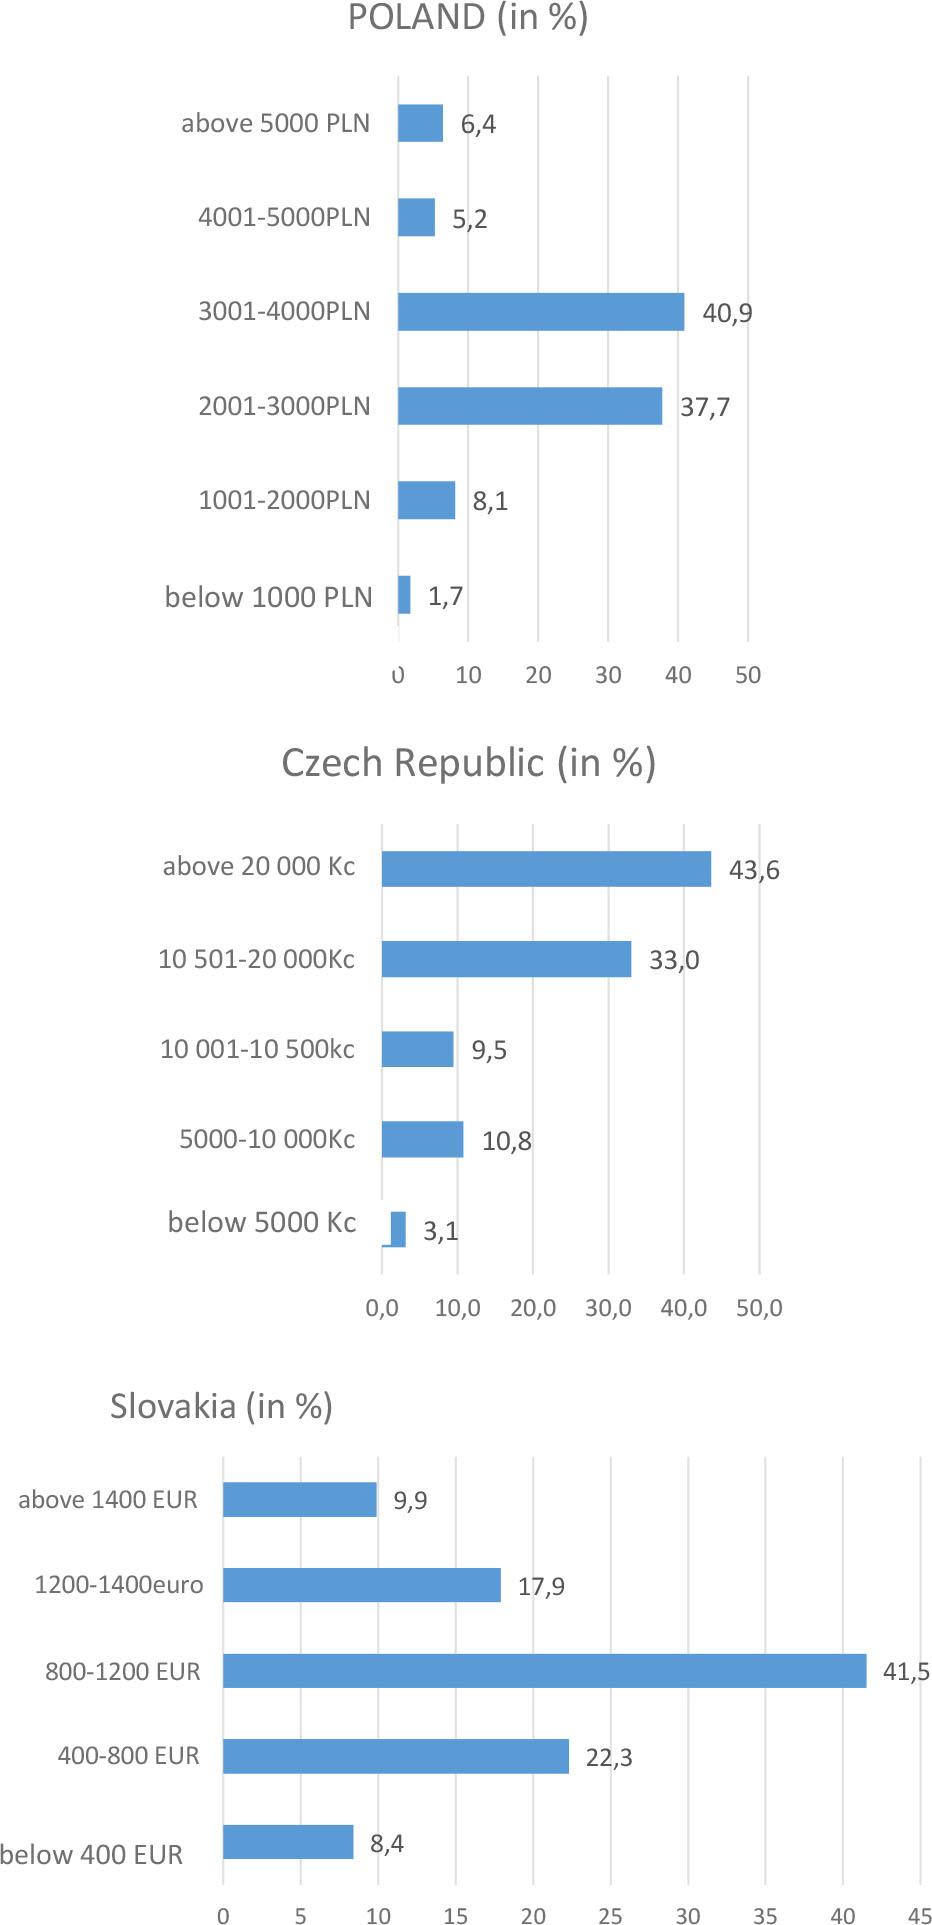
Mean monthly net income per capita in respondents’ households
Source: results of author’s own research
In 2,297 of the households surveyed, mean net per capita income differed depending on the country.
Our analysis shows that, of all three countries, the Czech Republic has the lowest food waste levels. In 2020, according to Eurostat, 91 kg of food was wasted per one resident of the Czech Republic. In contrast, the corresponding value was 106 kg in Slovakia and 112 kg in Poland. In the next year, food waste levels for Slovakia dropped to 99 kg and increased by 1 kg in Poland (there is no data available for the Czech Republic for 2021). Managing surplus food in the household is an important aspect related to shopping and preparing meals. The majority of respondents in the surveyed households said that they used surplus food for making other dishes (46.1%) or that they gave it to other people (14.1%); 22.2% of those surveyed admitted that they simply discarded it.
The use of surplus food to prepare other meals is a frequent way of managing excess supplies.
Having surveyed over 1,000 households in Australia, Trang Thi Thu Nguyen et al. stressed the importance of this method of reducing food waste (Nguyen et al. 2023). George Tsalis et al. reached a similar conclusion based on household surveys conducted in Denmark (Tsalis, Jensen & Aschemann-Witzel 2024).
An analysis of the methods of surplus food management reveals differences across countries (Figure 5). Statistical analysis points to a strong statistical relationship across the countries discussed in this study (chi-square=102.126; p=0.000). There is also a moderate positive association (phi=0.211) between variables. In the surveyed households, managing surplus food by preparing other dishes was a method definitely more often used by women (48.6%). On the other hand, men were much more likely to throw away surplus food (26.6%). This tendency was present in all three countries. The group of surveyed Polish, Czech and Slovak households displayed a statistically significant relationship between sex as a demographic characteristic and various methods of dealing with food surplus (chi-square=16.766; p=0.001). This could stem from men’s lower degree of involvement in food purchasing and meal preparation, as well as their poorer culinary skills. A statistically significant relationship between sex and food waste levels was also reported by Zailin Zainal Ariffin et al. Their results showed that men were more prone to wasting food (Ariffin et al. 2023). Differences in terms of the use of surplus food by the households are also noticeable in relation to place of residence (chi-square=14.914; p=0.002). In all three household groups, the tendency to hand over surplus groceries was definitely more often used by households located in rural areas, with the recipients of surplus food including relatives, acquaintances and neighbours. This tendency may be a result of considerably stronger interpersonal ties in communities inhabiting non-urban areas. Researchers studying food waste have found a pattern that implies that rural areas are characterized by lower food waste levels. This is confirmed by studies conducted in Slovakia by Patrícia Husárová et al. (2023).
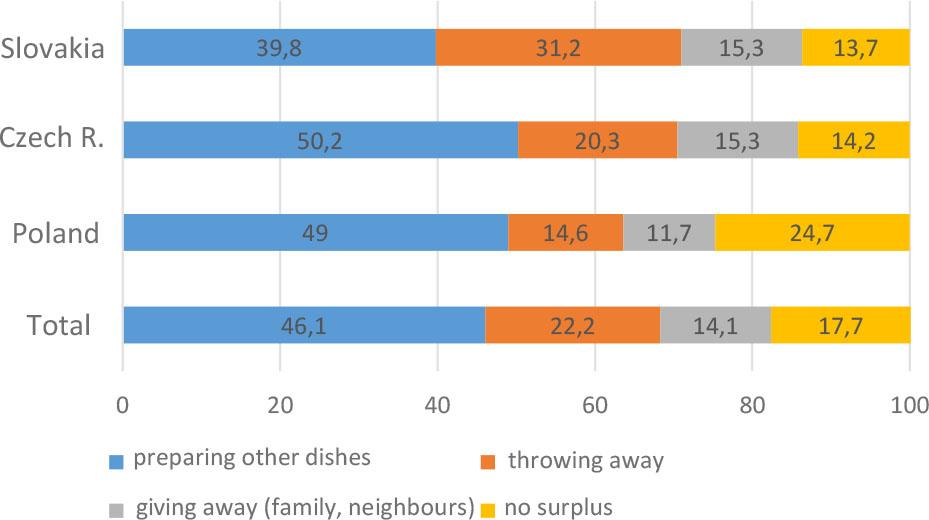
Food surplus management methods [%]
Source: results of author’s own research
An equally important aspect, aside from the issue of throwing away food, is the frequency of this phenomenon. Results suggest statistically significant differences between the three countries in terms of frequency (p=0.000; chi-square=136.977). A five-step nominal scale was used to rate the frequency of throwing away food. The lowest percentages recorded were related to those who discarded food every day; considerably more (13.3%) respondents stated that they threw away food 2–3 times a week (Table 1).
Frequency of throwing away food in the respondents’ households (%)
| Description | Total | Poland | Czech Republic | Slovakia |
|---|---|---|---|---|
| Every day | 3.7 | 1.1 | 3.1 | 6.7 |
| 2–3 times a week | 13.3 | 10.5 | 11.5 | 17.7 |
| Once a week | 27.1 | 19.7 | 29.5 | 32.3 |
| 2–3 times a month | 25.6 | 35.0 | 23.2 | 18.1 |
| Once a month or less | 30.4 | 33.7 | 32.7 | 25.2 |
Source: results of author’s own research
According to Polish respondents, food was usually thrown away 2–3 times a month (35%) or once a month or less often (33.7%). In the Czech Republic, food was discarded once a month or less often (32.7%) or once a week (29.5%). The percentage distribution of replies was similar for respondents living in Slovakia, with nearly one-third of respondents stating that they threw away food once a week, and every fourth respondent claiming to throw away food once a month or less often. However, one should note that almost 18% of those surveyed in Slovakia admitted that they threw away food 2–3 times a week; in Poland and the Czech Republic, 10.5% and 11.5%, respectively, gave the same answer. There are no statistically significant relationships between how often food was thrown away and the mean monthly net income per capita in the household.
However, we definitely observed a statistically significant relationship between food disposal frequency and the age of the decision-maker in the household (Kendall’s Tau test=0.128; p=0.000). Households managed by younger people were more likely to throw away food products. In households where the decision-maker was younger than 25, only 23.4% of respondents admitted that food was thrown away once a month or less often, whereas in households run by people over 65, the corresponding proportion was 46.6%.
Both the very fact of throwing away food and its frequency are linked to the reasons for wasting food (Table 2). Fourteen reasons for wasting food were defined in this study. Likert’s (1 to 5) scale was used in the rating, where 1 means “never” and 5 means “very often”.
Reasons for throwing away food in households – mean reported frequency*
| Description | Total | Poland | Czech Republic | Slovakia | p – significance level S – Spearman’s correlation ratio |
|---|---|---|---|---|---|
| Food spoilage | 3.56 (n*=54) | 3.87 (n=1) | 3.35 (n=19) | 3.44 (n=34) | p=0.000 |
| Exceeding expiry date | 3.17 (n=124) | 3.83 (n=11) | 2.49 (n=69) | 3.10 (n=44) | p=0.000 |
| Preparing too much food (e.g. for holidays) | 2.77 (n=243) | 3.45 (n=26) | 1.97 (n=124) | 2.76 (n=93) | p=0.000 |
| Buying too much food | 2.47 (n=326) | 3.10 (n=43) | 1.77 (n=170) | 2.42 (n=113) | p=0.000 |
| Excessive meals | 2.44 (n=332) | 3.08 (n=36) | 1.67 (n=190) | 2.44 (n=106) | p=0.000 |
| Improper storage conditions | 2.18 (n=469) | 3.02 (n=63) | 1.46 (n=212) | 1.95 (n=194) | p=0.000 |
| Lack or insufficient culinary skills | 1.99 (n=647) | 2.94 (n=97) | 1.10 (n=311) | 1.79 (n=239) | p=0.000 |
| Lack of ideas for using ingredients to prepare meals | 2.08 (n=639) | 3.13 (n=82) | 1.11 (n=330) | 1.87 (n=227) | p=0.000 |
| Low product quality | 2.33 (n=443) | 3.19 (n=57) | 1.50 (n=220) | 2.18 (n=166) | p=0.000 |
| Too much packaging | 2.39 (n=406) | 3.23 (n=54) | 1.56 (n=219) | 2.27 (n=133) | p=0.000 |
| Badly planned shopping (no shopping list) | 2.31 (n=506) | 3.15 (n=67) | 1.48 (n=247) | 2.18 (n=192) | p=0.000 |
| Impulse purchases | 2.33 (n=463) | 3.15 (n=55) | 1.54 (n=235) | 2.20 (n=173) | p=0.000 |
| Purchases motivated by promotions | 2.33 (n=477) | 3.19 (n=57) | 1.58 (n=241) | 2.10 (n=179) | p=0.000 |
| Low food prices lead to lack of foresight and, later on, food waste | 2.36 (n=461) | 3.14 (n=83) | 1.58 (n=223) | 2.24 (n=155) | p=0.000 |
n – number of “never” replies
An assessment made using a Likert scale from 1 to 5, where 1 meant “never” and 5 meant “very often”
Source: results of author’s own research.
Considering the diversity of possible reasons for throwing away food in the analysed household from the perspective of the countries discussed in the present study, one may notice that two causes prevailed in all three countries, namely food spoilage and exceeding the expiry date. Regarding the former, the mean food waste frequency was 3.56 (at a standard deviation of 0.92). As for the latter, it equalled 3.17 (at a standard deviation of 0.89). The latter reason was also reported as the main cause of throwing away food in the Czech Republic by Petra Nováková et al. (2021) (2) and in Slovakia by Zuzana Kapsdorferová et al. (2023).
An in-depth interpretation of the present statistical analyses suggests that all reasons for food waste displayed statistically significant differences in food disposal frequency depending on the respondent’s country of residence. The strongest relationship was present for the reasons labelled “lack of ideas for using ingredients to prepare meals”. This reason was most often cited by Polish households (mean frequency 3.13, standard deviation 0.91). In contrast, this was much less frequently mentioned in Slovak households (mean frequency 1.79, standard deviation 0.92). In the Czech Republic, the mean was 1.11 with a standard deviation of 0.61. It is worth noting that 48% of households in the Czech Republic declared that the aforementioned “lack of ideas” was never the reason for food waste. The same answer was supplied by 28% of households in Slovakia and a mere 10% in Poland. These findings are disturbing, especially in reference to Polish households. Taking into account another reason, namely the lack of culinary skills or insufficient culinary skills, which was “never” considered a cause in Poland in only 12% of households, we see a need to improve culinary skills required to prepare meals creatively in order to curb food waste.
Food waste may be linked to the method applied in the purchase process. A general analysis of the surveyed households shows that purchasing larger amounts of groceries once every few days or less frequently and, subsequently, making additional purchases as necessary was by far the most common grocery shopping pattern (47.0%). Far fewer respondents declared they do their shopping every few days or less often without making additional grocery purchases (21.6%). Only 3.2% of the participants in the study reported that they shopped for groceries every day (Table 3).
Grocery shopping patterns in households in Poland, the Czech Republic and Slovakia [%]
| Description | Total | Poland | Czech Republic | Slovakia |
|---|---|---|---|---|
| I do bigger shops every few days or less often; later on, I buy other products that I currently need or that I forgot to buy | 47.0 | 42.4 | 49.9 | 49.1 |
| I do bigger shops every few days or less often; I generally do not buy other products later on | 21.6 | 31.4 | 12.7 | 19.5 |
| I do not have a dominant shopping strategy and I often change my behaviour in this respect | 15.1 | 15.1 | 15.2 | 14.9 |
| I buy food often, as required, and I generally avoid overbuying | 13.1 | 8.5 | 18.4 | 13.2 |
| I buy food every day | 3.2 | 2.6 | 3.8 | 3.3 |
| Total | 100.0 | 100.0 | 100.0 | 100.0 |
Source: results of author’s own research.
We notice statistically significant differences between the countries in the context of the preferred grocery shopping routine (p=0.000; chi-square=97.584). Significant differences were found for Polish households participating in the study, particularly in reference to the following three points:
- 1)
shopping for groceries every few days and replenishing products – 42% of Polish and nearly 50% of Czech and Slovak households opted for this method;
- 2)
households in Poland stood out in terms of grocery shopping once every few days or less, often without making additional purchases later on (31.4%); this method was clearly more often used in Poland;
- 3)
only 8.5% of Polish households participating in the study purchased groceries frequently, as necessary. For the Czech Republic and Slovakia, this value was 18.4% and 13.2%, respectively.
The choice of the latter surplus management method may provide an explanation as to why food is wasted. Specifically, making grocery purchases every day or as necessary may be a factor that limits waste related to food spoilage or exceeding its expiry date. Differences were noticed across the three countries between mean significance rating for each food waste factor and grocery shopping methods. In the Czech Republic, where considerably more households tended to purchase groceries as necessary, the mean significance rating for each factor was much lower compared to Poland and Slovakia (Table 2). Studies by Macková, Hazuchová and Stávková in 2017, on a group of 1,582 households, revealed that the average Czech consumer purchased food regularly (ca. 80% of respondents), and the same percentage did their shopping after certain actions (they checked the food left in their refrigerators, larders, etc.) (Macková, Hazuchová & Stávková 2019).
Based on the results of empirical research conducted in Poland, the Czech Republic and Slovakia, similarities and differences were identified regarding consumer behaviours related to food waste in the household. The analysis of the collected data allowed for the formulation of several generalizations and conclusions. Among the most important reasons for discarding food in the surveyed households across all three countries were food spoilage and the products exceeding expiration dates. To mitigate these improper consumer behaviours, it would be advisable to develop and implement effective educational programmes.
The management of food surpluses by preparing other dishes was reported twice as often by women than by men, a trend observed in households from all three surveyed countries. This may result from men’s lower involvement in household activities such as shopping and meal preparation, as well as from having poorer culinary skills. In all three groups of surveyed households, it was also observed that the method of donating surplus food to family, friends or neighbours was significantly more common in rural areas, which can be explained by the stronger social ties typical of less urbanized regions.
Statistically significant differences were noted between the frequency of food waste and the age of the household decision-maker. In households managed by younger individuals, food was discarded twice as often as in households managed by people over the age of 65. In households where the decision-maker was under 25 years old, only one in four respondents indicated that food was discarded once a month or less frequently.
There were also statistically significant differences between the surveyed countries regarding the methods of conducting grocery shopping. Shopping every few days with frequent replenishment was more common in households in the Czech Republic and Slovakia (50%) – in contrast to Poland (42%). Conversely, nearly one-third of Polish households conducted larger shopping trips once every few days or less frequently without additional replenishment, which was notably less common in the Czech Republic and Slovakia. Respondents from the Czech Republic and Slovakia more often preferred to shop based on immediate needs. This shopping behaviour, adjusted to their current demand, may help reduce food waste associated with spoilage or expired shelf life.
Primary efforts aimed at reducing food waste should focus on broad information campaigns designed to raise public awareness about the necessity of counteracting food waste. Equally important is education directed at children and youth, conducted both within families and at all levels of the education system.
Finally, there are indications that the problem of food waste in households across European Union countries will continue to grow. Therefore, it is particularly important to conduct systematic scientific research on consumer attitudes and behaviours in this area.
The results obtained are of significant cognitive and practical value. On the one hand, they deepen the understanding of consumer behaviour related to food waste in various cultural and social contexts; on the other, they provide a valuable foundation for developing effective educational strategies and social campaigns tailored to the specific characteristics of different consumer groups and countries. The recommendations resulting from the study can also support the efforts of public institutions and non-governmental organizations in reducing food loss and promoting sustainable consumption.
Psychographic factors determine such components as: interests – home, family, significant others; activities – hobbies, occupation, voluntary work; lifestyle – which may vary in reference to social groups or individuals, and depends on the environment.
The research was carried out in 2017 on a group of 403 households in the Czech Republic.