
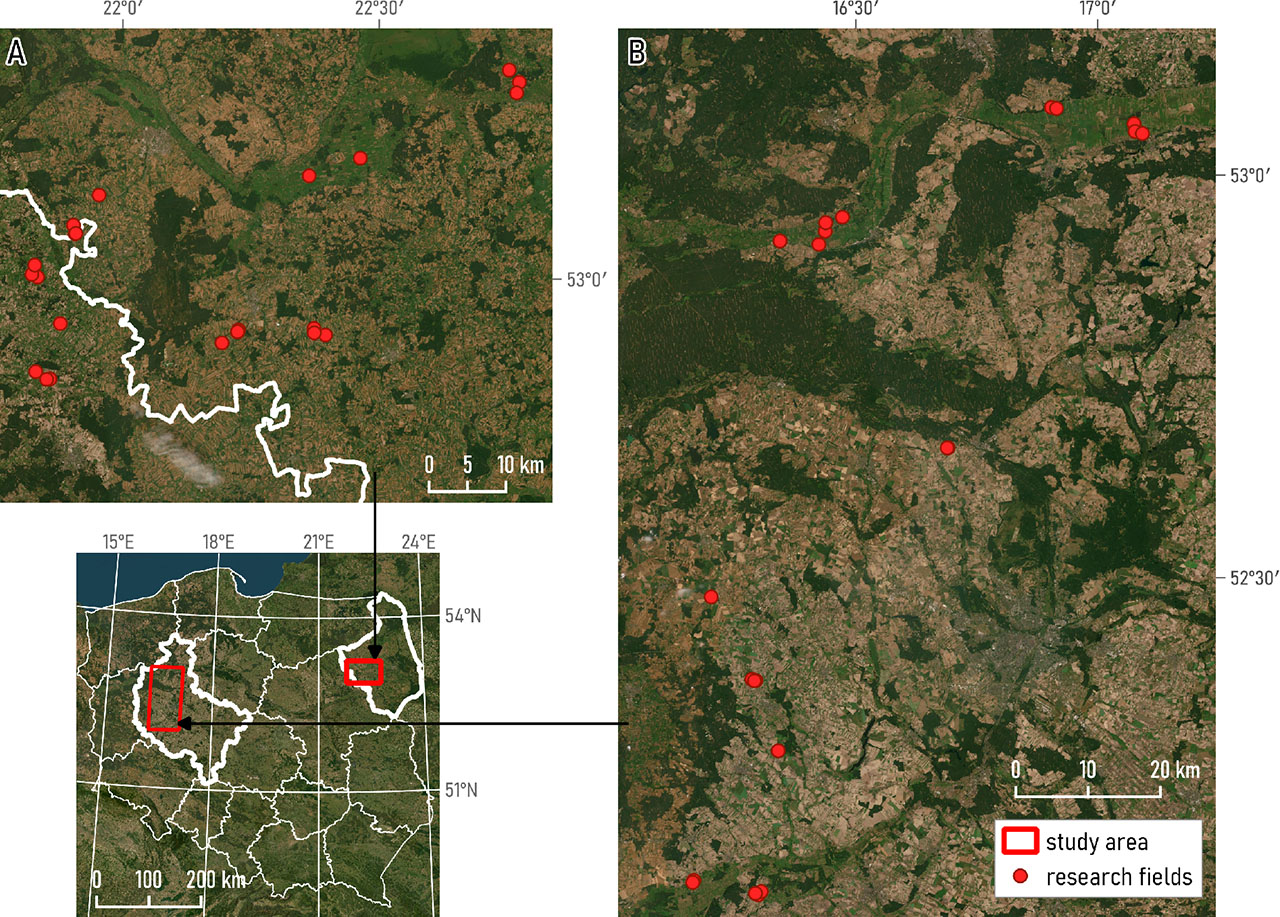
Figure 1.
Map of grasslands on: IGiK test site area (A) and PULS test sites (B)
source: own elaboration
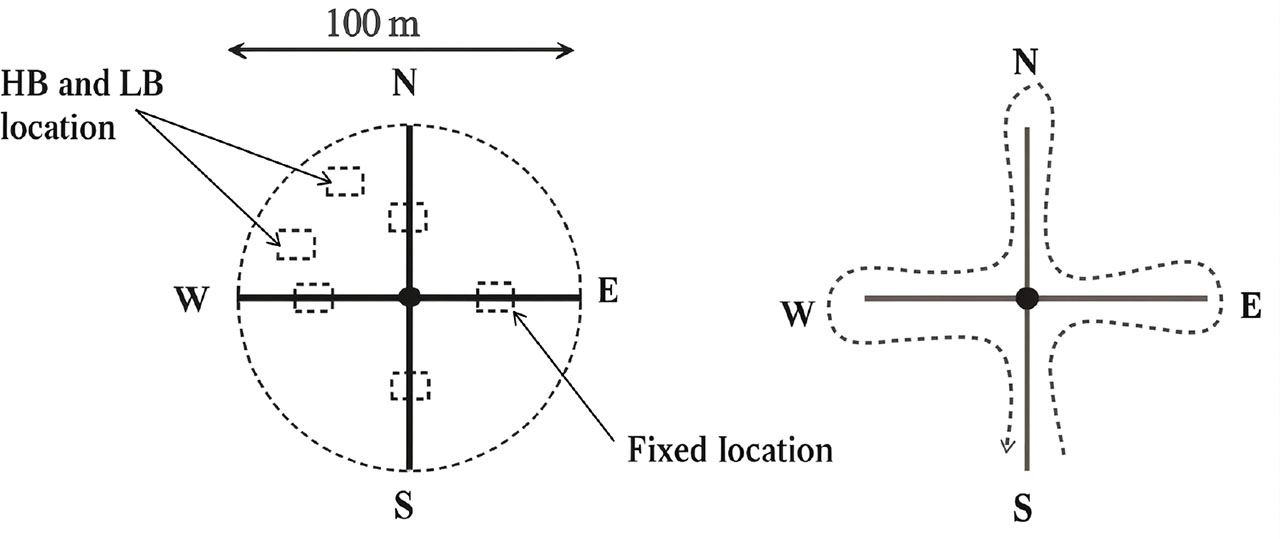
Figure 2.
Sampling locations in the field were determined based on the vegetation sampling approach, which involved quadrats sampled at locations exhibiting both high biomass (HB) and low biomass (LB)
Source: Mundava et al. (2015)
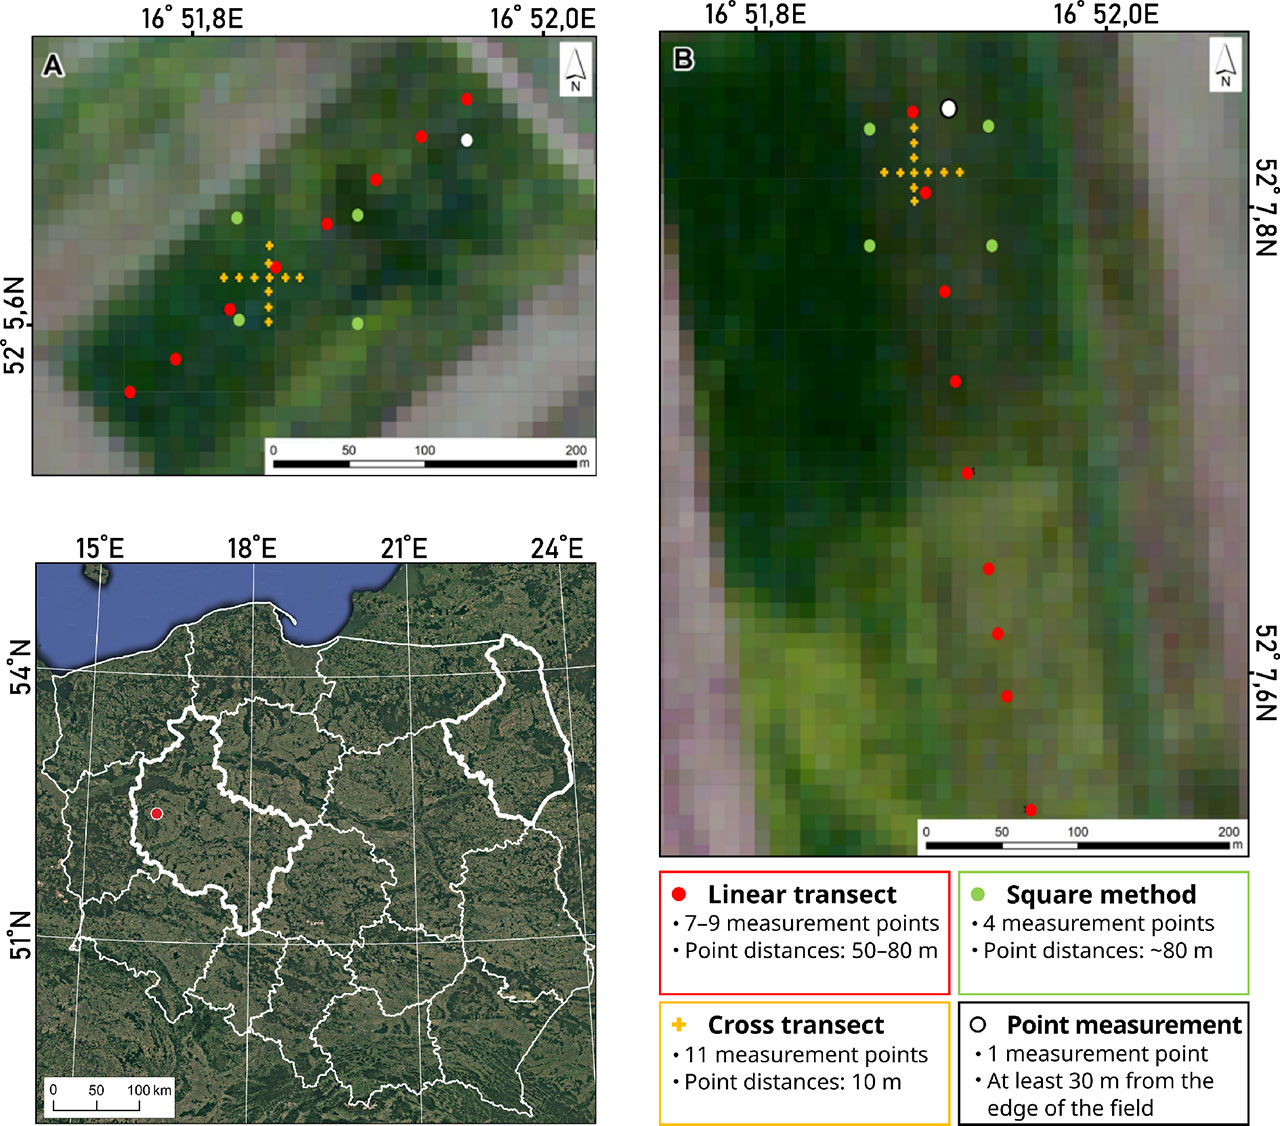
Figure 3.
Ground measurement methods
Source: own elaboration.
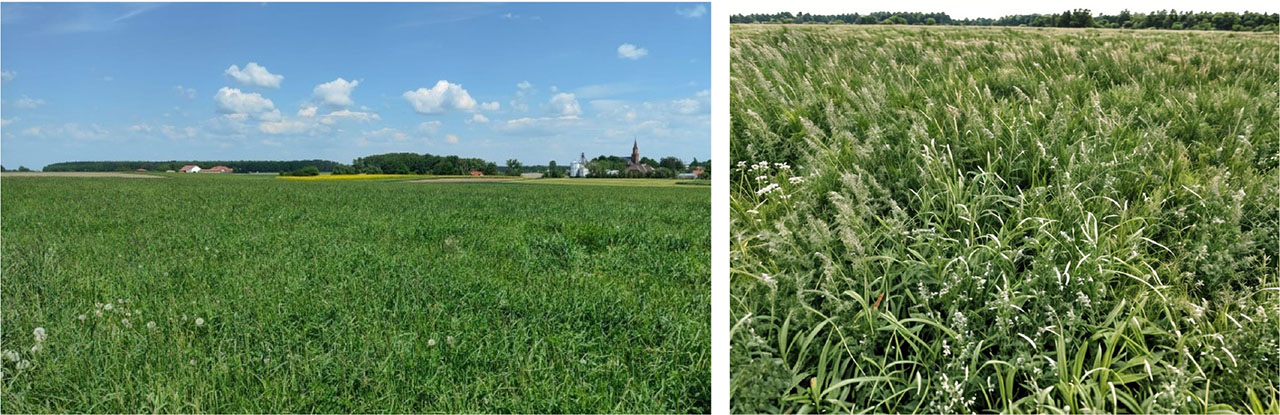
Figure 4.
Visualization of green landscape types: (A) high productive grasslands; and (B) low-yielding unimproved permanent grasslands
Source: own elaboration
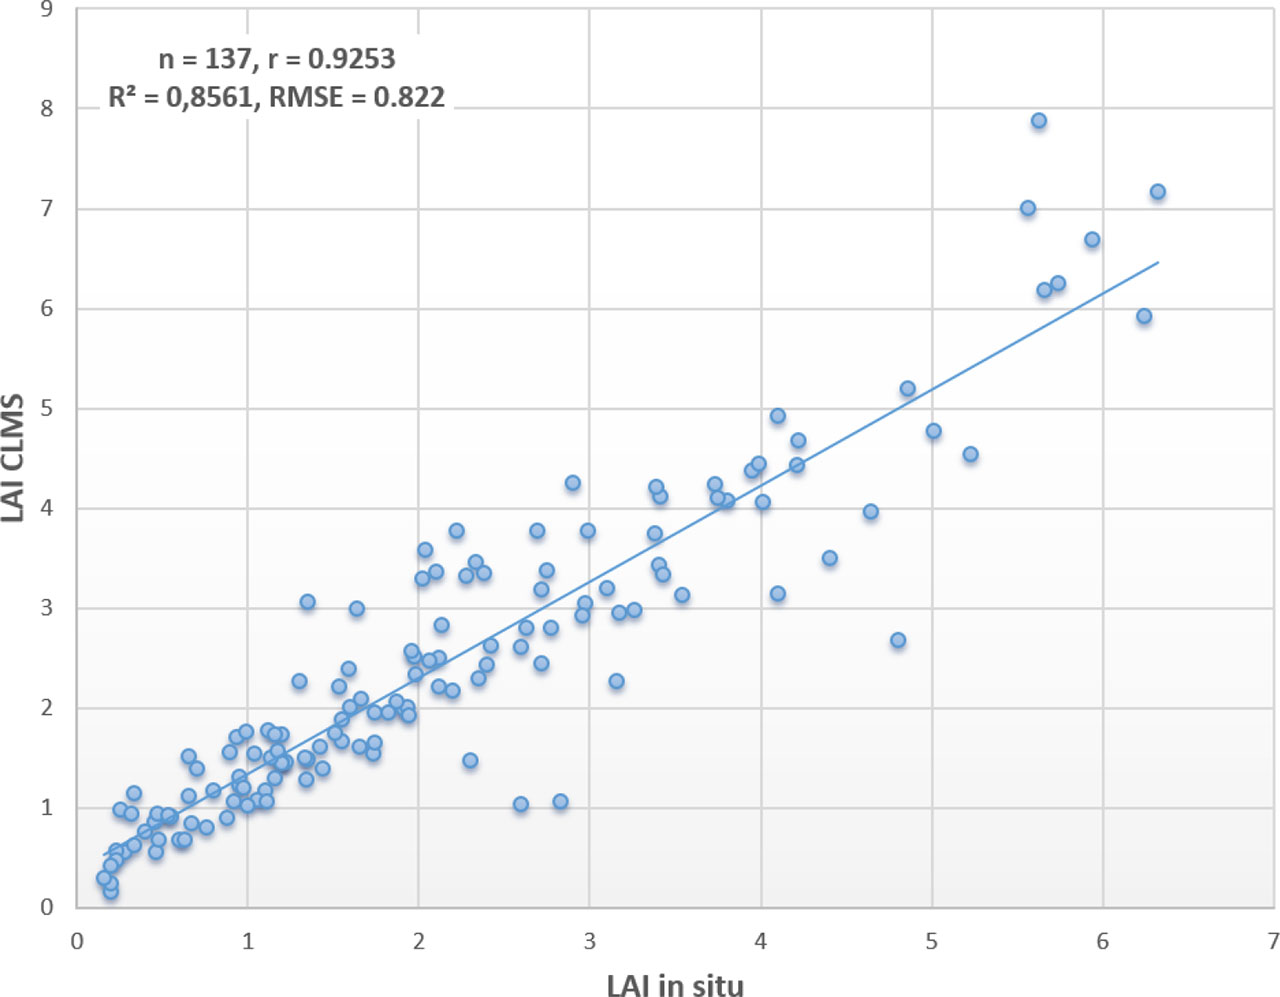
Figure 5.
The scatterplot between LAI in situ and LAI CLMS
Surce: own elaboration
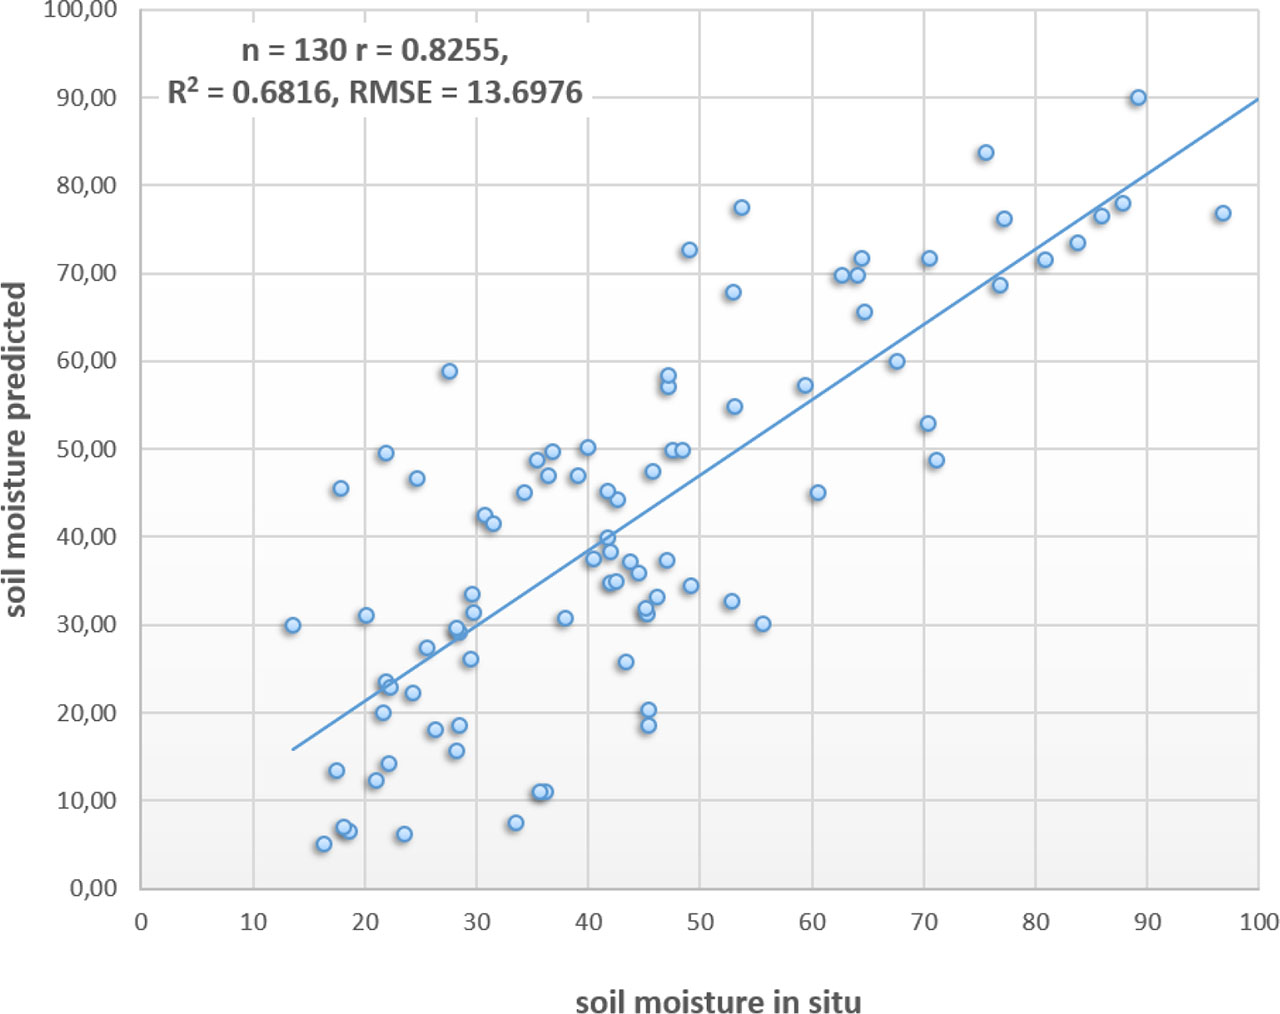
Figure 6.
Scatter plot of modelled SM for natural grasslands vs SM in situ
Source: own elaboration