
Satellite remote sensing provides data for observing spatial and temporal conditions and changes in vegetation. Advanced satellite observations of the environment have been developed since the 1970s when Rouse et al. (1974) developed the Normalized Difference Vegetation Index (NDVI). Tucker (1979) used the in situ spectrometer data to evaluate and quantify the relationships between different linear combinations of red and photographic infrared radiances for vegetation biomass, leaf water content, and chlorophyll content. He obtained the linear relationship of IR/red ratio, the IR-red difference, the vegetation index, and the transformed vegetation index to obtain the vegetation characteristics.
Since then, significant progress has been made in the application of remote sensing techniques. A variety of indices and techniques are used to monitor various issues related to agriculture, forests, urban areas, and water bodies (Xue & Su 2017).
The collection of in situ measurements is a fundamental component for the calibration of satellite data and for interpreting what specific satellite signals mean in relation to ground conditions. However, as noted by Balsamo et al. (2019), in situ data are often spatially limited and represent local conditions. Therefore, in situ measurements are crucial for establishing a direct relationship between sensor signals and actual environmental variables at ground level, and extending this relationship to a broader spatial scale.
Grasslands are an area of interest as they are one of the most important ecosystems on Earth and are the reservoirs of biomass and CO2; this is very important in view of the interaction of these with climate change (Gorham 1991). Grasslands also improve water quality, recharge groundwater, and are the habitat for many animals and plants. Large-scale, regular monitoring is highly required.
The objective of this article is to present methods for grass growth monitoring and yield prediction based on the synergy of remote sensing data, process-based models, and in situ measurements, using the GrasSAT project as an example. Key components are the validation of remote sensing results with ground-based data and the development of decision support tools for agricultural management, aimed at optimizing grassland management practices. This article provides a concise overview of the research methods used and the results of the project, focusing on the practical value of in situ research and the high quality of the results achieved, such as the precise monitoring of plant growth conditions and their response to variable environmental factors, including LAI, biomass, and soil moisture.
The methodology for monitoring grass growth conditions and yield forecast was based on the synergistic use of remotely sensed data, process-based grassland models, and in situ reference data, indispensable for elaborating reliable models to characterize plant development. In situ validation measurements were carried out on plots selected by individual farmers. Specific project objectives included (1) evaluating the practical value of in situ research for the precise monitoring of plant growth conditions and their response to variable environmental factors; (2) developing the method for grassland damage assessment, caused by drought or winterkill, on the basis of multi-source satellite data and their synergy with meteorological data; (3) verifying satellite-derived indices that characterize the grassland status and conditions using ground measurement data.
Two research institutions were involved in the Polish component of the GrasSAT project. The Institute of Geodesy and Cartography conducted measurements on 23 fields located in the Podlaskie voivodeship (NUTS2 – PL84), developing a field campaign plan that took into account the mowing dates set by farmers. Poznań University of Life Sciences (PULS) prepared the field campaign plan and selected 23 test sites in western Poland, particularly in Wielkopolskie voivodeship (NUTS2 – PL41). The test fields are presented in Figure 1.
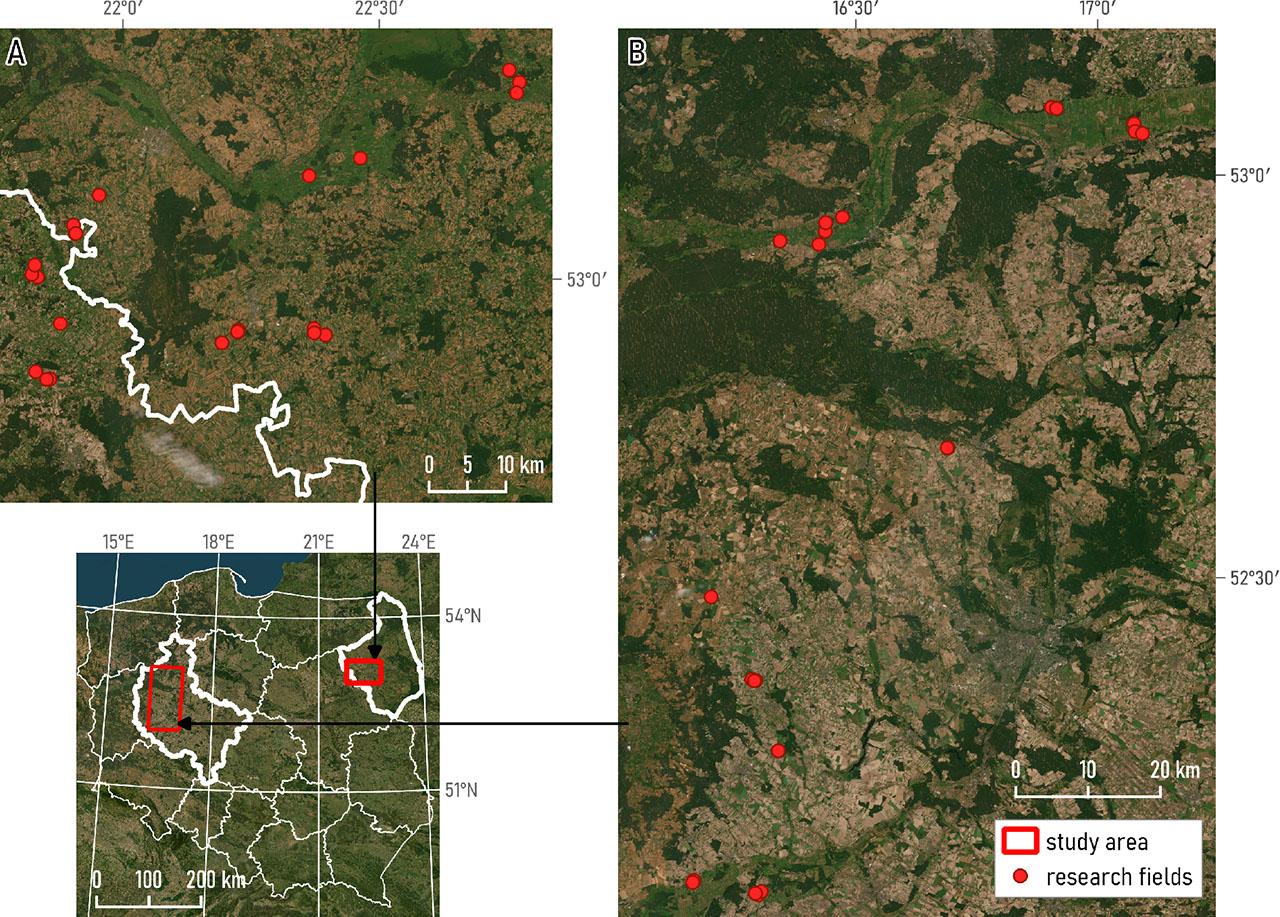
Map of grasslands on: IGiK test site area (A) and PULS test sites (B)
source: own elaboration
The validation test sites across Poland were selected to be representative of diverse grassland ecosystems and soil moisture conditions. In situ measurements were performed on plots designated by local farmers. In Podlaskie, grasslands have moderate soil moisture levels and sufficient annual rainfall, with occasional droughts affecting moisture variability. In Wielkopolska, one of Poland’s most important agricultural regions, soil moisture conditions are more variable, and the region is particularly prone to summer droughts, resulting to lower soil moisture.
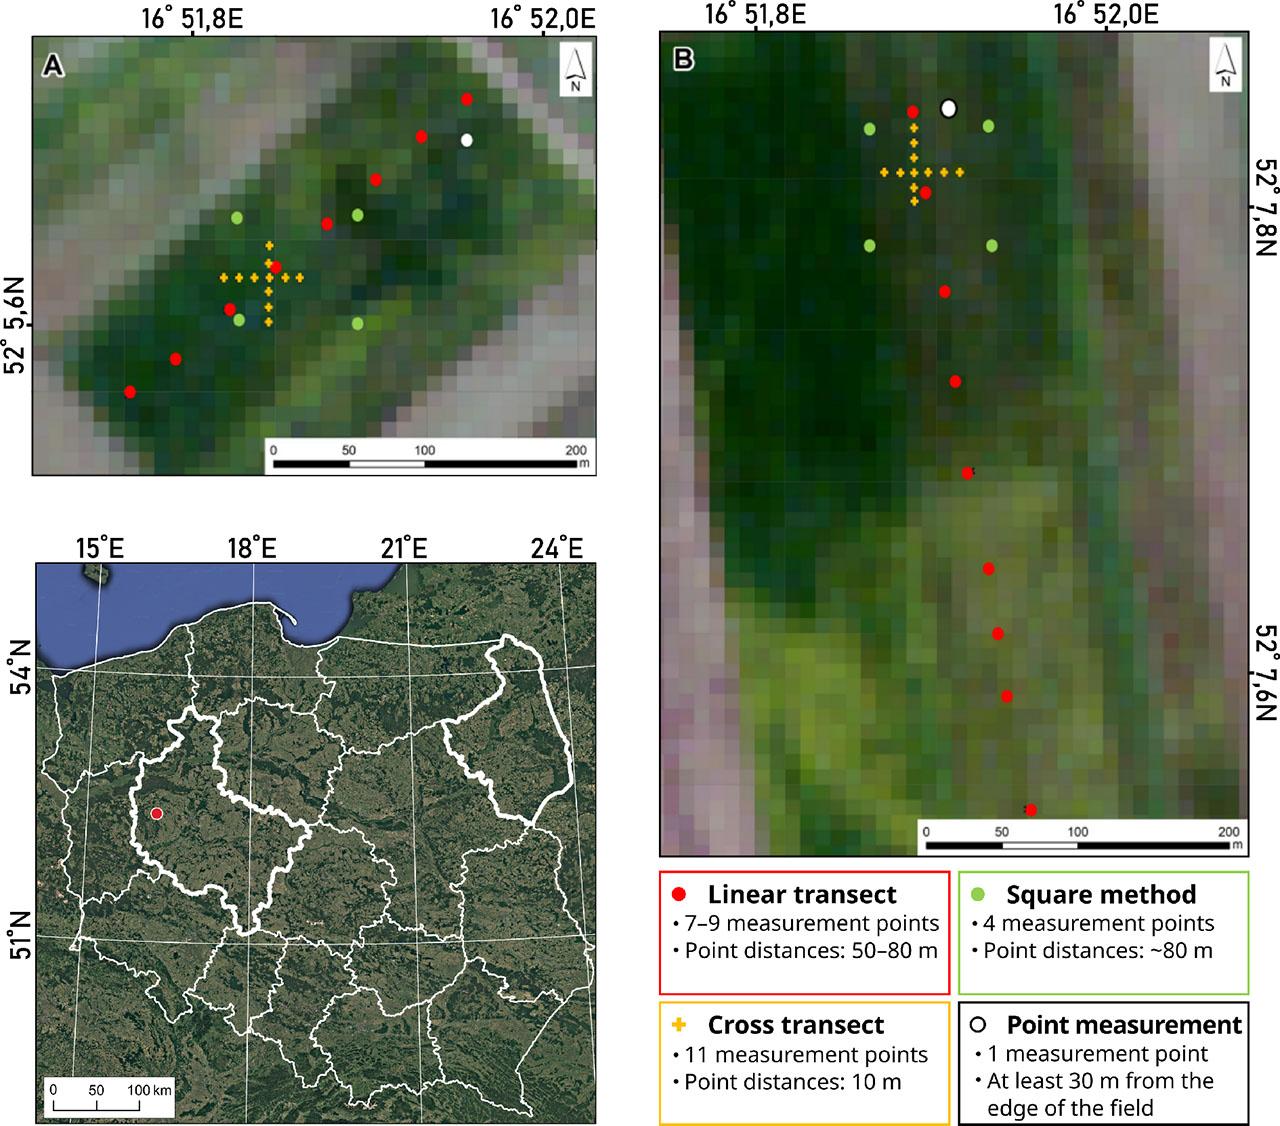
The article provides details of the methods of field data collection and the models used, and describes the use of satellite and ground data; then, it examines the consistency between the satellite and ground data. The method of sampling the site is crucial for obtaining accurate ground measurements.
There is a strong need for harmonization and standardization of in situ measurement techniques. The main objective of this research is to present various methods of in situ measurements of LAI, soil moisture, biomass, height of vegetation, and soil temperature with respect to satellite remote sensing measurements. Different methods, including linear and cross transects methods and the square method introduced by the authors, were applied.
An Elementary Sampling Unit (ESU) is utilized to ensure the meaningful alignment of satellite or remote sensing data with the corresponding ground measurements. In remote sensing, each pixel, or small cluster of pixels, represents a ground area, which must be associated with the representative ground measurements. For canopies with shorter heights, such as crops, pastures, or wetlands, the ESU typically spans 10 to 30 metres in diameter, corresponding to the pixel size of high-resolution satellite products used for upscaling. Ground measurements often cover a smaller footprint than that represented by the ESU area. Consequently, a single ground measurement may not adequately capture ESU variability.
Repeated ground measurements are, thus, crucial to better reflect the average value over the ESU. This iterative approach ensures harmonization between satellite-derived data and ground measurements, enhancing the accuracy and reliability of information for environmental monitoring and resource management applications (Morisette et al. 2006).
The parameters of vegetation were collected to predict the biomass and give this information to farmers before the grassland cut. All collected data, including field measurements, were entered into a database. Simultaneously, meteorological data – air temperature and precipitation – were collected for the duration of the field campaigns from meteorological stations near the study sites. The set of ground measurements at grassland fields in Podlaskie and Wielkopolskie included:
- –
Leaf Area Index (LAI) (measured by LAI-2200C Plant Canopy Analyzer);
- –
soil moisture (measured by TRIMEPICO 64 Field Measurement Devices and ML3 ThetaProbe Sensor);
- –
wet and dry biomass (measured in a laboratory from samples collected at measurement plots from an area of 0.5 × 0.5 m, and by EC20 Plate meter).
Two basic types of grasslands in Poland have been determined to collect the ground measurements data (Figure 4).
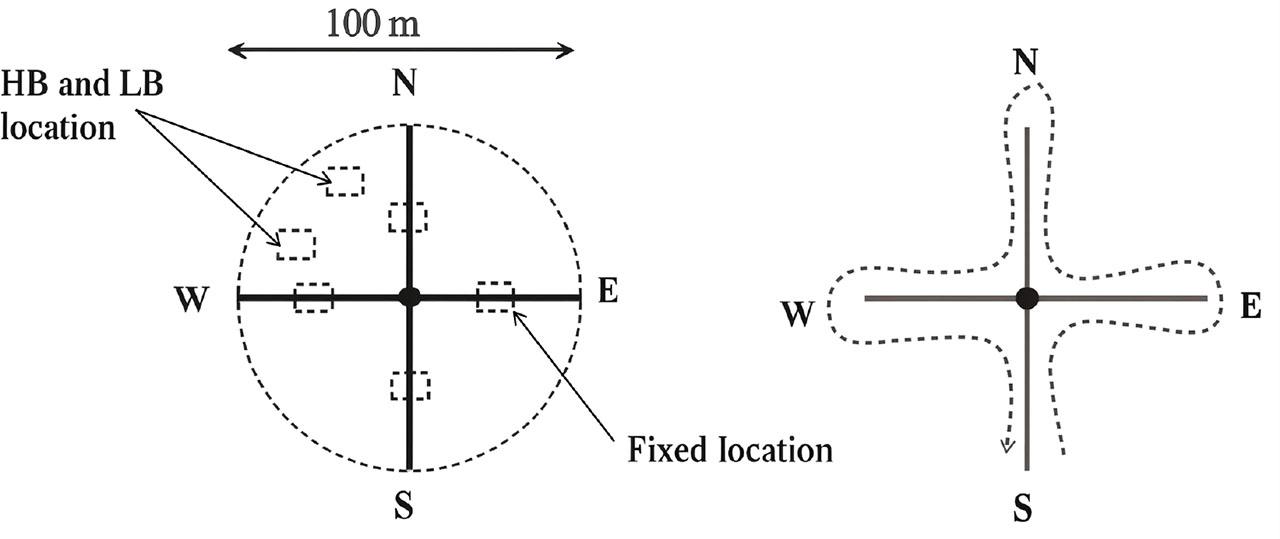
Sampling locations in the field were determined based on the vegetation sampling approach, which involved quadrats sampled at locations exhibiting both high biomass (HB) and low biomass (LB)
Source: Mundava et al. (2015)
Ground measurement methods
Source: own elaboration.
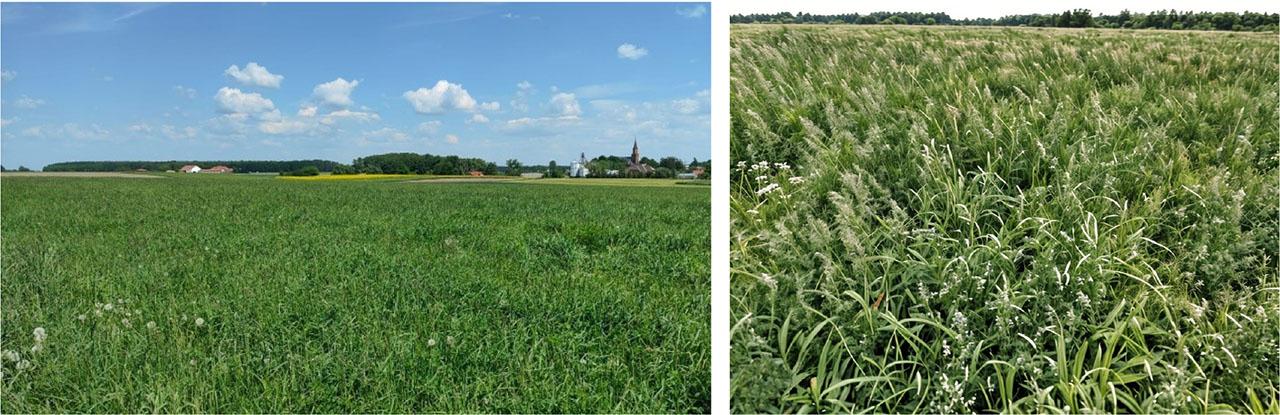
Visualization of green landscape types: (A) high productive grasslands; and (B) low-yielding unimproved permanent grasslands
Source: own elaboration
Leaf Area Index (LAI) is defined as the total one-sided area of leaf tissue per unit ground surface area (Breda 2003). According to this definition, LAI is a dimensionless quantity that characterizes the canopy of an ecosystem. Measurements of LAI are significant considering its wide usage. It describes biophysical plant processes – photosynthesis (Bonan 1993), evapotranspiration (Al-Kaisi et al. 1989), and condition (Kiala et al. 2016). As LAI is dimensionless, it can be measured, analysed, and modelled across various spatial scales, ranging from individual fields or clusters to whole regions or continents (Asner 1998).
In this study, in situ LAI data collection was performed. The LAI instrument allows for indirect, non-contact light measurements from five different angles using the assessment of incoming solar radiation above and below the canopy (‘LAI-2200C – Plant Canopy Analyzer Instruction Manual’ 2023). The optimal conditions for measuring LAI occur during twilight or under uniform cloud cover, minimizing interference and ensuring consistent results. In contrast, non-uniform cloud cover significantly reduces measurement accuracy. However, under clear skies or thin cloud cover, reliable LAI values can still be obtained (Pearse et al. 2016).
At each test site, which should be a homogeneous area, three measurements were performed at approximately 20 m from each other. The procedure of taking single measurements – A (above); B (below) – were repeated three times. Measurements were always performed with back to sun (Darvishzadeh et al. 2008).
Field measurements of LAI enabled an assessment of their values in comparison with LAI from the Copernicus Land Monitoring Service (CLMS). Based on this analysis, a high match between field and satellite data was obtained (Figure 5). Pearson’s correlation coefficient was r = 0.925 with a study sample of n = 137, indicating a strong relationship between field and satellite-derived measurements. This high correlation between the study variables allows for the move from in situ measurements to satellite data, making it possible to extend the analysis to larger areas, rather than point-wise as in the case of field measurements. These results, further elaborated in the publication ‘Integrating Copernicus LMS with Ground Measurements Data for Leaf Area Index and Biomass Assessment for Grasslands in Poland and Norway’ (Dąbrowska-Zielińska et al. 2024), confirmed the robustness of such approaches, providing valuable insights into the use of satellite data for grassland monitoring across larger areas.
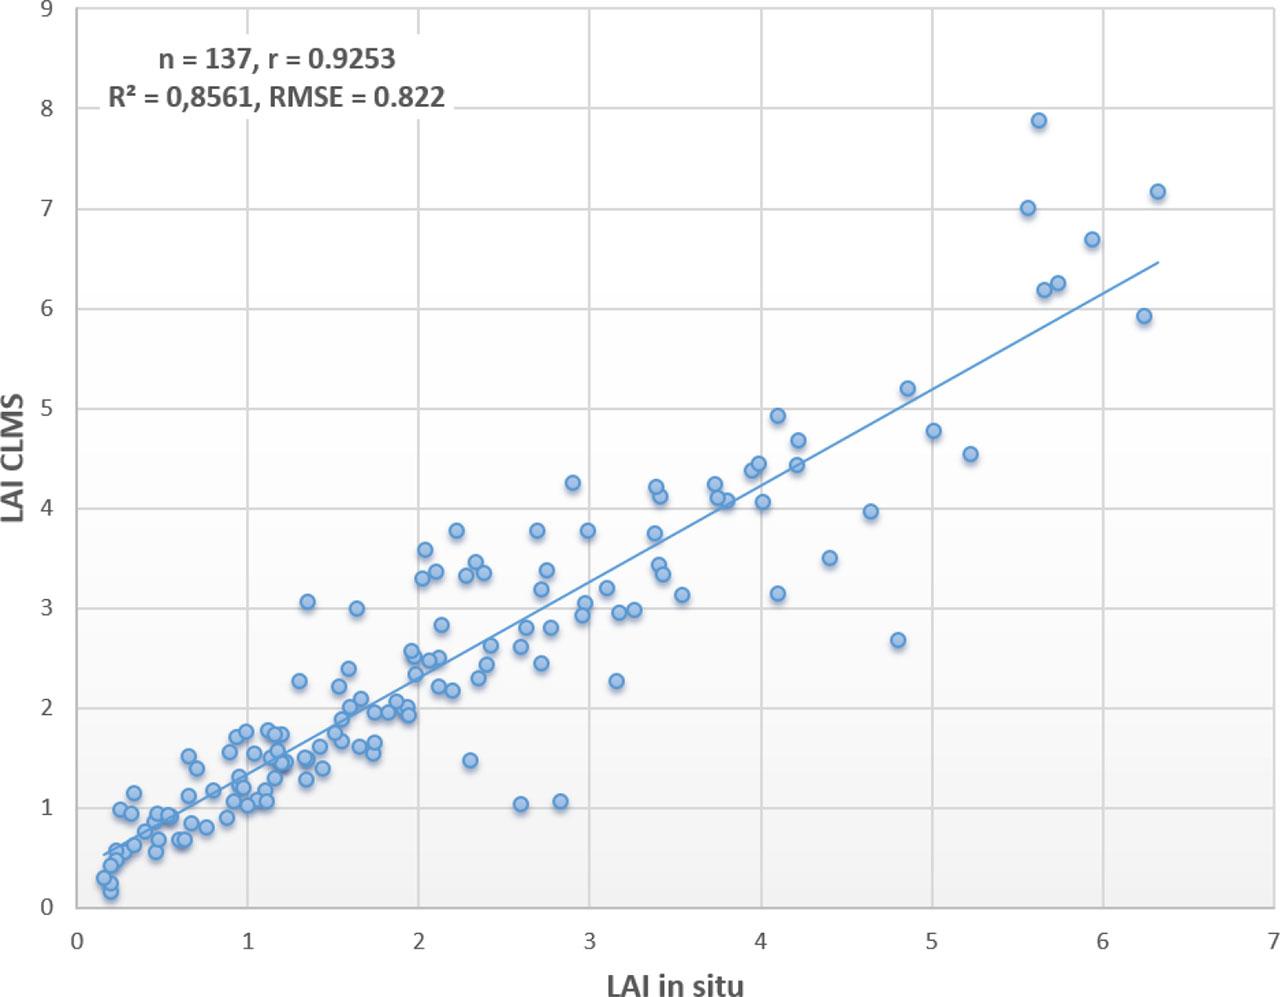
The scatterplot between LAI in situ and LAI CLMS
Surce: own elaboration
In situ measurements are crucial for creating reliable models of biomass that characterize crop growth conditions. Validation sites were chosen to represent various grasslands and soil moisture conditions in Poland. Biomass was collected from all test sites and delivered to the laboratory immediately after measurements. A strong correlation was found between fresh biomass and LAI, where higher LAI values indicated higher biomass. Further research conducted within the GrasSAT project (Dąbrowska-Zielińska et al. 2024) confirmed a strong correlation between biomass, LAI, and NDII (Normalized Difference Infrared Index), which is the spectral index, calculated from Sentinel-2 satellite imagery. By integrating both LAI and NDII, which assesses vegetation water content using near and mid-infrared bands, it was possible to develop accurate models for monitoring biomass in the field. In particular, the interaction of these two biomass predictors – LAI and NDII – allowed for the estimation of how the influence of one predictor changes depending on the level of the other. The interaction factor of LAI and NDII is especially relevant in cases where plant moisture varies. The regression model shows that the dependency of fresh biomass (FB) on LAI differs when the plants are drier or wetter. The introduction of the NDII index helped to differentiate these moist conditions, further refining the model. The model’s accuracy significantly improved after incorporating both indices.
The correlation coefficient (r) was 0.85 and the coefficient of determination (R2) was 0.72; these refer to the relationship between in situ biomass and predicted biomass, indicating a good fit between the model (1) and the empirical data. The introduction of the LAI*(1-NDII) factor helped avoid collinearity in the regression method and better described conditions where high vegetation moisture reduces the significance of LAI in fresh biomass estimation.
Soil moisture (SM) plays a key role in environmental research on grasslands and wetlands because it influences the cycles of water, energy, and carbon. SAR satellite data serves as a valuable tool for achieving this goal, particularly in areas where conducting in situ SM measurements is impractical or economically unfeasible, as it can provide data even under cloud cover. Numerous research articles discuss various remote sensing methods for evaluating soil moisture levels. SAR data offer significant advantages for regular spatial monitoring due to their insensitivity to weather conditions. Li et al. (2021) conducted an extensive literature review to establish a methodology for retrieving soil moisture information from SAR data. They demonstrated that microwave backscatter (σº) is influenced by the moisture content and surface roughness of the canopy-soil layer, as well as by satellite sensor settings such as incident angle and electromagnetic wave polarization (Allen & Ulaby 1984).
In situ soil moisture [%] measurements were conducted to explore correlations with satellite imagery on vegetation growth conditions. Sentinel-1 Level-1 GRDH products in IWS acquisition mode (spatial resolution 10 × 10 m) were used, acquired in C-band (5.5 GHz) with VV and VH dual polarization. Data were downloaded from SciHUB and processed using the Sentinel-1 Toolbox (SNAP S1TBX v. 10.0.0), including speckle filtering, radiometric calibration, terrain flattening, and conversion to backscattering coefficient (σ°) in dB.
The detailed derivation of the model leading to the inversion of SM from backscattering coefficients can be found in Dąbrowska-Zielińska et al. (2012, 2015). These works outline the methodology based on the modified Water Cloud Model (WCM), in which the total backscattering coefficient (σ°) is the sum of vegetation (σ°veg) and soil (σ°soil) components, with the attenuation caused by vegetation described using the two-way canopy attenuation factor (τ2). The current project builds upon and refines this model, originally developed in 2017 at the Institute of Geodesy and Cartography. To adapt the model to diverse terrain conditions, a series of field campaigns to measure soil moisture levels were conducted within the GrasSAT project.
During these campaigns, backscattering coefficient values for VV dB, VH dB, and VH/VV dB were extracted and calculated from processed SAR data to identify patterns and correlations between SAR satellite backscatter and soil moisture. Vegetation descriptors were introduced into the original model equation for σ° (sigma nought as VH/VV and VH-VV). The collected data from approximately 130 ground control points were used to calibrate the numerical coefficients for soil moisture retrieval, further enhancing the model’s accuracy for varied terrain. Soil moisture product was generated specifically for natural grasslands, calculated using a dedicated moisture retrieval algorithm:
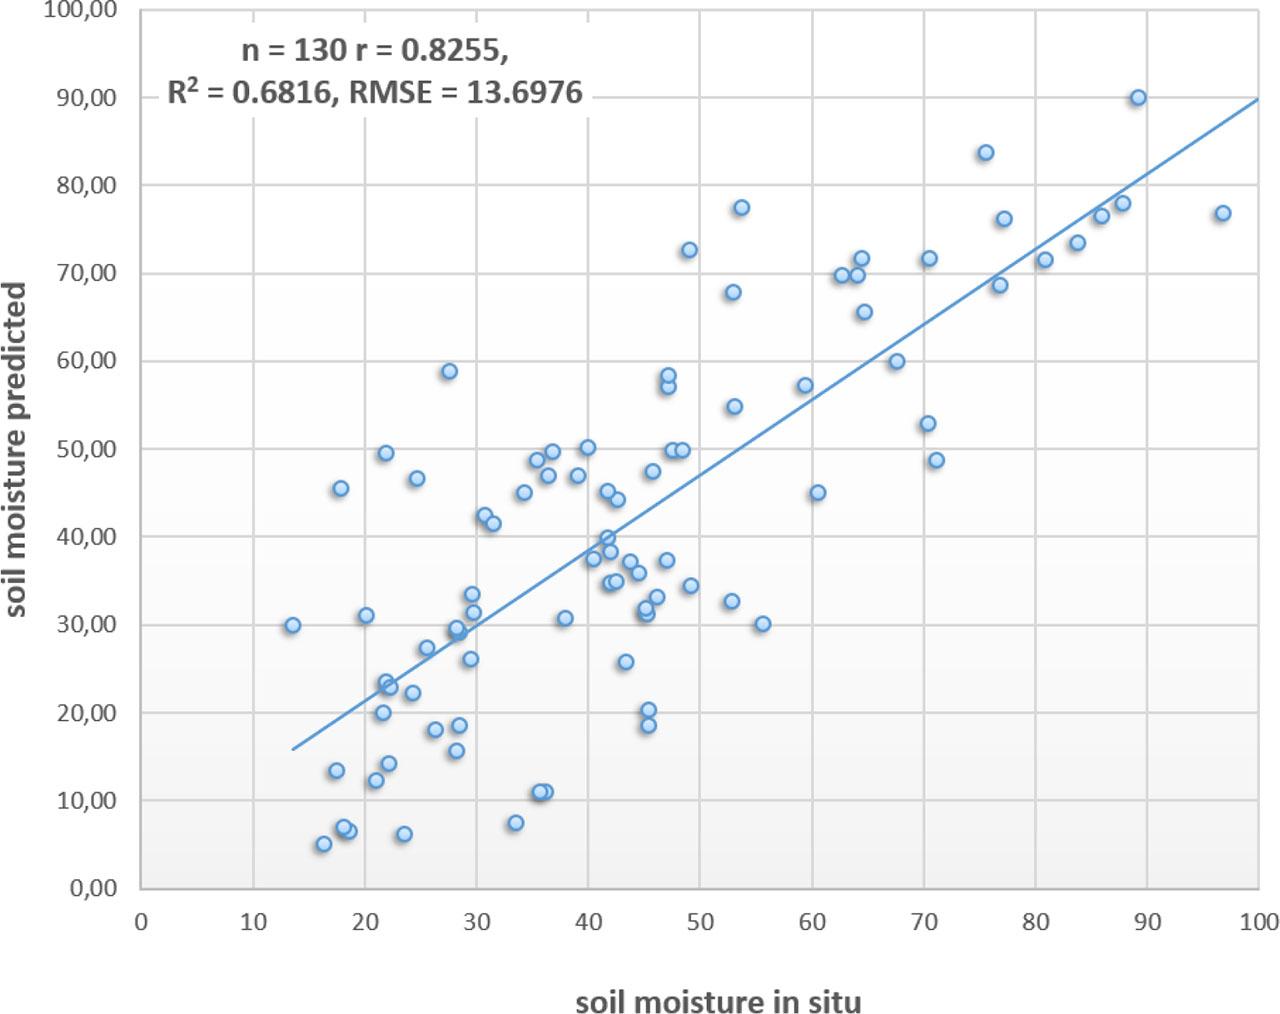
Scatter plot of modelled SM for natural grasslands vs SM in situ
Source: own elaboration
Radar backscatter analysis derived from Sentinel-1 C-band data was a crucial tool for the improved detection of signals originating directly from the soil surface, including moisture content. Linear regression was applied to create a model (2) to describe the relationship between backscatter coefficient and soil moisture, utilizing in situ data as reference variables. Cross-validation techniques were employed to ensure model robustness. The performance statistics for correlation were evaluated using various indicators, including Pearson’s correlation coefficient (r), the coefficient of determination (R2), which is the square of the correlation coefficient, and Root Mean Square Error (RMSE). The final models achieved accuracy levels with the following parameters: r = 0.8255, R2 = 0.6816, RMSE = 13.6976. Furthermore, ground measurements were used for cross-validation to assess the suitability of the index that best characterizes drought severity. The validation method involved compiling and comparing soil moisture values obtained from the calibrated model with actual values acquired from in situ measurements on a specific date.
Recent studies on monitoring grasslands using remote sensing techniques highlight the importance of validating satellite data with ground truth measurements, as reflected in such results as biomass estimations (Panek-Chwastyk et al. 2024). Whilst various remote sensing vegetation indices have been used in these studies to estimate biophysical parameters characterizing the state and condition of grasslands, incorporating the analysis of reference data quality, measured in the field, remains a challenge for assessing the reliability of such data. Similar conclusions from international studies include the findings of Doughty et al. (2021), who established a relationship between NDVI derived from Landsat and UAV data and biomass measured in situ.
The analysis of LAI derived from CLMS, compared to field measurements, demonstrated a Pearson’s correlation coefficient of r = 0.925. This result aligns with the findings of the Validation Report (Fernando et al. 2021), which showed high correlations (r = 0.92) in their LAI assessments across various ecosystems using remote sensing data, emphasizing the critical role of localized validation in remote sensing methodologies. Therefore, reliable ground truth data, accurately measured in the field, is essential for validating the quality of satellite products offered within the Copernicus Programme, thus enabling their application in developmental and implementation research.
In comparison with the studies by Naicker et al. (2024), in which WorldView-3 imagery was used, the GrasSAT model for biomass demonstrated high accuracy (R2 = 0.72, r = 0.85), surpassing the performance of the modified NDVI-based model (R2 = 0.71). In contrast, research revealed lower determination coefficients (R2 = 0.51 and R2 = 0.65) in the Brazilian Pampa region (Filho et al. 2020), where multiple linear regression was applied to Sentinel-2 data. These findings highlight the significant role of the red-edge band in biomass estimation, though the model’s accuracy was lower than the one based on LAI and NDII. The results suggest that integrating spectral indices with environmental factors notably enhances biomass prediction accuracy. Additionally, studies by Panek-Chwastyk et al. (2024) in biomass estimations for grass, using the AquaCrop model, revealed a strong correlation between LAI and fresh biomass, reinforcing the association of higher LAI values with increased biomass accumulation. Furthermore, Upreti et al. (2019) compared hybrid methods for estimating biophysical variables such as LAI, leaf chlorophyll content (LCC), fraction of absorbed photosynthetically active radiation (FAPAR), fraction of vegetation cover (FVC), and canopy chlorophyll content (CCC) using Sentinel-2 satellite data. Validation was carried out using ground data from two study sites: Shunyi in China and Maccarese in Italy. Relying on LAI, the highest ground validation accuracy for both sites was achieved using least squares linear regression (LSLR) and partial least squares regression (PLSR), with R2 = 0.78 and RMSE = 0.68 m2. Moreover, Bochenek et al. (2017) and Dong et al. (2020) found that reliably calculated LAI provides accurate biomass estimation results for crops such as wheat, soybean, oats, maize, canola, and black beans. Similarly, Punalekar et al. (2018) reported that the R2 values between pasture biomass and LAI ranged from 0.16–0.73 for LAI derived from NDVI, and from 0.22–0.76 for LAI based on the radiation transfer model. Additionally, Dusseux et al. (2015) confirmed that LAI outperformed NDVI and fCOVER, achieving the highest biomass estimation accuracy (R2 = 0.68).
Soil moisture modelling, based on backscatter coefficients derived from SAR data, revealed strong correlations with soil moisture levels. Sekertekin et al. (2020) demonstrated the effectiveness of the Water Cloud Model (WCM) in mitigating vegetation backscatter effects, achieving high accuracy (R2 = 0.73, RMSE = 1.76 vol%). In contrast, the SAR backscattering ratio method proposed by Xing et al. (2022) achieved lower accuracy (R2 = 0.68) and a higher RMSE (4.15 vol%). Similar correlation values have been observed in soil moisture determination, though with reduced accuracy, possibly due to the different types of grasslands studied and variations in the application of the WCM. The GrasSAT study area exhibited significant variability in vegetation types across measurement points and notable microrelief diversity, which contributed to high moisture variability in field measurements, even within a single S-1 pixel (up to 20%). Additionally, different vegetation descriptors can be used in WCM, including radar-based ones such as VH/VV DpRVI (Chen et al. 2022; Li & Wang 2018; Wang et al. 2021) or optical ones such as LAI or NDVI (Baghdadi et al. 2017; Xing et al. 2022). In the latter cases, this essentially involves a fusion of radar and optical data. Many authors have demonstrated that incorporating soil roughness descriptors into the WCM model (Sekertekin et al. 2020; Xing et al. 2022) can significantly improve result accuracy. A comparison of this study with others shows that the GrasSAT project collected high-quality reference data with a wide range of moisture variability (from 12% to 98%), which is not typical in other studies. It is also evident that the obtained results could be further improved in future research by including soil roughness modelling in the analysis.
This study introduces a novel approach by examining the relationship between soil moisture and vegetation biomass in grasslands across a broad range of moisture conditions, from 20 to 90 vol%, and diverse vegetation types. The developed models for soil moisture retrieval provide a robust tool for monitoring grasslands and wetland ecosystems, offering valuable support for decision-making and early warning systems. Furthermore, the innovative nature of this study lies in its comprehensive approach, integrating advanced field sampling techniques with satellite data tailored to the specific conditions of Polish grassland ecosystems. The combination of LAI and NDII enabled precise modelling of vegetation moisture, drought detection, and the elimination of signal saturation effects, providing a significant advantage over traditional and commonly used vegetation indices (Bartold et al. 2024; Dąbrowska-Zielińska et al. 2024).
The GrasSAT project demonstrated the effectiveness of an integrated approach that combines remote sensing data with field measurements to monitor the growth conditions of grassland vegetation across various environmental and soil conditions in Poland. In situ measurements are essential for validating satellite-derived vegetation indices, such as LAI from CLMS, as well as for assessing biomass and SM through radar remote sensing data. As previous studies in Poland have shown (Bochenek et al. 2017; Dąbrowska-Zielińska et al. 2012, 2015; Gurdak & Bartold 2021), biomass and humidity modelling relied on single variables. Incorporating additional satellite data as independent variables and integrating this with ground truth data improves the accuracy and reliability of grassland condition assessments.
In situ measurements play a crucial role in enhancing the accuracy, reliability, and applicability of satellite-derived LAI, soil moisture, and biomass products, making them essential for ecological monitoring, agricultural assessments, and climate studies. The optimization of the LAI and the WCM model for different terrain conditions with ground truth data enabled more accurate biomass and SM estimations, respectively. The findings highlight the importance of integrating in situ measurements with remote sensing techniques to improve the accuracy and reliability of models by establishing relationships between satellite-derived indices and ground-based measurements of grassland ecosystems.