
Figure 1.
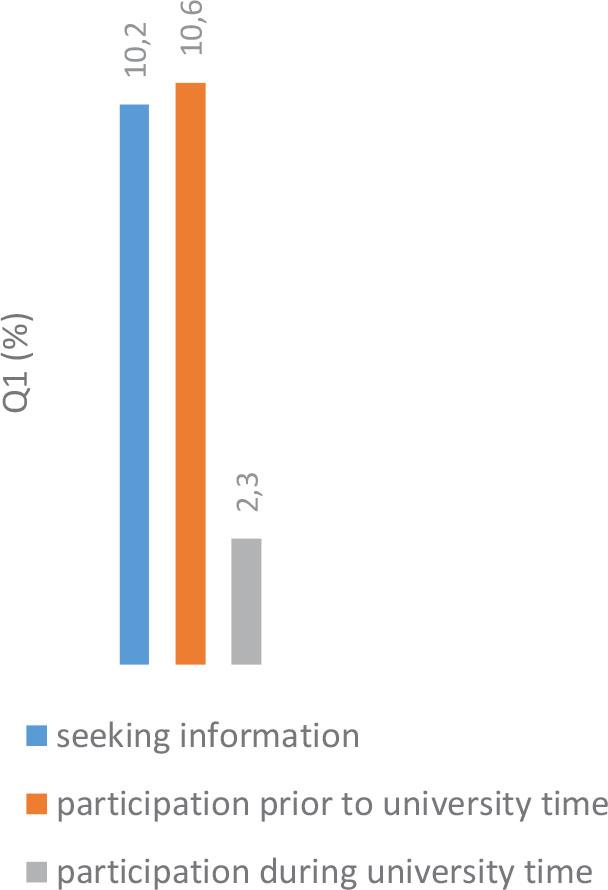
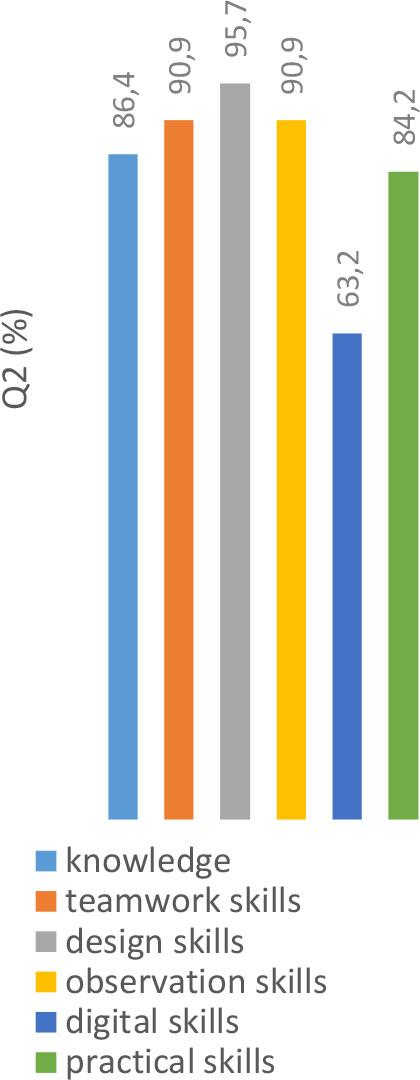
Figure 2.
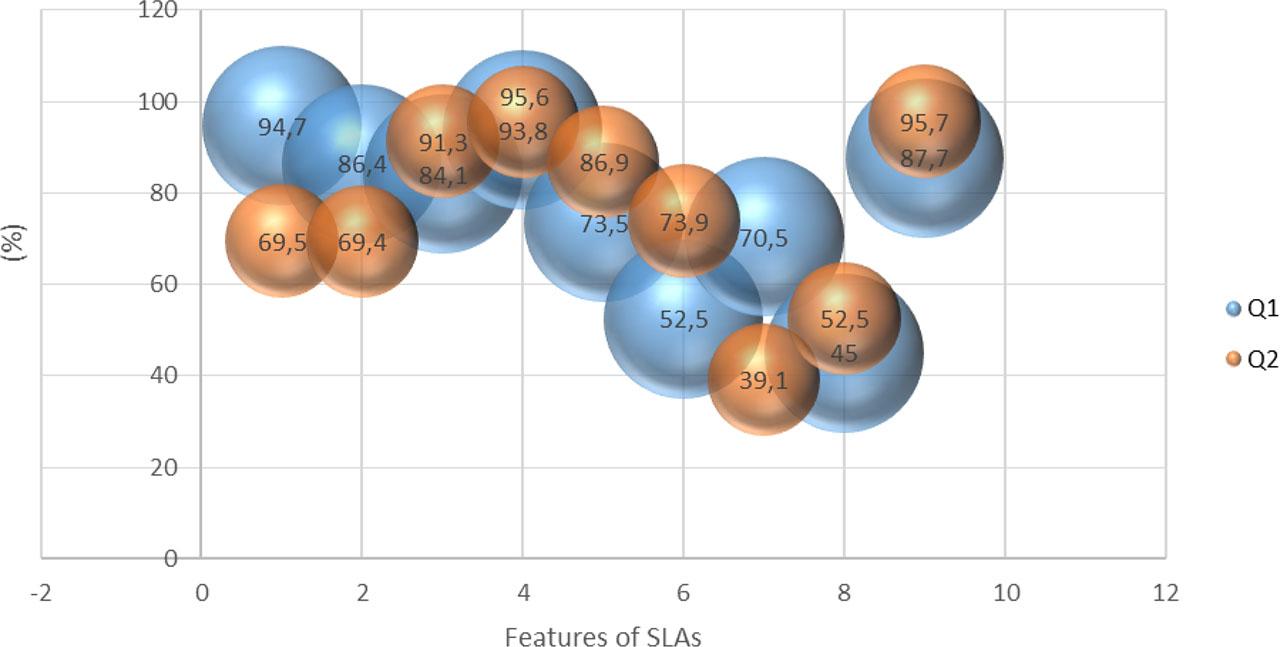
Figure 3.
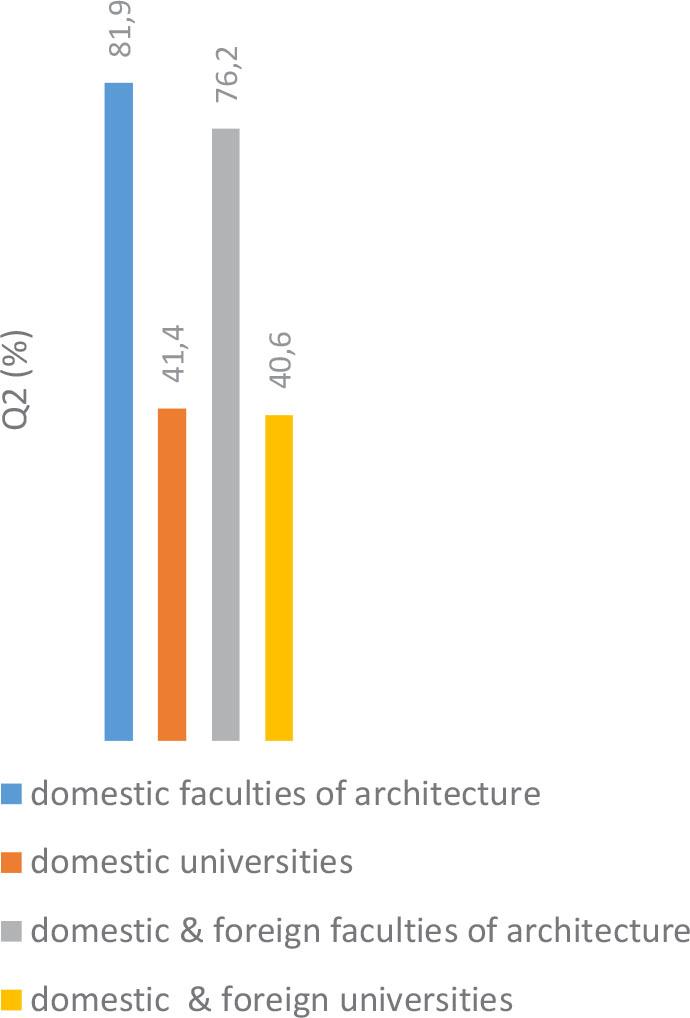
Figure 4.
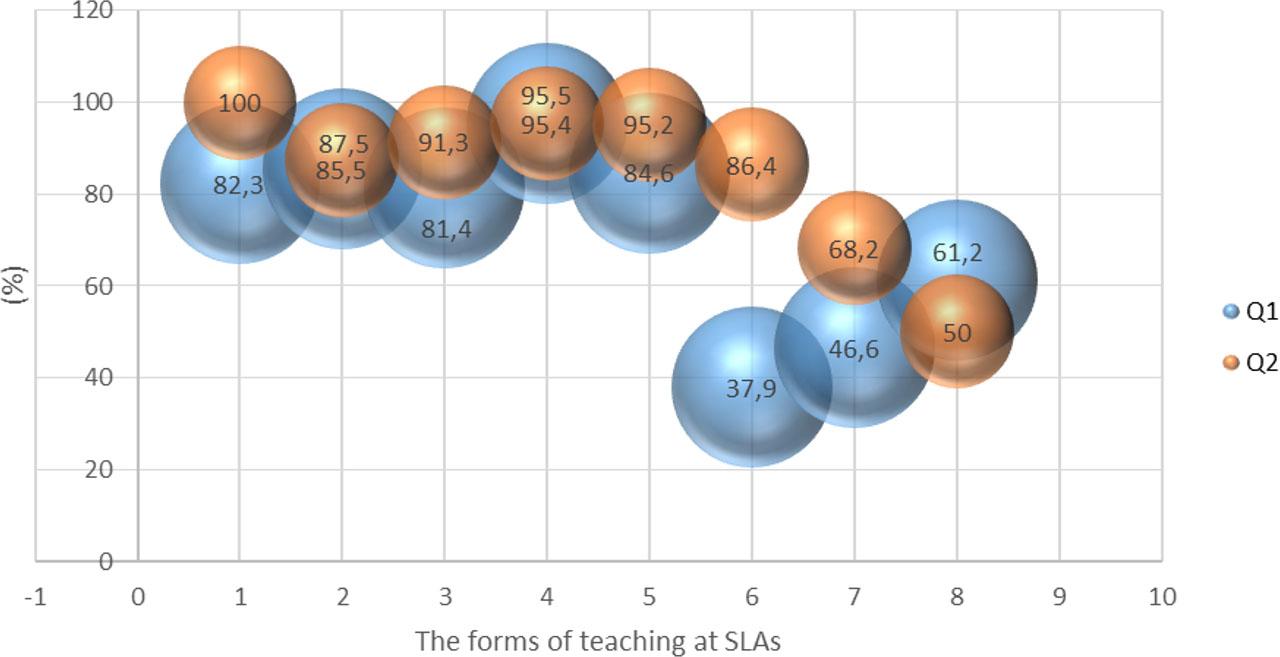
Figure 5.
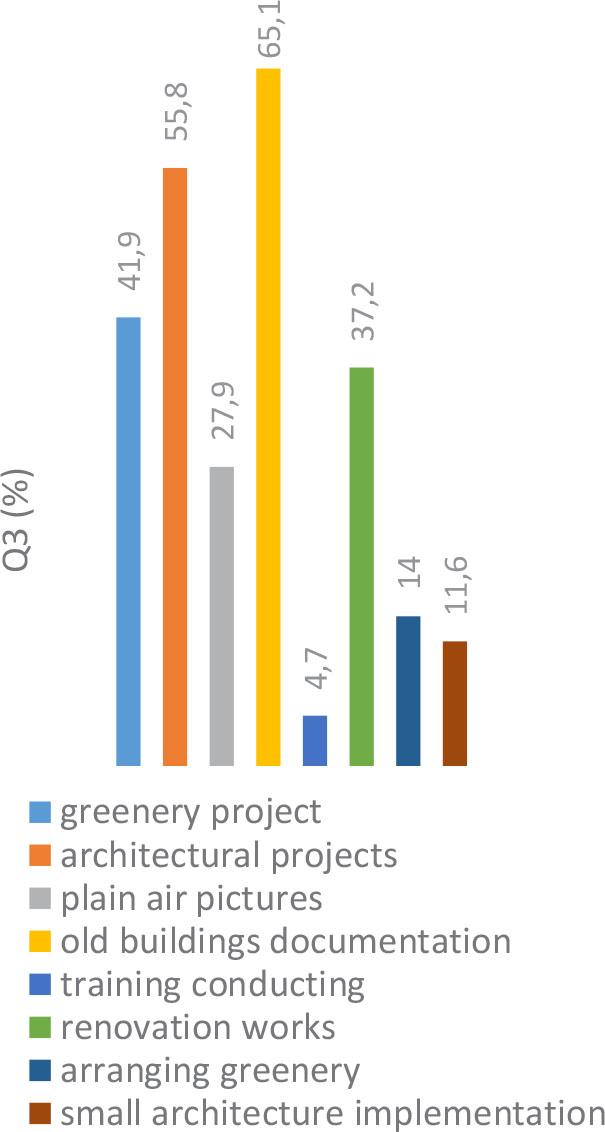
Figure 6.
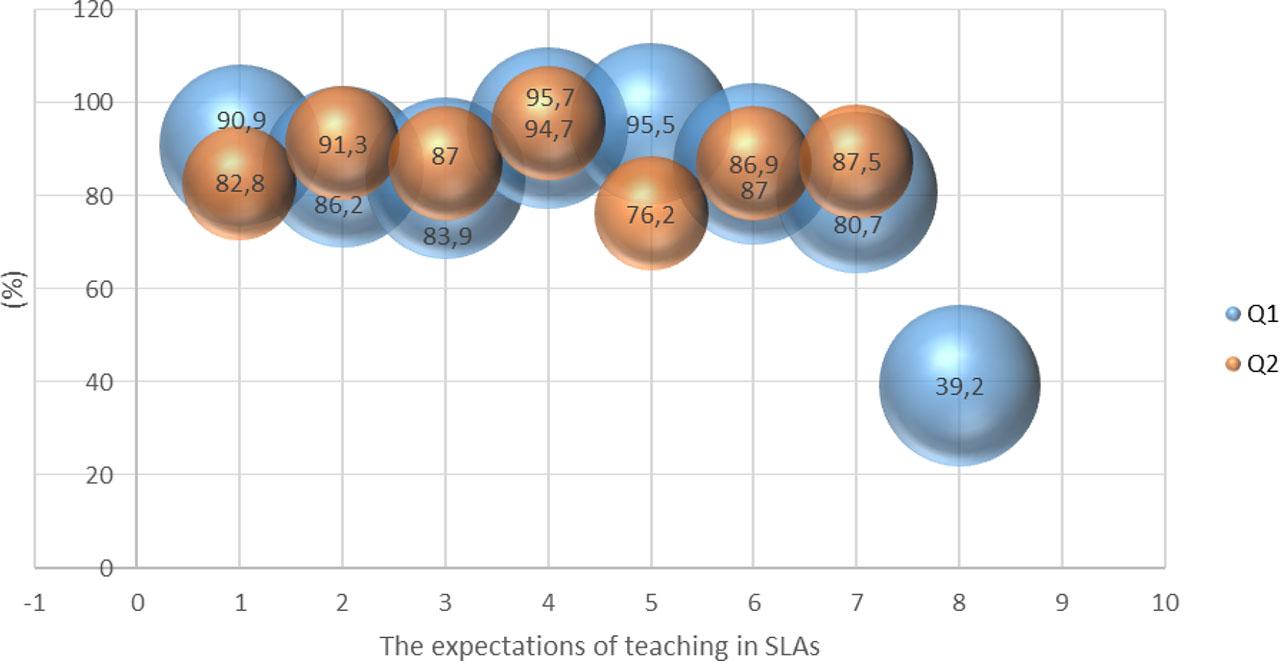
Figure 7.
Respondents to surveys
| Q1 | Q2 | Q3 | |
|---|---|---|---|
| Respondents | 132 | 23 | 43 |
| Women (%) | 77.3 | 78.3 | 46.5 |
SLAs offered at FAGUT
| FAGUT students | FAGUT+ students | |||
|---|---|---|---|---|
| Domestic | International | Domestic | International | |
| Recurring | 3 | - | 2 | 6 |
| Occasional | - | 1 | - | - |
Categories for describing SLAs in surveys
| Q1 Potential participants | Q2 Participants | Q3 Residents | |
|---|---|---|---|
| (1) Degree of interest in SLAs | + | − | + |
| (2) Information sources | + | + | + |
| (3) Formal features | + | + | − |
| (4) Teaching forms | + | + | + |
| (5) Expectations | + | + | + |
| (6) Effects | − | + | + |