Figure 1.
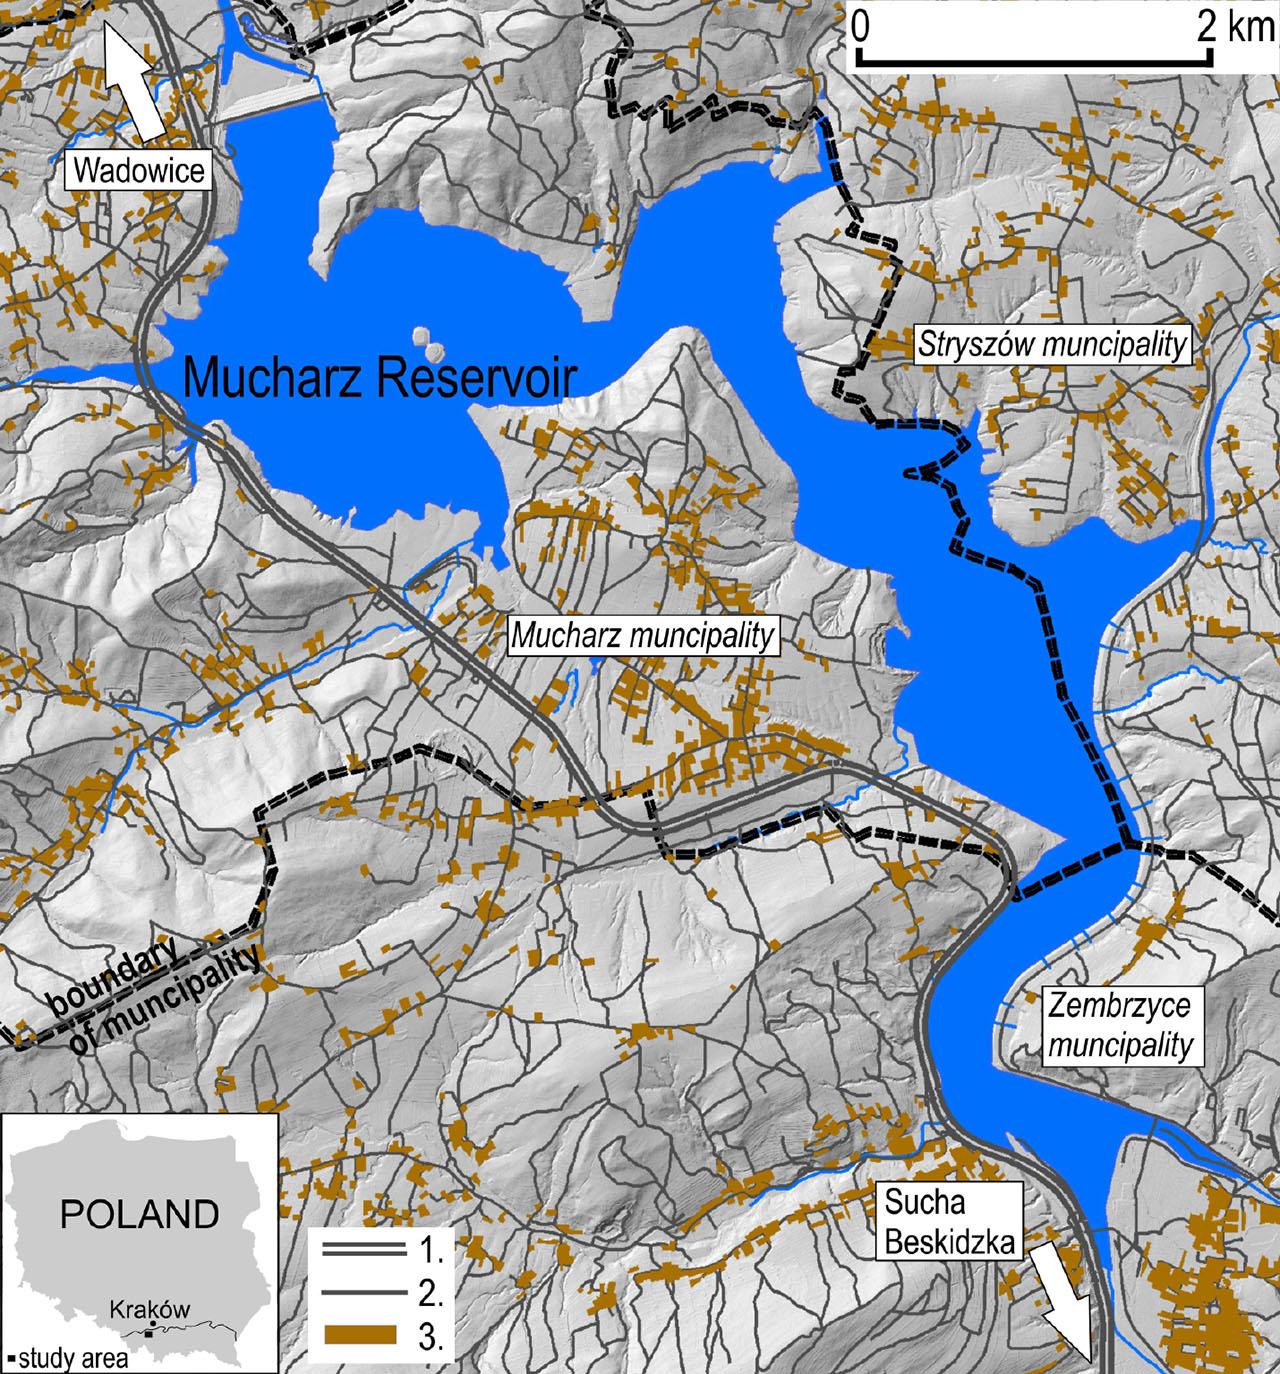
Figure 2.
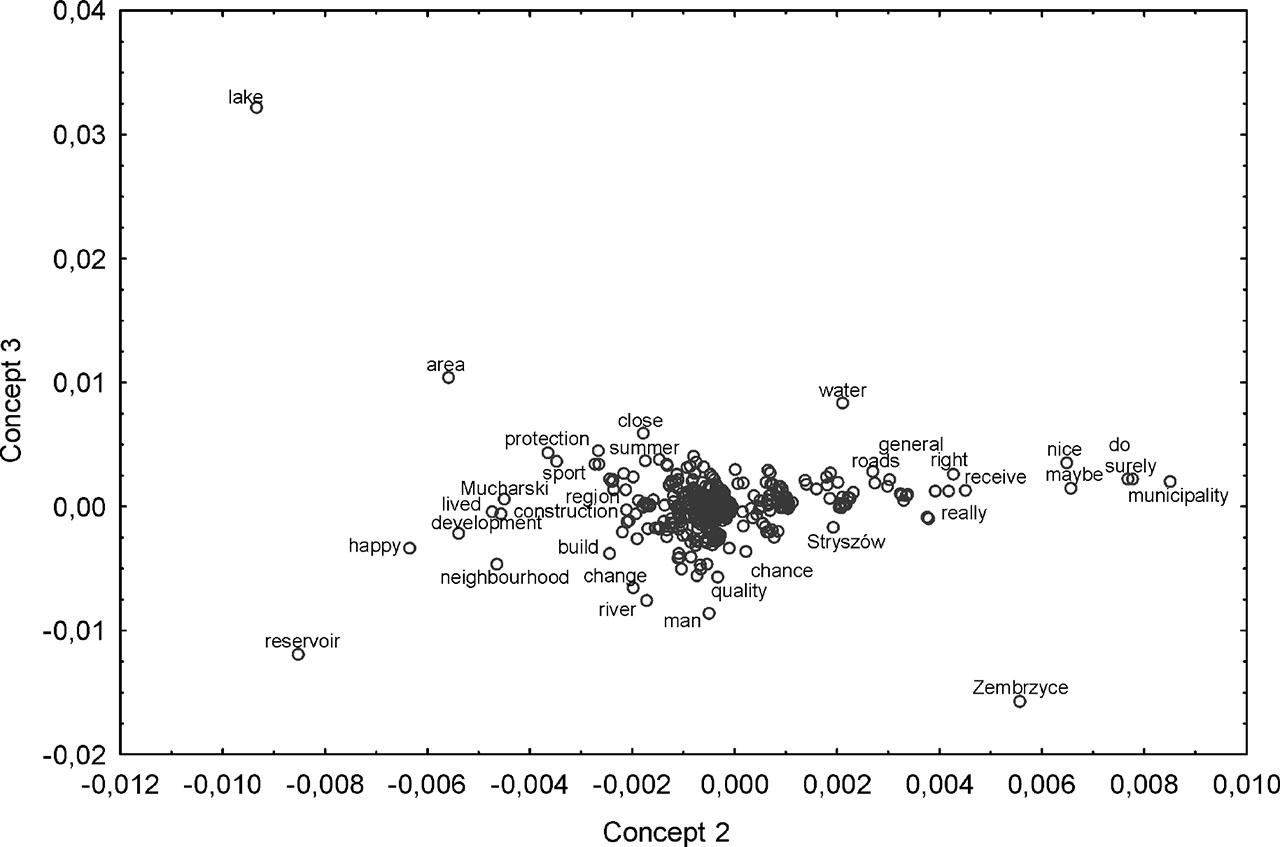
Figure 3.
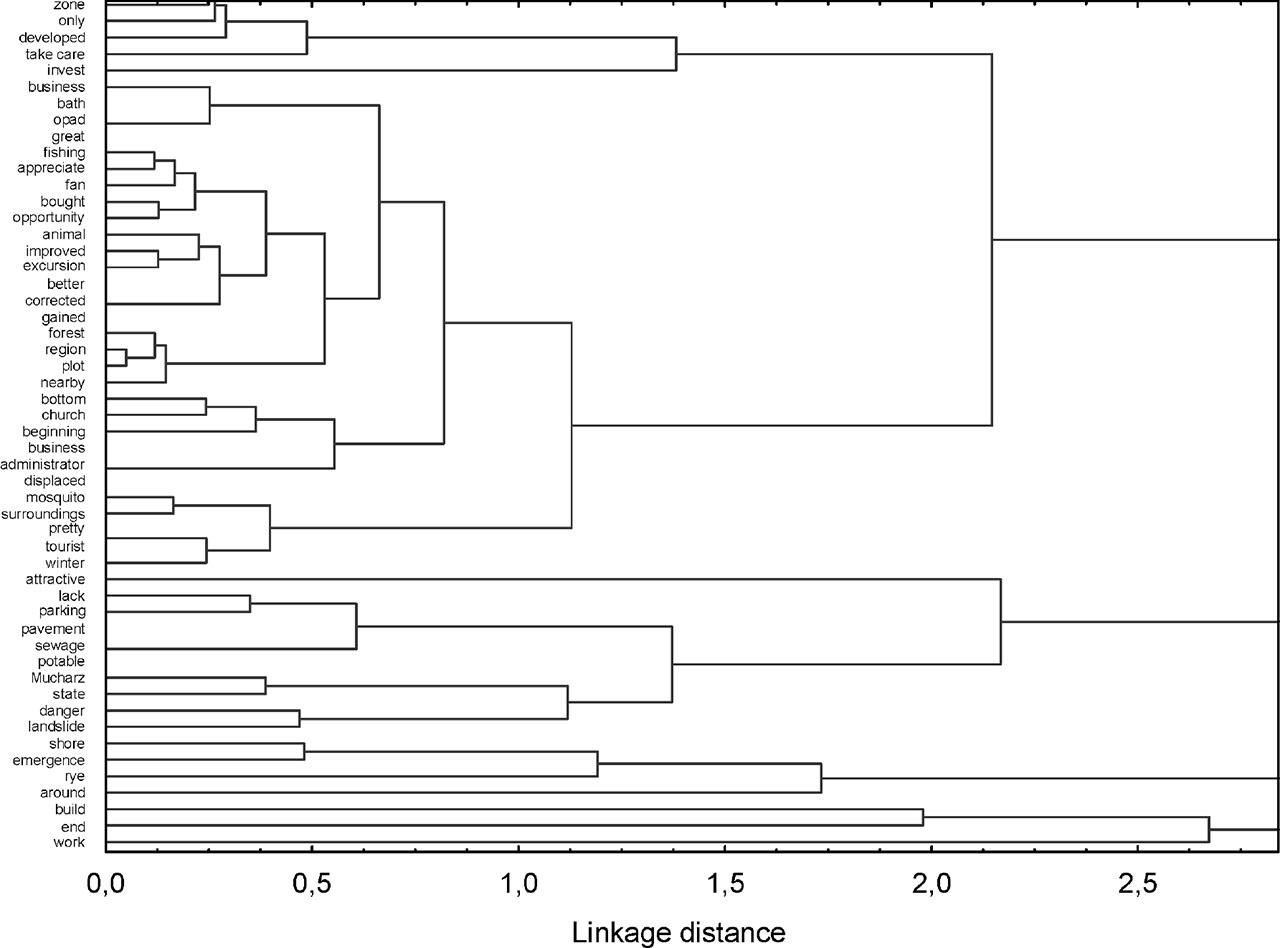
Figure 4.
Figure 5.
Figure 6.
Figure 7.
Descriptive characteristics of the surveyed population_ Data collected by the authors between September 2020 and January 2021_
| Community | Zembrzyce | (n) | 37 | (%) | 63 |
| Mucharz | 16 | 27 | |||
| Stryszów | 6 | 10 | |||
| Gender | Female | 39 | 66 | ||
| Male | 20 | 34 | |||
| Education level | Higher | 43 | 73 | ||
| Secondary | 15 | 25 | |||
| Primary | 1 | 2 | |||
| Age | >60 | 7 | 12 | ||
| 50–60 | 14 | 24 | |||
| 40–50 | 11 | 19 | |||
| 30–40 | 21 | 36 | |||
| 20–30 | 6 | 10 |