
Table 1.
The Survey Sample Structure
| population category | 0–300 | 301–500 | 501–1,000 | 1,001–3,000 | 3,001–5,000 | 5,000–10,000 | 10,001+ | Total |
|---|---|---|---|---|---|---|---|---|
| number of municipalities | 149 | 115 | 149 | 149 | 47 | 33 | 33 | 675 |
| of which, from border regions | 21 | 23 | 39 | 54 | 19 | 11 | 9 | 176 |
[i] Source: Own survey (2020)
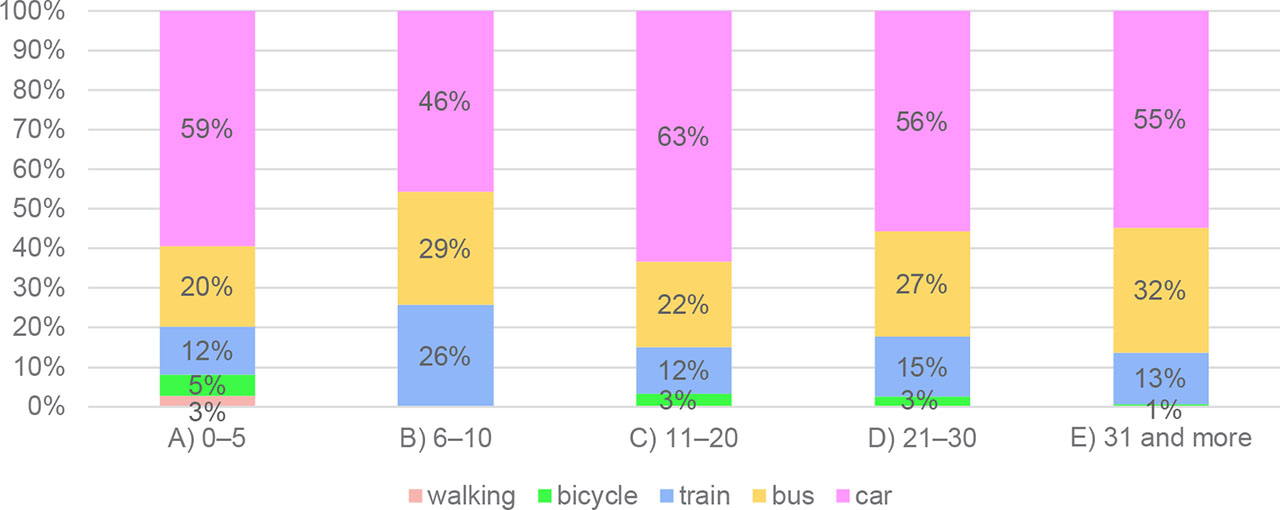
Figure 1.
Combination of modes of transport used in cross-border mobility by distance to a border
Source: own survey, own processing
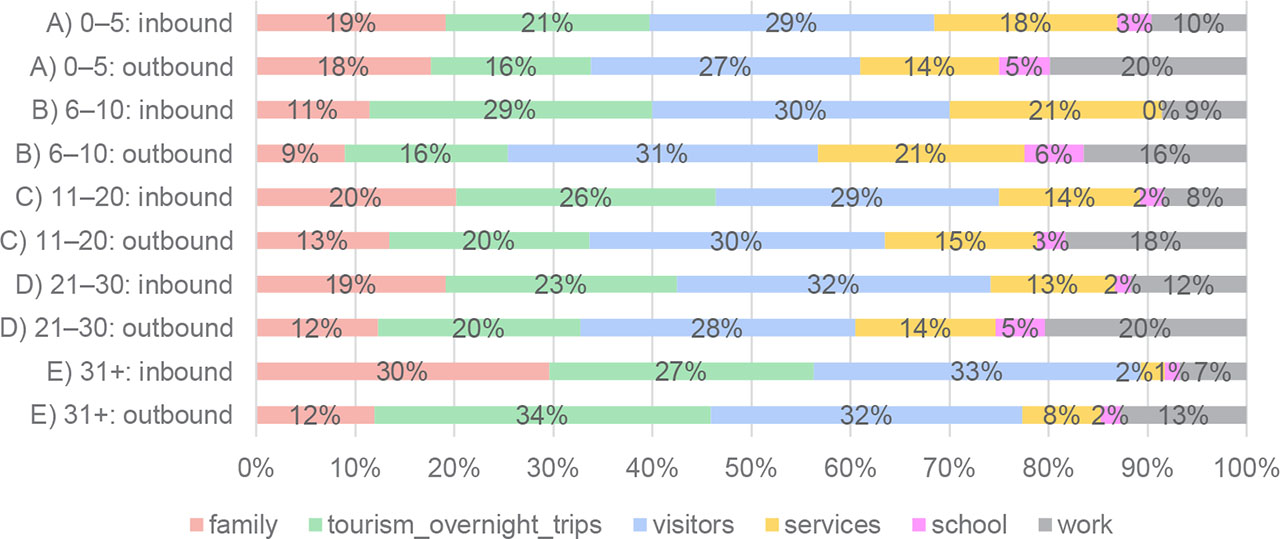
Figure 2.
Outbound and inbound cross-border mobility motivation by distance to a border
Source: own survey, own processing
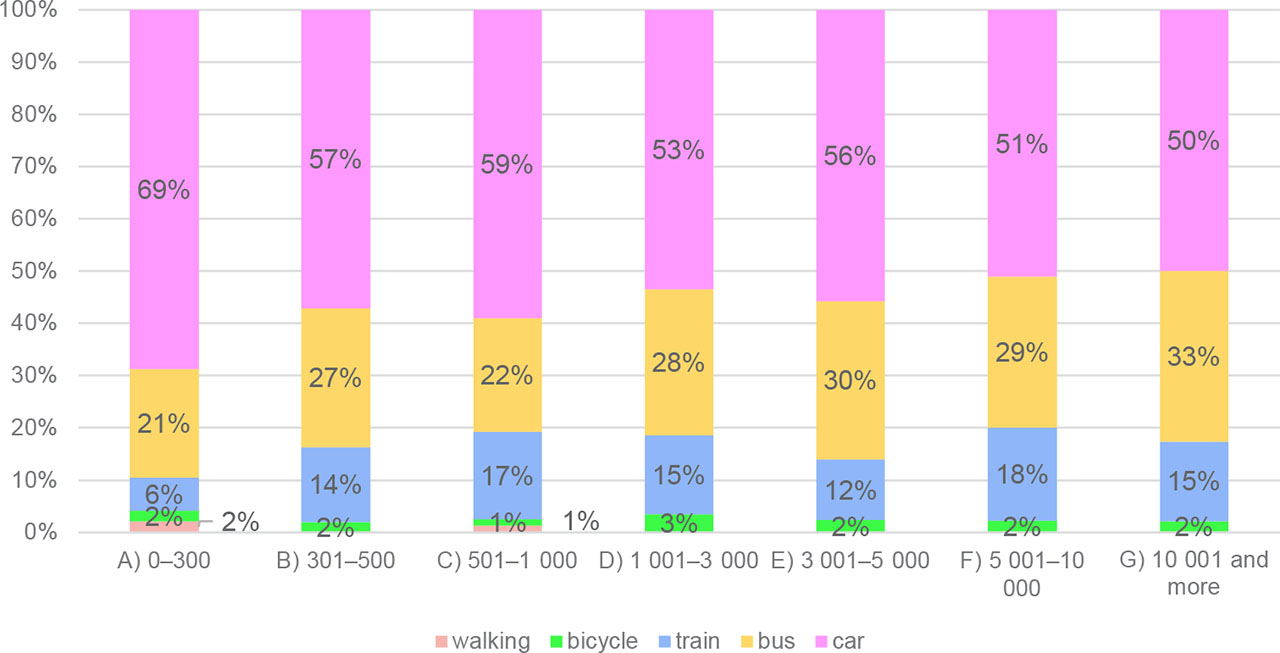
Figure 3.
Combination of modes of transport used in cross-border mobility by municipal population size
Source: own survey, own processing
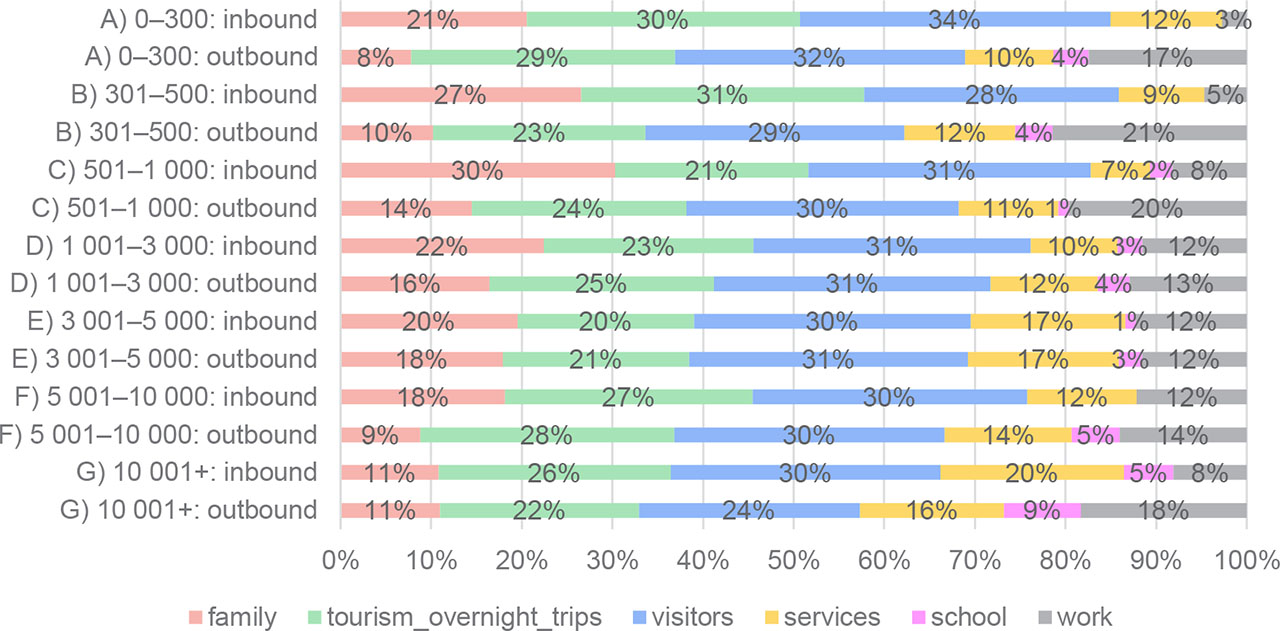
Figure 4.
Outbound and inbound cross-border mobility motivation by population
Source: own survey, own processing
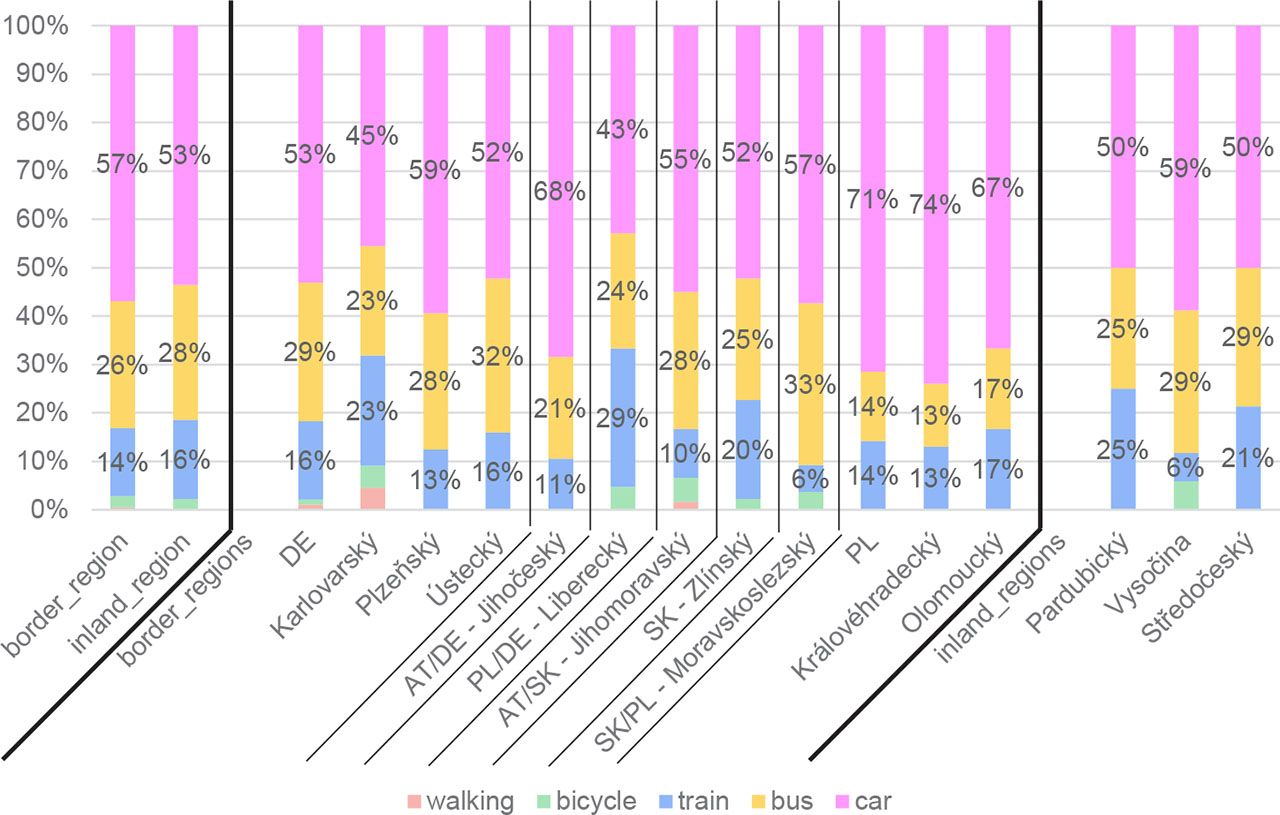
Figure 5.
Combination of modes of transport used in cross-border mobility by border and region
Source: own survey, own processing
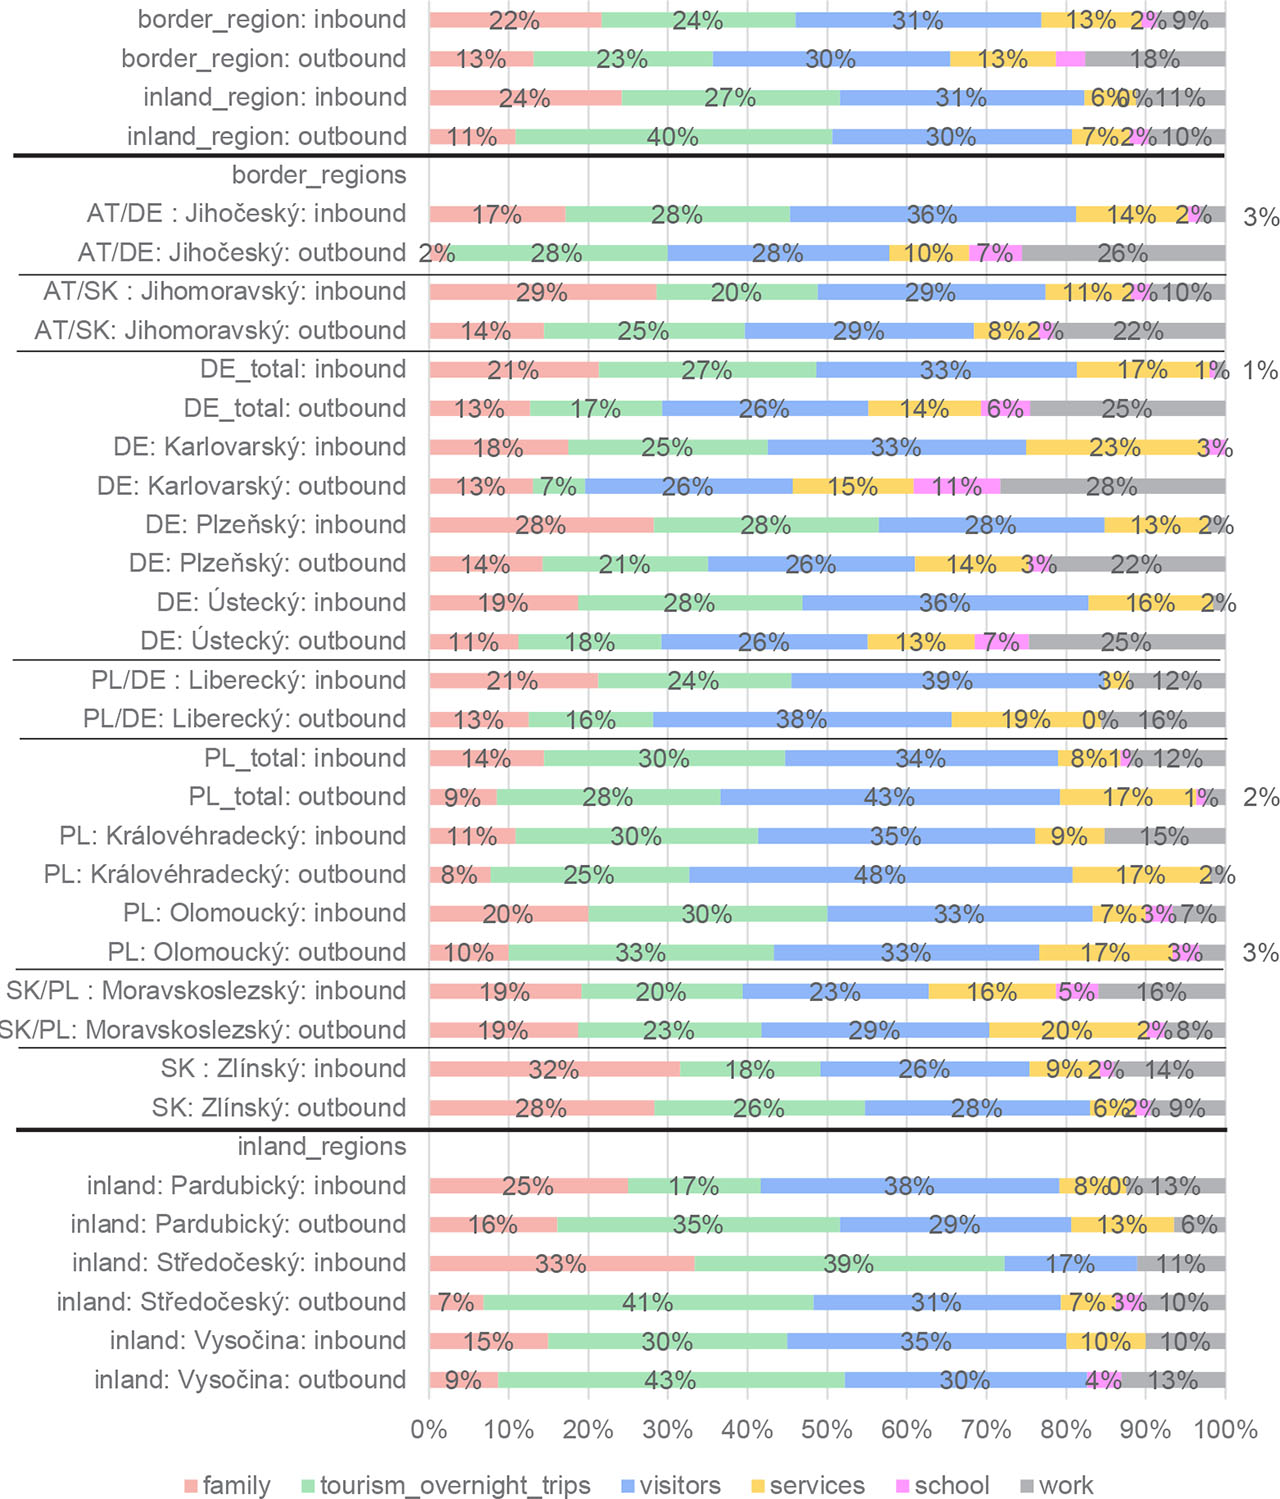
Figure 6.
Outbound cross-border mobility motivation by border and region
Source: own survey, own processing
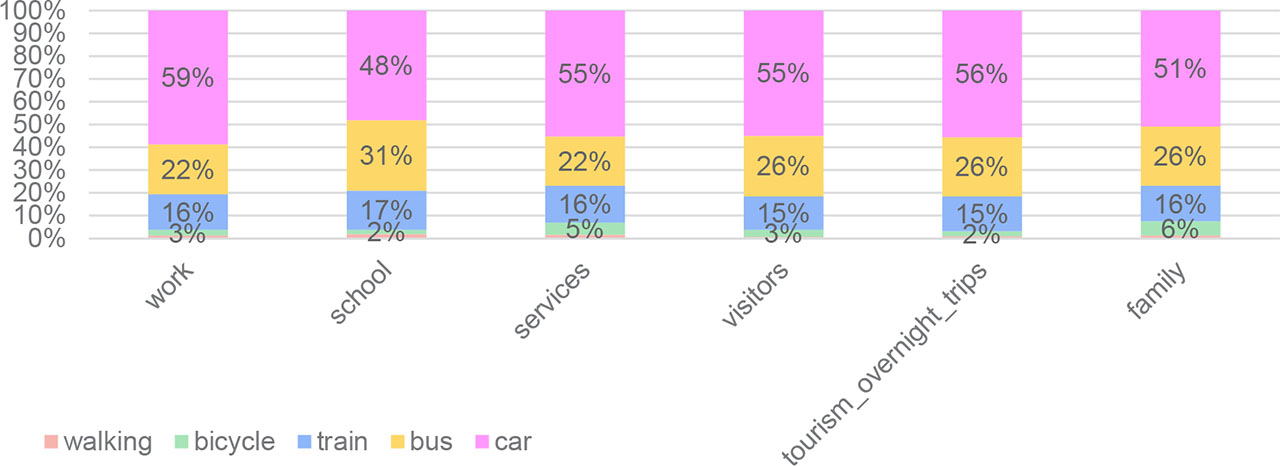
Figure 7.
Combination of modes of transport used in cross-border mobility by travel purpose
Source: own survey, own processing
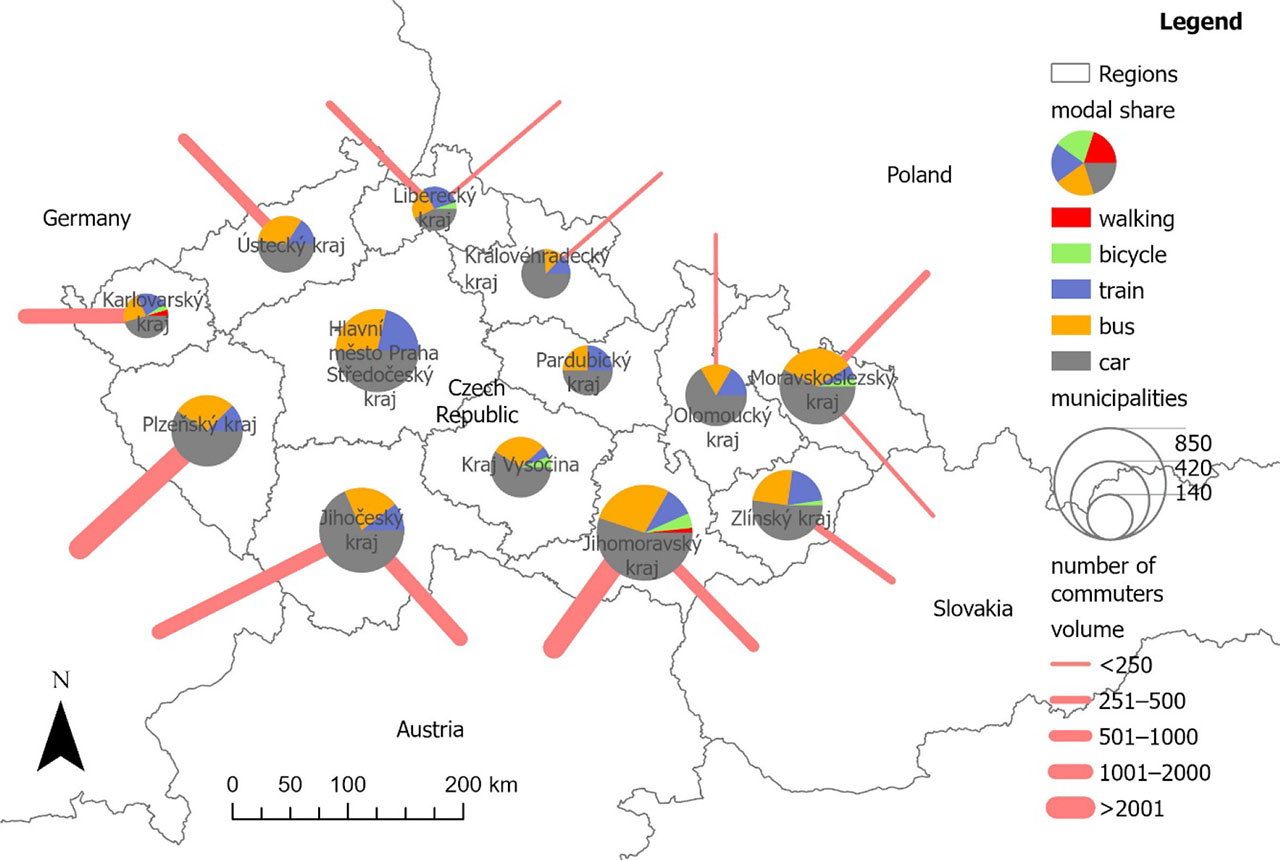
Figure 8.
Combination of modes of transport used and commuter volumes in relevant cross-border connections
Source: own survey, own processing