
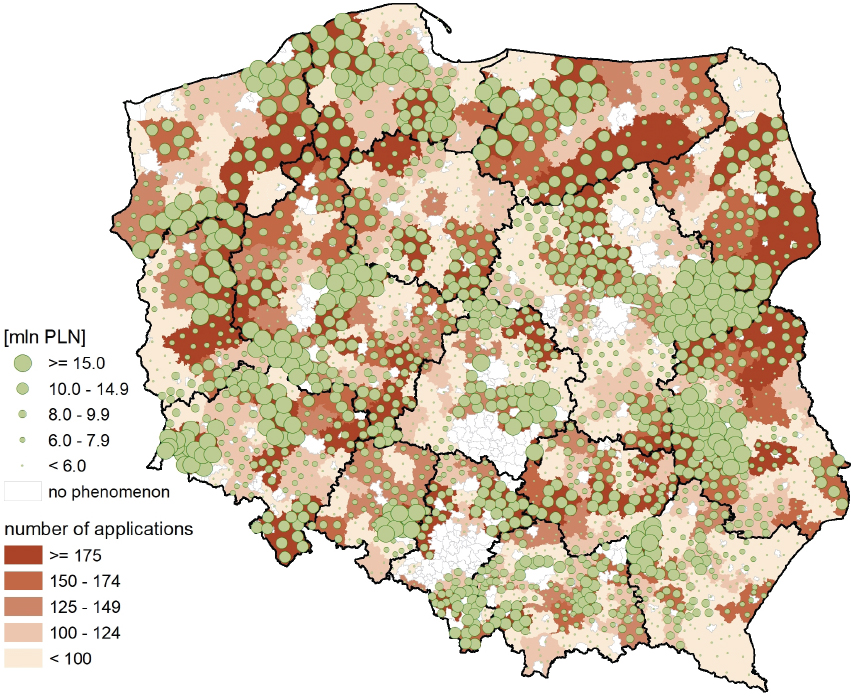
Figure 1
Number of completed projects and amount of payments under the Leader axis
Source: own study based on the ARMA data
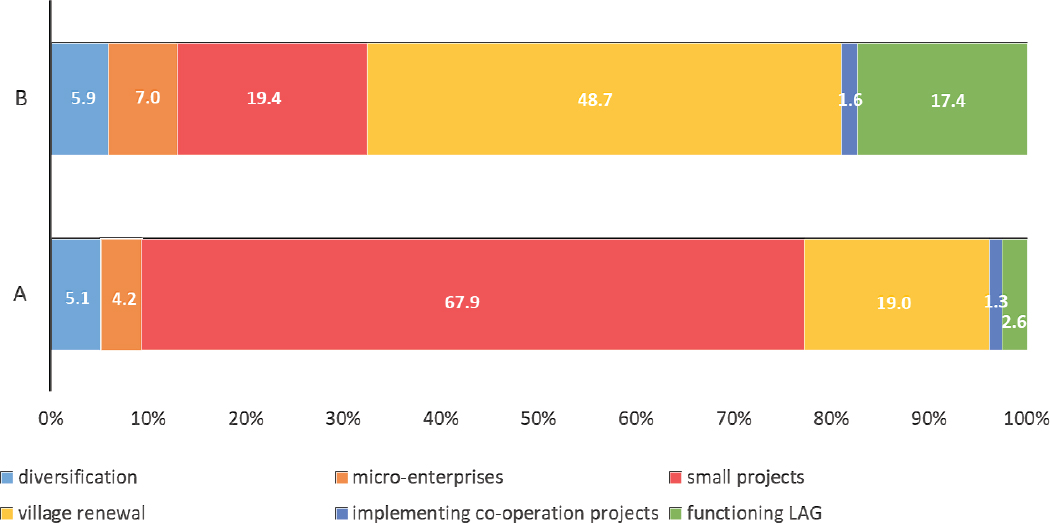
Figure 2
Structure of implemented activities by numbers of applications (A), payment size (B)
Source : own study based on the ARMA data
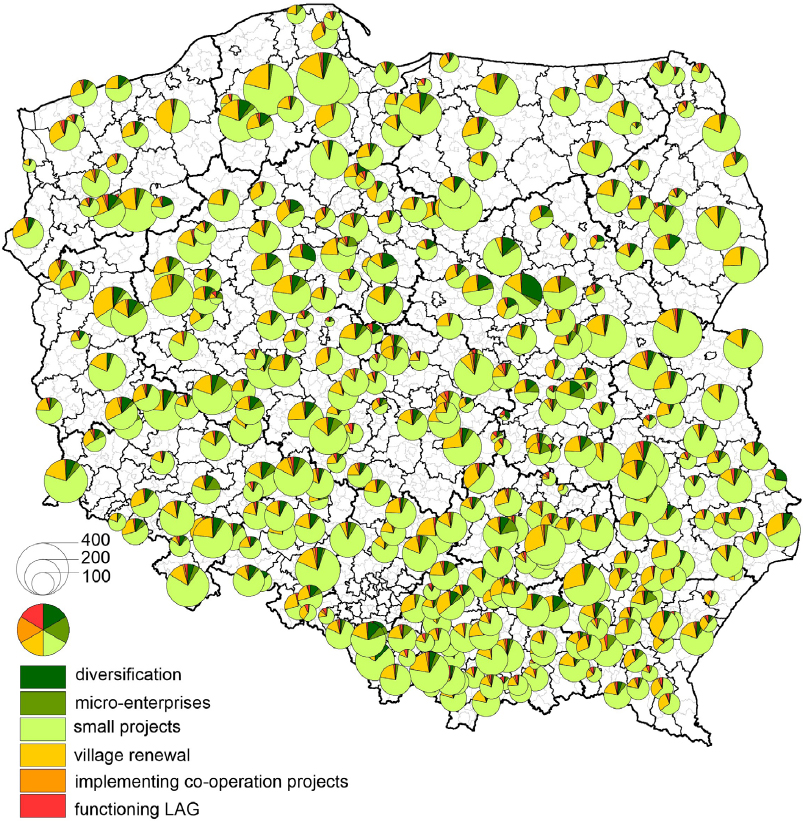
Figure 3
Directions of implemented activities from the Leader axis [Number and directions of implemented activities from the Leader axis]
Source: own study based on the ARMA data
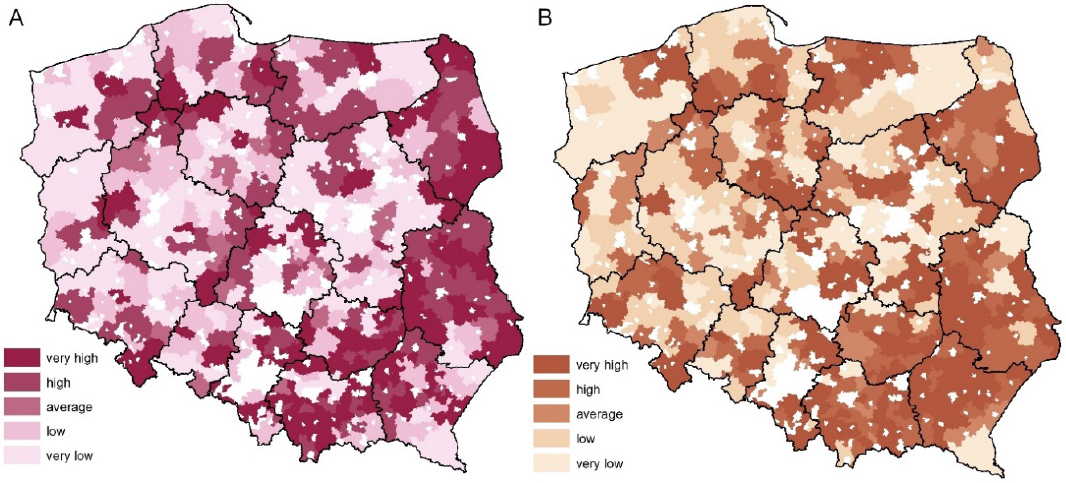
Figure 4
Activity level (A) and efficiency (B) from the Leader axis – synthetic indicator
Source: own study based on the ARMA data
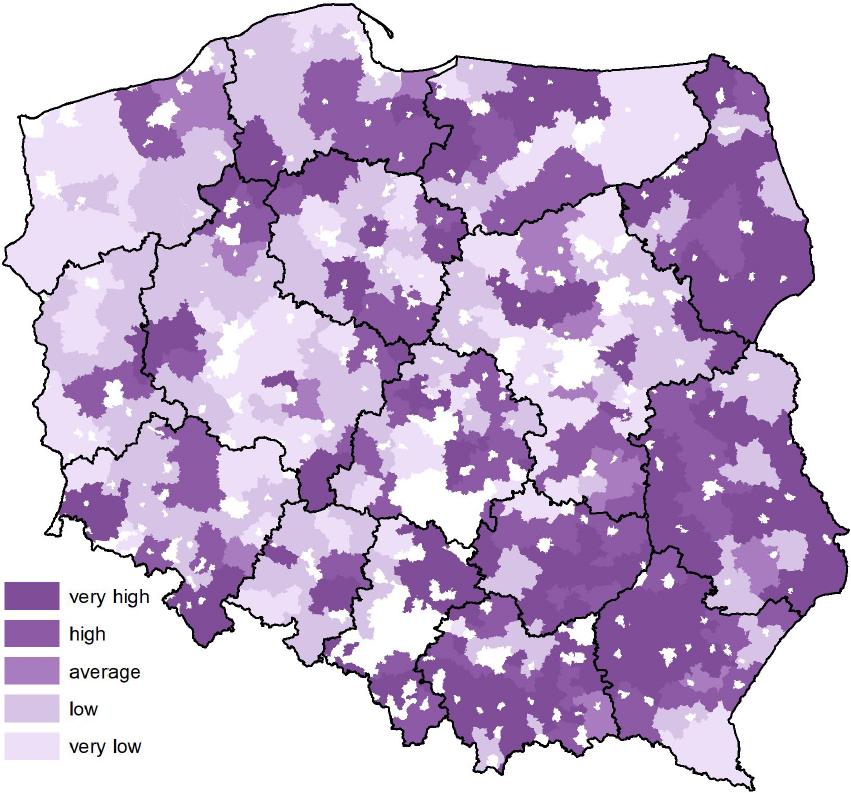
Figure 5
Total synthetic index of the absorption level of funds from the Leader approach
Source: own study based on the ARMA data