
Table 1
VHRS optical satellite data parameters
| Satellite/Sensor | Ikonos | Eros A | QuickBird | OrbView-3 | Eros B | KOMP SAT-2 | CARTO SAT-2 | World-View-1 | |
|---|---|---|---|---|---|---|---|---|---|
| Nationality/Company | GeoEye (previously Space Imaging), USA | ImageSat International, Israel | Digital Globe, USA | OrbImage, USA | ImageSat International, Israel | KARI, South Korea | ISRO, India | Digital Globe, USA | |
| Operating time | since 24.09.1999 | since 05.12.2000 | 18.10.2001 – 17.12.2014 | 26.06.2003 – 03.2007 | since 25.04.2006 | since 28.07.2006 | since 10.01.2007 | since 18.09.2007 | |
| Orbit altitude [km] | 681-709 | 475-491 | 450 | 470 | 500 | 685 | 630 | 496 | |
| Spectral bands [um] | PAN | 0.45-0.90 | 0.50-0.90 | 0.45-0.90 | 0.45-0.90 | 0.50-0.90 | 0.50-0.90 | 0.50-0.85 | 0.45-0.80 |
| MS | 0.45-0.52 | 0.45-0.52 | 0.45-0.52 | 0.45-0.52 | |||||
| 0.52-0.61 | 0.52-0.60 | 0.52-0.60 | 0.52-0.60 | ||||||
| 0.64-0.72 | 0.63-0.69 | 0.62-0.69 | 0.63-0.69 | ||||||
| 0.72-0.88 | 0.76-0.90 | 0.76-0.90 | 0.76-0.90 | ||||||
| Spatial resolution[m] | PAN | 0.82×0.82 | 1.0×1.0 -1.8×1.8 | 0.61×0.61 | 1×1 | 0.7×0.7 | 1×1 | 0.8×0.8 | 0.50×0.50 |
| MS | 3.28×3.28 | 2.44×2.44 | 4×4 | 1.9×1.9 | 4×4 | ||||
| Radiometric resolution [bit] | 11 | 11 | 11 | 11 | 11 | 10 | 11 | 11 | |
| Footprint [km] | 11×11 | 13.5×13.5 | 16×16 | 8×8 | 14×14 | 15×15 | 9.6×9.6 | 17.6×17.6 | |
| Maximum angle of incidence | +/- 45° | +/- 43° | +/- 30° | +/- 45° | +/- 45° | +/- 60° | +/- 45° | +/- 45° | |
| Satellite/ Sensor | Geoeye-1 | WorldView-2 | CartoSat-2B | Plèiades-1A | KOMPSAT-3 | Plèiades-1B | World-View-3 | KOMPSAT-3A | |
| Nationality/Company | GeoEye (previously Space Imaging), USA | Digital Globe, USA | ISRO, India | CNES, AIRBUS Defence & Space, France | KARI, South Korea | CNES, AIRBUS Defence & Space, France | Digital Globe, USA | KARI, South Korea | |
| Operating time | since 06.09.2008 | since 08.10.2009 | since 12.07.2010 | since 17.12.2011 | since 17.05.2012 | since 02.12.2012 | since 13.08.2014 | since 25.03.2015 | |
| Orbit altitude [km] | 681 | 770 | 637 | 694 | 685 | 694 | 617 | 528 | |
| Spectral bands[um] | PAN | 0.45-0.90 | 0.45-0.80 | 0.45-0.85 | 0.48-0.83 | 0.45-0.90 | 0.48-0.83 | 0.45-0.80 | 0.45-0.90 |
| MS | 0.45-0.52 | 0.40-0.45 | 0.43-0.55 | 0.45-0.52 | 0.43-0.55 | 0.40-0.45 | 0.45-0.52 | ||
| 0.52-0.60 | 0.45-0.52 | 0.49-0.61 | 0.52-0.60 | 0.49-0.61 | 0.45-0.51 | 0.52-0.60 | |||
| 0.63-0.70 | 0.51-0.58 | 0.60-0.72 | 0.63-0.69 | 0.60-0.72 | 0.51-0.58 | 0.63-0.69 | |||
| 0.76-0.90 | 0.59-0.63 | 0.75-0.95 | 0.76-0.90 | 0.75-0.95 | 0.59-0.63 | 0.76-0.90 | |||
| 0.63-0.69 | 0.63-0.69 | ||||||||
| 0.71-0.75 | 0.71-0.75 | ||||||||
| 0.77-0.90 | 0.77-0.90 | ||||||||
| 0.86-1.04 | 0.86-1.04 | ||||||||
| Spatial resolution [m] | PAN | 0.41×0.41 | 0.46×0.461 | 0.8×0.8 | 0.5×0.5 | 0.7×0.7 | 0.5×0.5 | 0.31×0.311 | 0.5×0.5 |
| MS | 1.65×1.65 | 1.84×1.84 | 2×2 | 2.8×2.8 | 2×2 | 1.24×1.24 | 2×2 | ||
| Radiometric resolution [bit] | 11 | 11 | 10 | 12 | 14 | 12 | 11 | 14 | |
| Footprint [km] | 15×15 | 16.4×16.4 | 9.6×9.6 | 20×20 | 15×15 | 20×20 | 13.1×13.1 | 12×12 | |
| Maximum angle of incidence | +/- 60° | +/-45° | +/-45° | +/-45° | +/-45° | +/-45° | +/-45° | +/-45° | |
[i] Source: own elaboration based on: Airbus Defence and Space 2018, Satellite Imaging Corporation 2018, DigitalGlobe 2018, ESA Earth Online 2018.
Table 2
Selected high resolution (HRS) optical satellite data parameters
| Satellite/Sensor | LANDSAT-7/ETM+ | SPOT5 | ALOS/PRISM/AVNIR-2 | SPOT6/7 | LDCM/OLI | Sentinel-2A | Sentinel-2B | |
|---|---|---|---|---|---|---|---|---|
| Nationality/Company | NASA, USA | AIRBUS Defence & Space (previously SpotImage), France | JAXA, Japan | AIRBUS Defence & Space, France | NASA, USA | ESA, European Union | ESA, European Union | |
| Operating time | since 15.04.1999 | 04.05.2002 -31.03.2015 | since 24.01.2006 | since 12.09.2012 | since 11.02.2013 | since 23.06.2015 | since 07.03.2017 | |
| Orbit altitude [km] | 705 | 832 | 692 | 832 | 705 | 786 | 786 | |
| Spectral bands [um] | PAN | 0.52-0.90 | 0.48-0.71 | 0.52-0.77 | 0.455-0.745 | 0.500-0.680 | 0.430-0.457 | 0.420-0.465 |
| MS | 0.45-0.52 | 0.50-0.59 | 0.42-0.50 | 0.455-0.525 | 0.433-0.453 | 0.448-0.546 | 0.443-0.541 | |
| 0.52-0.60 | 0.61-0.68 | 0.52-0.60 | 0.530-0.590 | 0.450-0.515 | 0.538-0.583 | 0.536-0.582 | ||
| 0.63-0.69 | 0.78-0.89 | 0.61-0.69 | 0.625-0.695 | 0.525-0.600 | 0.646-0.684 | 0.646-0.685 | ||
| 0.76-0.90 | 1.58-1.75 | 0.76-0.89 | 0.760-0.890 | 0.630-0.680 | 0.694-0.713 | 0.694-0.714 | ||
| 1.55-1.75 | 0.845-0.885 | 0.731-0.749 | 0.730-0.748 | |||||
| 10.40-12.50 | 1.560-1.660 | 0.769-0.797 | 0.766-0.794 | |||||
| 2.08-2.35 | 2.100-2.300 | 0.763-0.908 | 0.767-0.900 | |||||
| 1.360-1.390 | 0.848-0.881 | 0.848-0.880 | ||||||
| 0.932-0.958 | 0.930-0.957 | |||||||
| 1.336-1.411 | 1.339-1.415 | |||||||
| 1.542-1.685 | 1.540-1.681 | |||||||
| 2.081-2.323 | 2.067-2.305 | |||||||
| Spatial resolution [m] | PAN | 15×15 | 2.5×2.5, 5.0×5.0 | 2.5×2.5 | 1.5×1.5 | 15×15 | 10×10 | 10×10 |
| MS | 30×30 | 10×10 | 10×10 | 6.0×6.0 | 30×30 | 10×10 20×20 60×60 | 10×10 20×20 60×60 | |
| Radiometric resolution [bit] | 8 | 8 | 8 | 12 | 12 | 12 | 12 | |
| Footprint [km] | 185×185 | 60×60 | 70×70 | 60×60 | 185×185 | 290 | 290 | |
| Maximum angle of incidence | 0° | +/- 31° | +/- 27° | 0° | +/-46° | +/-46° | ||
[i] Source: own elaboration based on: Airbus Defence and Space 2018, Satellite Imaging Corporation 2018, ESA Earth Online 2018.
Table 3
Damage identification based on VHRS 0.3 m × 0.3 m pixel optical data
| Type of damage | Damage | Dimensions (approximate) | Spectral ranges | Estimated accuracy of results |
|---|---|---|---|---|
| Damage/loss of ground | Den, cavity, tunnel caused by the activity of burrowing animals | 0.1 - 1 m | VIS, NIR | 0.3 - 0.6 m |
| Surface damage | Traces in the crown of the levees | 0.1 - 0.3 m | VIS, NIR | 0.15 - 0.30 m |
Table 4
Damage identification based on VHRS 0.5 m × 0.5 m optical data
| Type of damage | Damage | Dimensions(approximate) | Spectral ranges | Estimated accuracy of results |
|---|---|---|---|---|
| Surface damage | Wild crossings | 0.3 - 1 m | VIS, NIR | 0.3 - 0.5 m |
| Surface damage | Defects in the body and on the sides of the levees caused by wild and burrowing animals | Unspecified | VIS, NIR | 0.3 - 0.5 m |
| Slope deformation | Local soil runoff | Unspecified | VIS, NIR | 0.3 - 0.5 m |
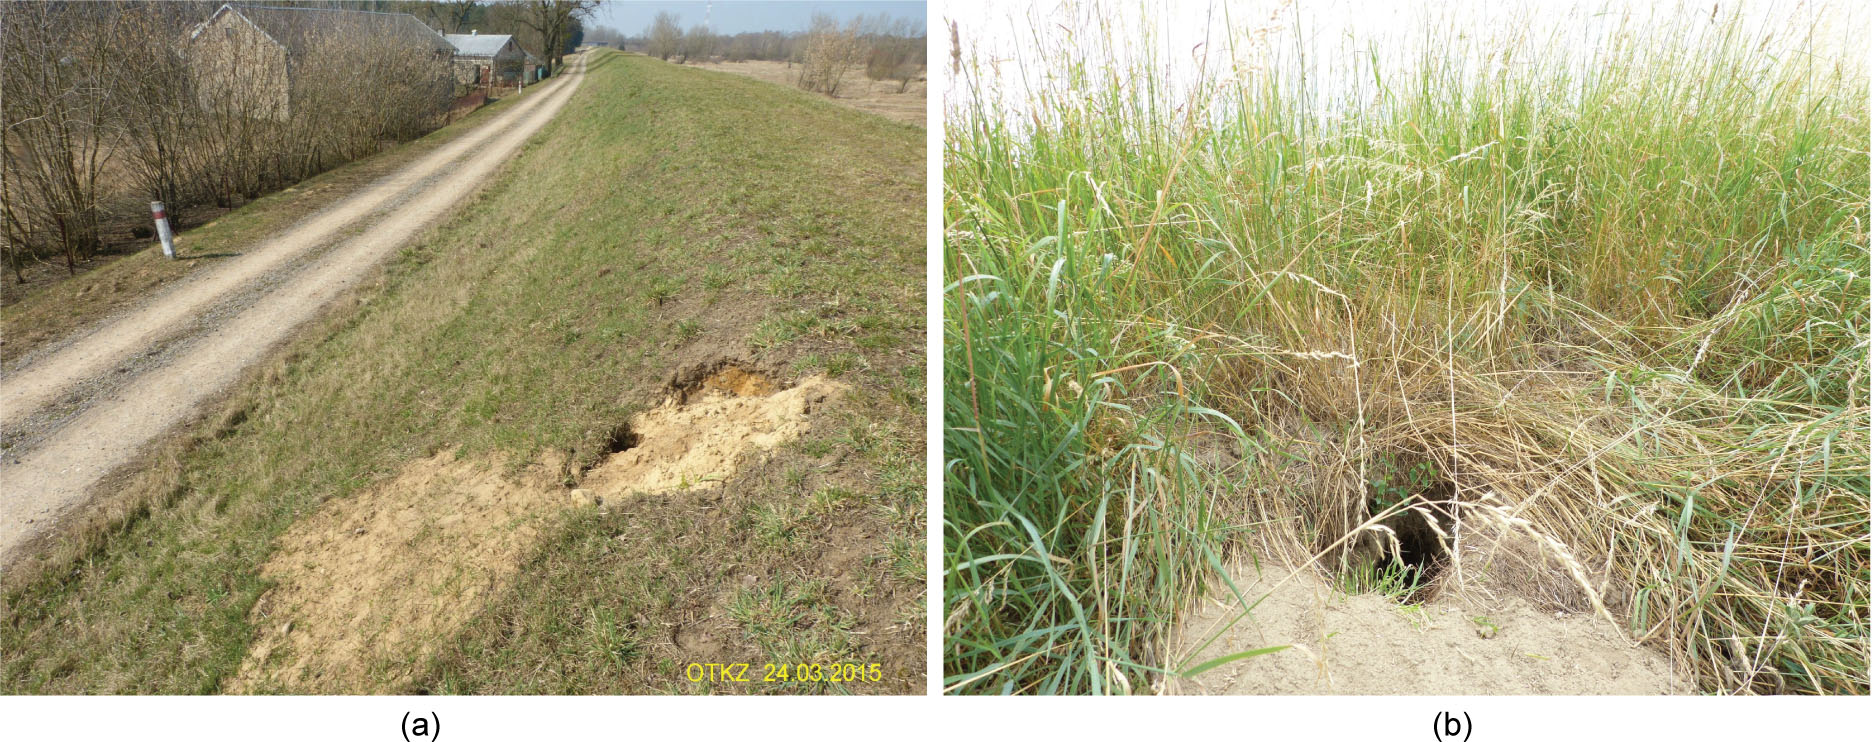
Figure 1
Presents damaged flood banks caused by animals. The holes were caused by the beavers living in the area. Grazing animals on the levees and in their immediate vicinity violates the construction of levees and causes changes in soil mass. Photo by Janusz Orzepowski
Table 5
Damage identification based on HRS 2 m × 2 m optical data
| Type of damage | Damage | Dimensions (approximate) | Spectral ranges | Estimated accuracy of results |
|---|---|---|---|---|
| Surface defects | Theft of part of the infrastructure | 2 - 10 m | VIS, NIR | 1 - 2 m |
| Surface damage | Transhumance within the body of the levee | 2 - 10 m | VIS, NIR | 1 - 2 m |
| Landslides | Possibility of landslide in the section with very low geotechnical parameters | from several to dozens of metres | VIS, NIR | 1 - 2 m |
| Landslides | Undercutting of the base of the levee by the current of the river during floods | from several to dozens of metres | VIS, NIR | 1 - 2 m |
| Cracks in the body | Longitudinal slits | 5 - 15 m | VIS, NIR | 1 - 2 m |
| Blur of the shaft | May occur when the flood wave elevation is greater than the lowest point of the levee crown | Unspecified | NIR | 1 - 2 m |
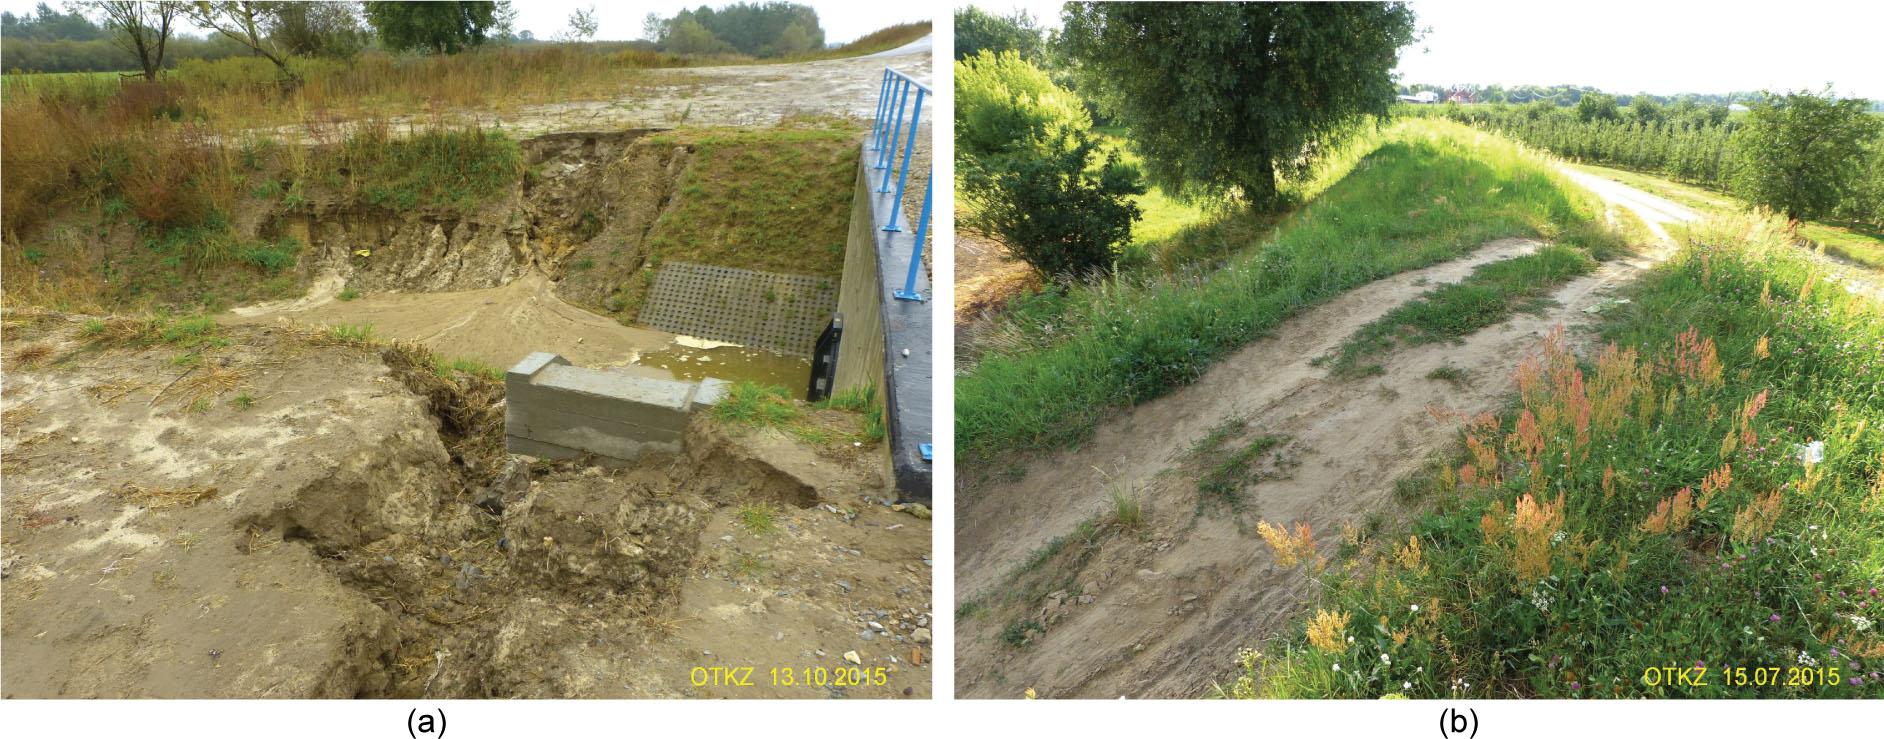
Figure 2
Presents an example of a landslide in Poland in 2015 and levee surface damage caused by people. Photo by Janusz Orzepowski
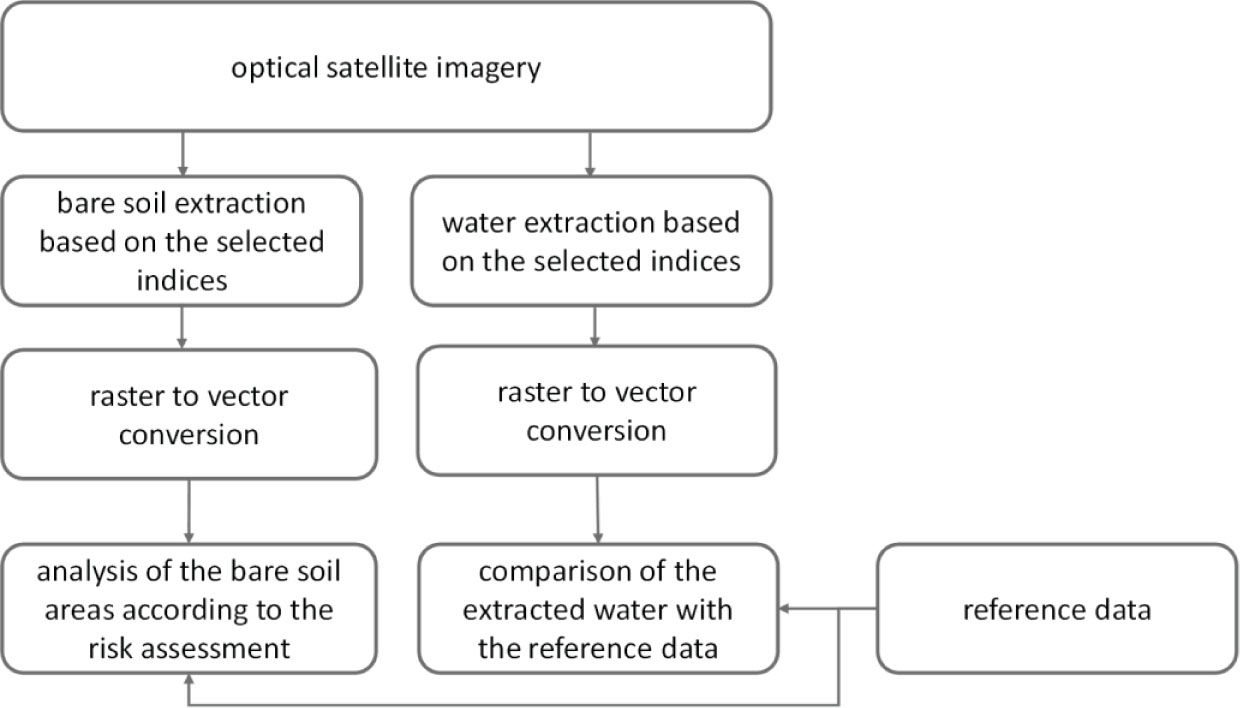
Figure 3
Workflow of optical satellite imagery analysis
Source: Own elaboration
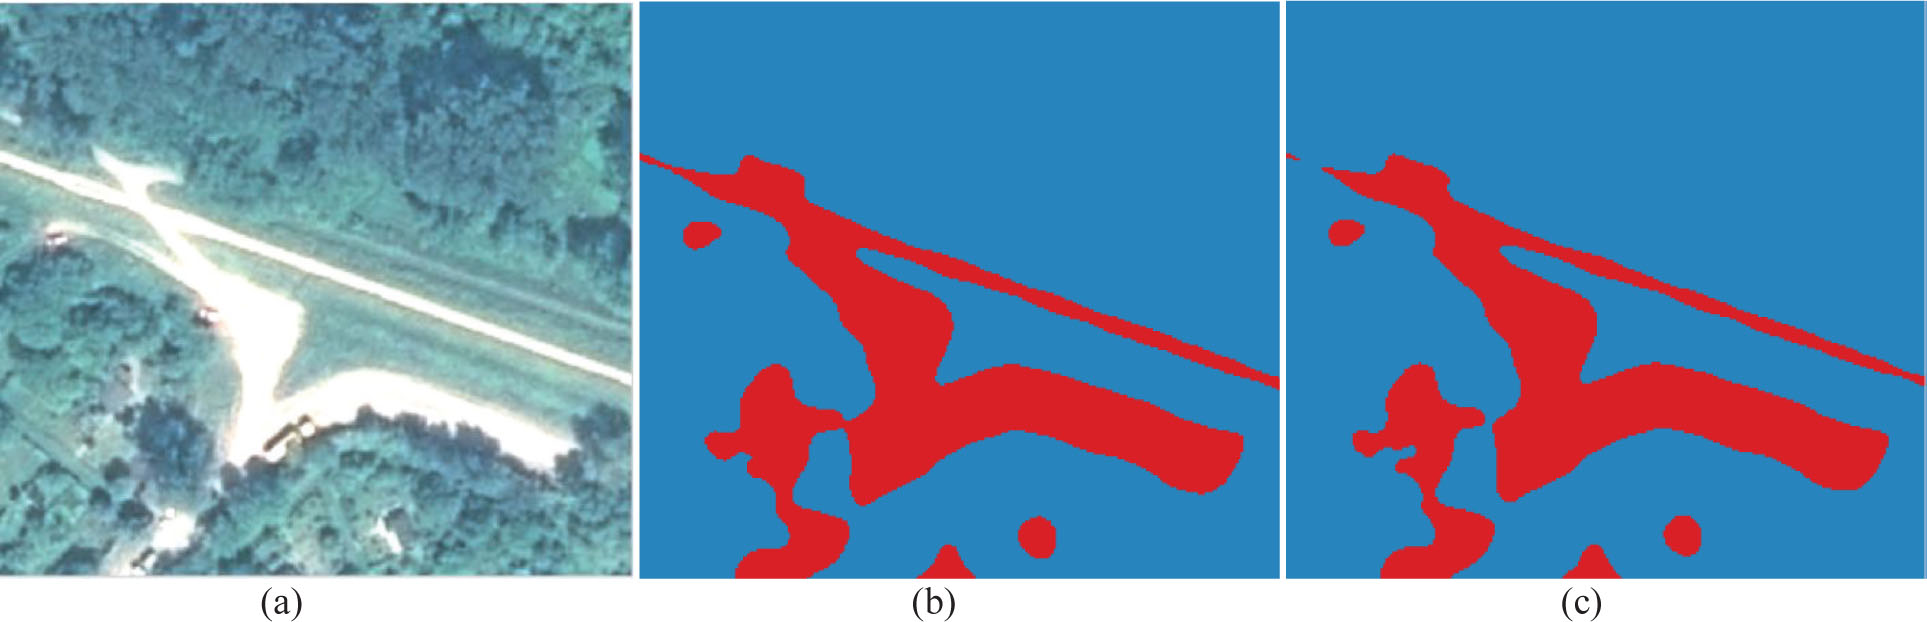
Figure 4
Bare soil detection based on Plèiades data (a) using MSAVI (b) and NDVI (c)
Source: Own elaboration based on Pleiades data
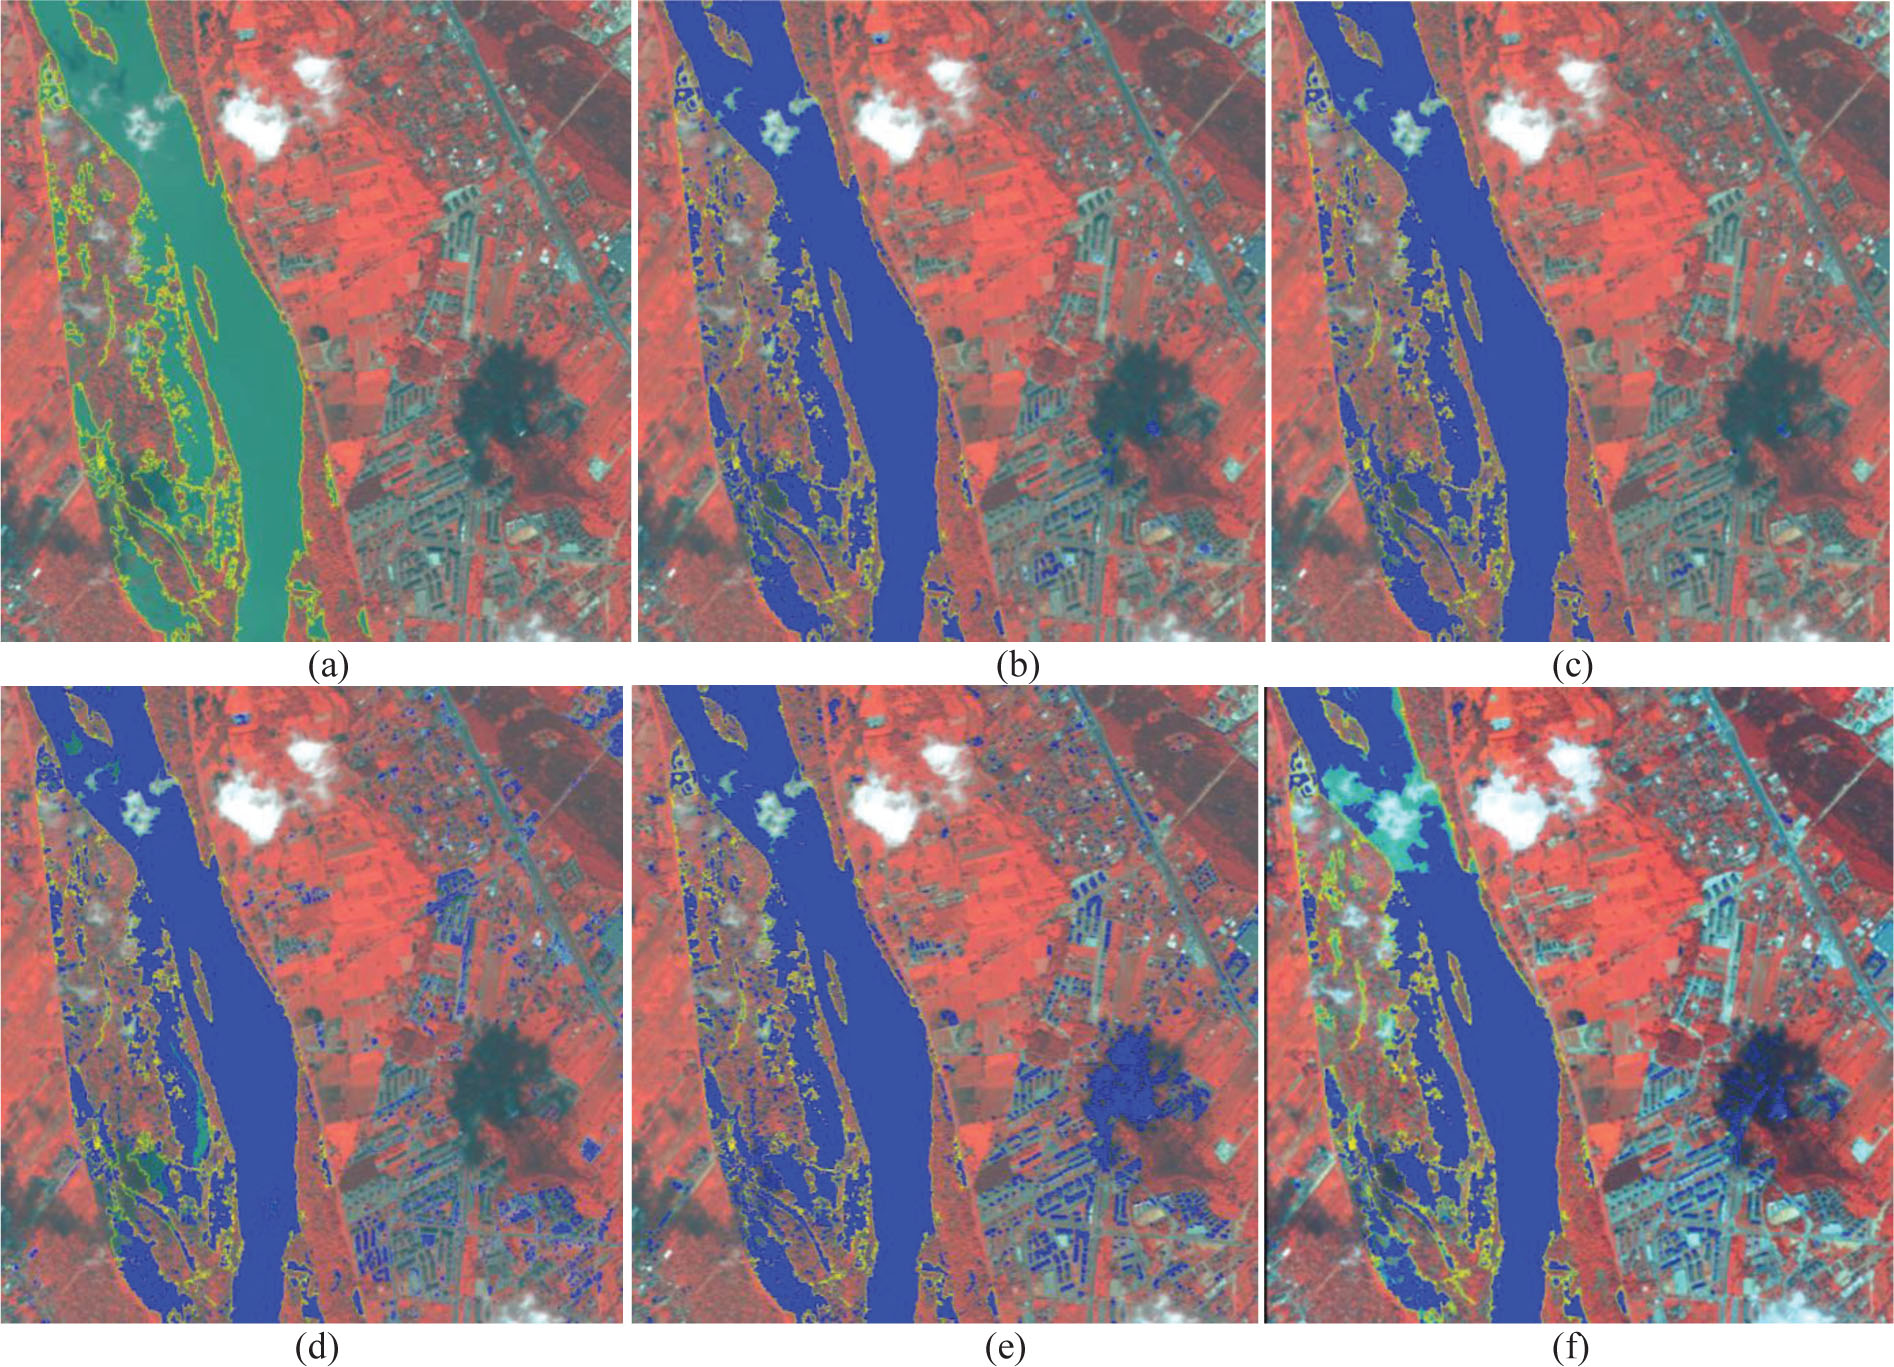
Figure 5
Detection of water bodies based on WorldView-2 (a) data using NDVI (b), SAVI (c), SARVI (d), WV-WI (e) and NDWI (f) - results comparison with reference data (a)
Source: Own elaboration based on WorldView-2 data
Table 6
Assessment of the accuracy of determining the range of water bodies on the basis of index images obtained from WorldView-2 data (partly cloudy)
| Index | Threshold values | Correctly detected water | Error of omission | Error of commission |
|---|---|---|---|---|
| DVI | <-30 | 71.61% | 28.39% | 2.93% |
| NDVI | <-0.14 | 94.76% | 5.24% | 10.04% |
| NDVI | <-0.15 | 94.40% | 5.60% | 7.54% |
| NDVI | <-0.16 | 93.99% | 6.01% | 5.68% |
| NDVI | <-0.22 | 89.73% | 10.27% | 1.40% |
| NDWI | >0.32 | 78.57% | 21.43% | 6.24% |
| SAVI | <-0.20 | 94.96% | 5.04% | 12.01% |
| SAVI | <-0.25 | 93.66% | 6.43% | 4.71% |
| SAVI | <-0.27 | 92.97% | 7.03% | 3.49% |
| OSAVI | <-0.25 | 90.22% | 9.78% | 1.56% |
| SARVI | <-0.4, 0.0> | 88.48% | 11.52% | 15.01% |
| ARVI | <-0.1 | 85.06% | 4.37% | 14.94% |
| WV-WI | -0.5 | 93.36% | 6.64% | 19.88% |
| WV-WII | <29 | 91.26% | 8.74% | 16.49% |
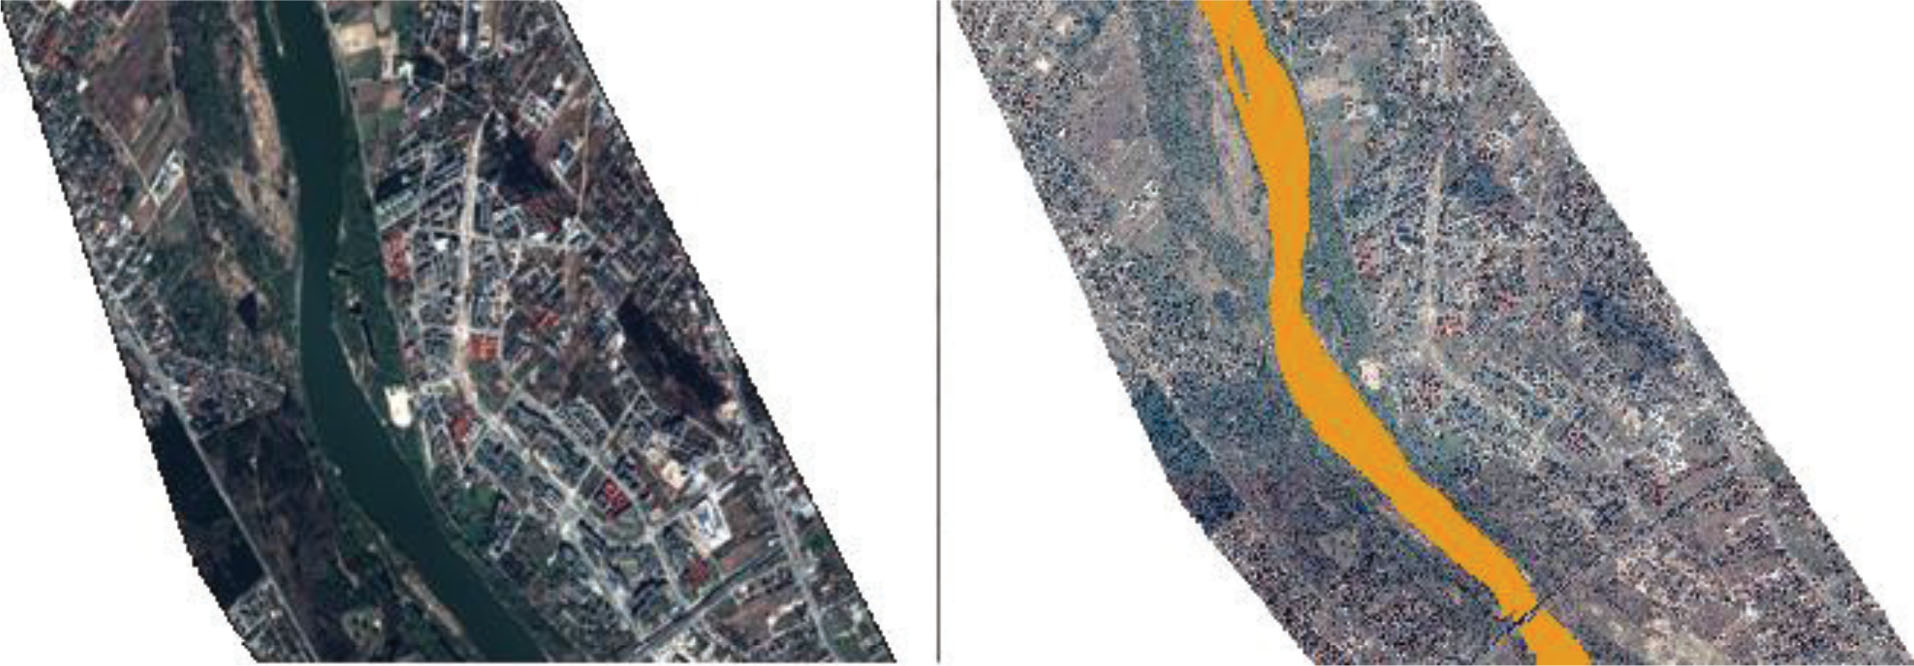
Figure 6
Detection of water bodies based on Plèiades data using NDVI
Source: Own elaboration based on Pleiades dat