
Introduction
As Generation Z increasingly relies on social media as a primary information source, higher education institutions (HEIs) are compelled to adapt their communication strategies. Effectively engaging students in this digital landscape is both challenging and critical, especially in an era characterized by intense competition among universities. Delivering quality education no longer guarantees for institutional success; universities must foster visibility among prospective students. In response to this paradigm shift, institutions increasingly leverage social media to showcase academic offerings and connect with younger demographics. The critical inquiry, therefore, has shifted from whether universities use social media to how they optimize format, content, frequency, and efficacy.
This study analyses the Facebook and Instagram communication strategies of Hungarian-language programmes at Babeş‒Bolyai University. The primary objectives are to identify prevalent content formats, assess communication effectiveness, and highlight strategic differences between the two platforms. The analysis encompasses the content and performance metrics of 872 posts from 50 social media accounts across Facebook and Instagram. Findings aim to refine higher education social media practices, enabling specific programmes to enhance student orientation and engagement through targeted online outreach. Additionally, the study’s coding scheme offers a methodological framework for future content analyses in the field.
Literature review
Marketing and branding in Higher Education
The scope of marketing and branding has expanded considerably in recent decades. It is now widely acknowledged that these concepts are equally applicable to the context of HEIs as well. Within this framework, HEI marketing can be understood as a strategic tool through which an institution actively communicates its mission, values, and offerings to its various target audiences.1 However, it is important to highlight that traditional commercial marketing logic does not fully apply in this context. Instead, HEI marketing represents a distinctive blend of service marketing, nonprofit marketing, and relationship marketing.2 A common trait among these paradigms is that they depart from profit-maximizing frameworks, striving instead for consumer-centricity, and they define the essence of marketing through the exchange of knowledge and processes, rather than the exchange of material goods.
Alongside marketing, the concept of branding has gained increasing prominence across various industries since the turn of the millennium, and is often regarded as the culmination of marketing activities.3 The literature offers a range of definitions of university branding, each emphasizing different dimensions of the concept. For example, Bennett and Ali-Choudhury4 argue that a university brand is expressed through those attributes that make an institution distinctive, align with student needs, strengthen trust, and support prospective students in making well-informed decisions. Wæraas and Solbakk5 place organizational identity at the core of HEI branding. From this perspective, branding is understood as a long-term process that highlights the institution’s unique characteristics, and requires the clear and consistent articulation of its mission, as well as a persuasive communication of what the university represents, and why it is appealing to its target audience. Similarly, Bulotaite emphasizes that the primary function of HEI branding is to build and manage the impressions that form in consumers’ minds upon hearing a university’s name.6 The author also stresses that in order for a university to evoke strong emotions, a well-defined organizational identity is needed above all. Ultimately, HEI branding requires developing a consistent, trustworthy, and unique institutional identity that resonates with students needs and fosters long-term emotional engagement.
Successful university branding is a complex process shaped by multifaceted strategic and environmental variables. Based on the literature review, such factors may include the definition of a clear vision, which assists universities in positioning themselves; adequate internal and external support,7 particularly the presence of leadership support, as without it, branding efforts are likely to fail; the building and nurturing of media and public relations, as this forms the foundation for establishing trust; and geographic location as well.8 This latter refers to the synergy between a strong university and a city brand. Consequently, identifying and leveraging these environmental and strategic elements remains essential for a sustained branding efficacy.
The role of social media in Higher Education
Moreover, branding success inherently depends on the effective transmission of institutional values to target audiences. This communication act is crucial when speaking about building authentic brands.9 Although traditional marketing frameworks categorized these efforts into advertising, direct marketing, sales promotion, personal selling, and public relations;10 digital channels – such as websites, newsletters, mobile applications, or social media platforms – have become the primary focal points of contemporary marketing and branding initiatives. The rapid expansion of social media has fundamentally changed the marketing and communication paradigms of HEIs. Contemporary platforms, including Facebook, LinkedIn, and Instagram, now serve as central digital mediums, enabling universities to articulate their core values, construct their brand identity, facilitate stakeholder engagement, and influence the decisions of prospective students.11 Social media also provides an opportunity for universities to establish identity cues through which students can develop a sense of belonging and feel connected.12 Furthermore, social media platforms represent a cost-effective communication tool for universities, facilitating direct engagement with both current and prospective students.13
Prior empirical studies indicate that the systematic application of social media marketing positively influences brand awareness, brand credibility, recruitment efficiency, and, ultimately, institutional brand equity.14 On the other hand, these platforms have introduced not only opportunities, but also challenges regarding university communication. Notable among these are maintaining the authenticity of content, managing negative feedback, ensuring consistent message delivery across platforms, and developing a coherent digital marketing communication strategy.15 The current study focuses on two specific social media platforms. The first one is Facebook; established in 2004, it has since evolved into the social networking site with the largest global user base. The second one is Instagram, which was introduced later in 2010, and currently it is also one of the few global social platforms with more than three billion monthly active users.16
The international literature offers numerous relevant studies that serve as a foundation for the current research. For instance, Bélanger and his colleagues examined the Facebook and Twitter communication of Canadian universities in 2012. Their investigation revealed significant variations in communication intensity on the platform; during the analysed period, some institutions published fewer than 10 posts, whereas others generated well over 200. Furthermore, content analysis demonstrated that while community-building and interactive posts were the most popular, institutions primarily utilized the platform for one-way communication.17 Another study analysed the Facebook pages of American universities, focusing primarily on key social media metrics such as post format, posting frequency, and engagement rates.18 The findings indicated that photo sharing was the most frequently utilized format, accounting for 56% of all posts within the analysed sample. Furthermore, it was not only the most prevalent format, but also the one that generated the highest level of engagement among followers. This study also highlighted some differences between the type of higher education institution and the applied social media communication strategies. For instance, liberal arts colleges received more engagement than public and private universities, despite posting less frequently. This is also supported in the work of Lund,19 who stated that quality beats quantity, when universities are trying to engage students on social media. Peruta and Shields20 also highlighted that there are content categories that increase engagement and others that lower engagement when used by universities. For example, athletics, school spirit, and promotions were content types that increased, while campus events, academic events, or research related content had the opposite effect and lowered the overall engagement of followers.
Expanding the geographical scope, Taecharungroj21 conducted a cross-national content analysis examining the Facebook communication of universities in the United States and Thailand. Based on a sample of six institutions and over 1000 Facebook posts, the study identified 12 distinct content categories: research, faculty, curriculum, campus, students, alumni, industry, events, products, image and reputation, announcements, and others. The findings highlighted significant cross-cultural differences in content strategy as universities from the USA prioritized research-focused communication, whereas Thai institutions utilized the platform primarily to communicate about events and institutional announcements. In another research with a global focus, Maresova and her colleagues22 analysed the social media communication strategies of the world’s top ten universities, based on the QS World University Rankings. Consistent with prior research, their findings confirmed that posts containing visual format (photos) generated the highest level of engagement; however, this study also highlighted the growing importance of video formats. The top-performing posts were those showcasing successful institutional research, technological innovations, or stories featuring prominent figures. Furthermore, despite using a multi-platform approach, incorporating Instagram, Twitter, and Youtube, these universities consistently reach the highest user base via Facebook. The study carried out by Bonilla Quijada and her colleagues23 similarly examined the top performing global universities, but the content analysis focused on another social media platform, namely Instagram. The findings of the study indicated that consumer engagement can be diverse and contradictory, even among these prominent global actors, meaning that strategies that may work for some universities are not effective for others. For example, university achievements or CSR related posts do not necessarily generate the expected attention and reaction, while photos of the university campus or the city where the university is located, usually encourage better consumer engagement. Based on our literature review, only a few prior studies examined the role of social media communication among universities from Central and Eastern Europe. As a notable exception, Eger and his colleagues24 analysed the Facebook communication of top universities from Czechia, Slovakia, Poland, and Hungary. Their findings highlight once again the role of visual posts in achieving better user engagement. Also, this study suggests that there is a strong correlation between the number of students and the number of followers on Facebook pages.
Methodology
The current study addresses this gap in the literature by examining the social media communication of Hungarian-language programmes at Babeş‒Bolyai University, consistently the top ranked Romanian HEI in relevant global university rankings. In contrast to prior research, the current study adopts an intra-institutional comparative approach, analysing the social media strategies of different faculties within the same university. Furthermore, this comparative approach extends to the social media platforms as well. The study examined both Facebook and Instagram, acknowledging their status as leading social media channels, not only on global scale, but within the Romanian digital landscape as well. According to the latest country-specific report from DataReportal, there are 12.9 million active social media users in Romania, representing 68.3% of the national population. Within this digitally active demographic, 10.3 million people are active on Facebook, while 6 million are active users of Instagram.25
In terms of methodology, a qualitative content analysis was conducted in order to examine the social media communication of the selected faculties. The sample consisted of the Hungarian-language programmes within the at Babeş- Bolyai University. During data collection, a total of 50 social media accounts were analysed, encompassing 29 Facebook pages and 21 Instagram profiles. Data were collected manually, covering all posts published by these institutions over a fourmonth period from December 2024 to March 2025. As a result, a total number of 872 posts were collected, 658 from Facebook pages, and 214 from Instagram pages. These data indicate that the examined faculties continue to prioritize Facebook as their primary digital communication platform. The collected post-level data included: post creation date, post text, post format, number of likes, number of comments, number of shares, and content type.
A mixed-approach, both inductive and deductive, was used in order to define the type of content these faculties were using in their social media communication. A total number of 12 content types were identified: 1) administrative information, 2) academic opportunities, 3) faculty events, 4) student achievements, 5) institutional identity, 6) student projects, 7) faculty and staff recognition, 8) industry and academic trends, 9) human side of faculties, 10) infotainment, 11) career and job opportunities, and 12) career paths and perspectives. The following table provides a detailed description of each category. During the coding period, each post was associated with one dominant category.
| Content Category | Description |
|---|---|
| 1. Administrative information | Posts concerning the operational and administrative aspects of the faculty, such as course schedules, office hours, or exam dates. |
| 2. Academic opportunities | Announcements about events, scholarships, grant applications, or mobility programmes, like Erasmus programmes for students. |
| 3. Faculty events | Posts abouts online or offline events organized by the faculties, including guest lectures, conferences, or other extracurricular activities. |
| 4. Student achievements | Posts highlighting student achievements, including results from national or international competitions, awards, conference presentations. |
| 5. Institutional identity | Posts that illustrate the core values, persona, and positioning of a faculty, including professional standpoints, community ethos, or visual branding. |
| 6. Student projects/portfolios | Posts featuring students’ academic projects, showcasing both the creative process and the final output as well. |
| 7. Faculty and staff recognition | Posts acknowledging the professional recognition and contribution of faculty members, including professors, PhD candidates, guest lecturers. |
| 8. Industry and academic trends | Content focusing on the current trends within the industry or academic field relevant for the faculty, like media appearances. |
| 9. Human side of faculties | Posts designed to showcase the approachable, playful side of the institutions, like holiday greetings, viral trends, or academic memes. |
| 10. Infotainment posts | Content that blends information with entertainment. The focus is on presenting captivating facts in an enjoyable manner. |
| 11. Career and job opportunities | Posts that highlight job and internship opportunities, typically from corporate partners |
| 12. Career paths and perspectives | Posts presenting career paths of faculty members, or alumni students, serving as an inspiration source for current and future students. |
Results
The first research question (RQ1) of the current study examined which faculties are capable of reaching the largest audience on their social media platforms, and what differences exist between the two major platforms, namely their Facebook and Instagram pages. Figure 1 summarizes the university programmes with the highest number of Facebook followers.
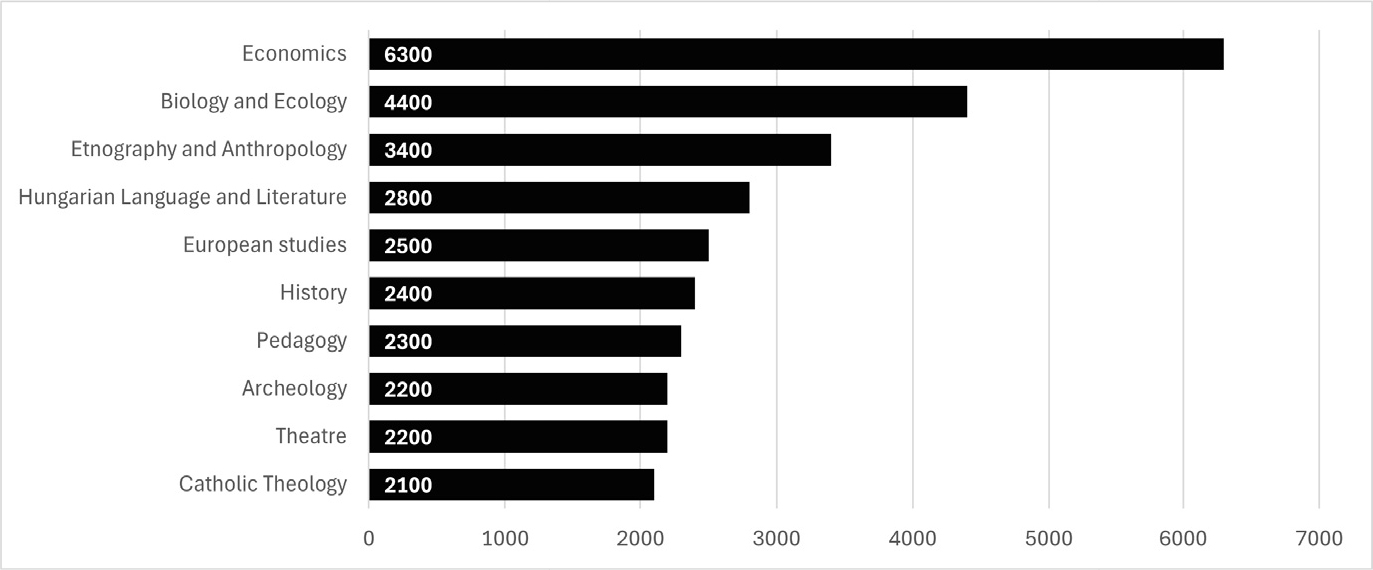
Figure 1:
Leading faculties based on their Facebook followers
The cumulative follower count across the examined Facebook profiles totals 51382, while the average number of followers per Facebook page is 1771. Among the best performing faculties three names emerge, the Economics, the Biology and Ecology, and the Ethnography and Anthropology programmes.
Figure 2 also presents the follower count, but this time focusing on Instagram profiles. The data indicates that the examined faculties reach substantially smaller audiences on this platform compared to Facebook. The total number of followers on Instagram profiles is 11044, representing an average of 525 followers per account. In contrast, Facebook pages have a three times larger following rate. Consistent with the Facebook rankings, the Economics faculty occupies the first position on Instagram, followed by Archaeology, and Communication.
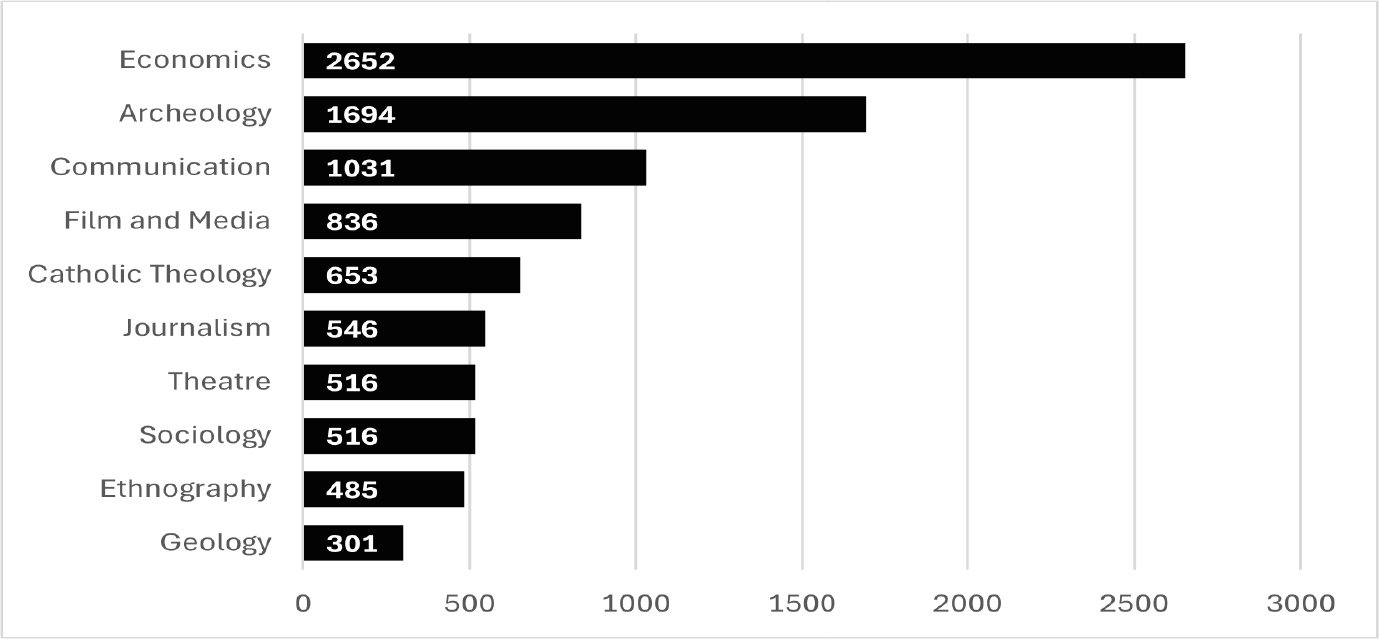
Figure 2:
Leading faculties based on their Instagram followers
The second research question (RQ2) investigated the posting frequency of these programmes across the two social media platforms. In line with findings from previous studies,26 our research also identified substantial variations in the levels of social media activity. While some faculties published merely one or two posts throughout the entire four-month period, others maintained a highly active presence, posting up to three or four times per week. Figure 3 illustrates the daily posting rate for Facebook, as a relevant social media metric for communication intensity.
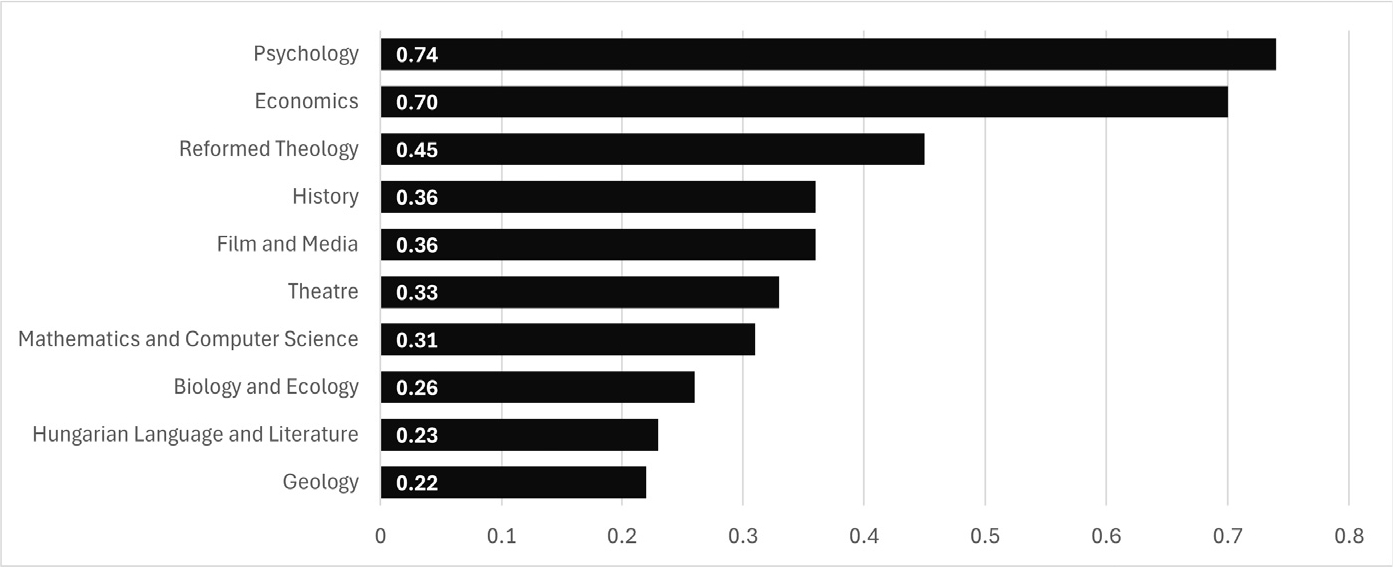
Figure 3:
Leading faculties based on average number of posts per day on Facebook
On Facebook, the Psychology, Economics, and Reformed Theology programmes exhibit the most intensive communication strategies. Overall, however, the data reveals that a daily posting frequency is not characteristic to any of the examined faculties. This is reflected in the average number of daily posts, at only 0.18. Similar patterns emerge when looking at the institutional Instagram profiles. Figure 4 provides an overview of how the evaluated faculties perform regarding their overall communication intensity on this platform as well.
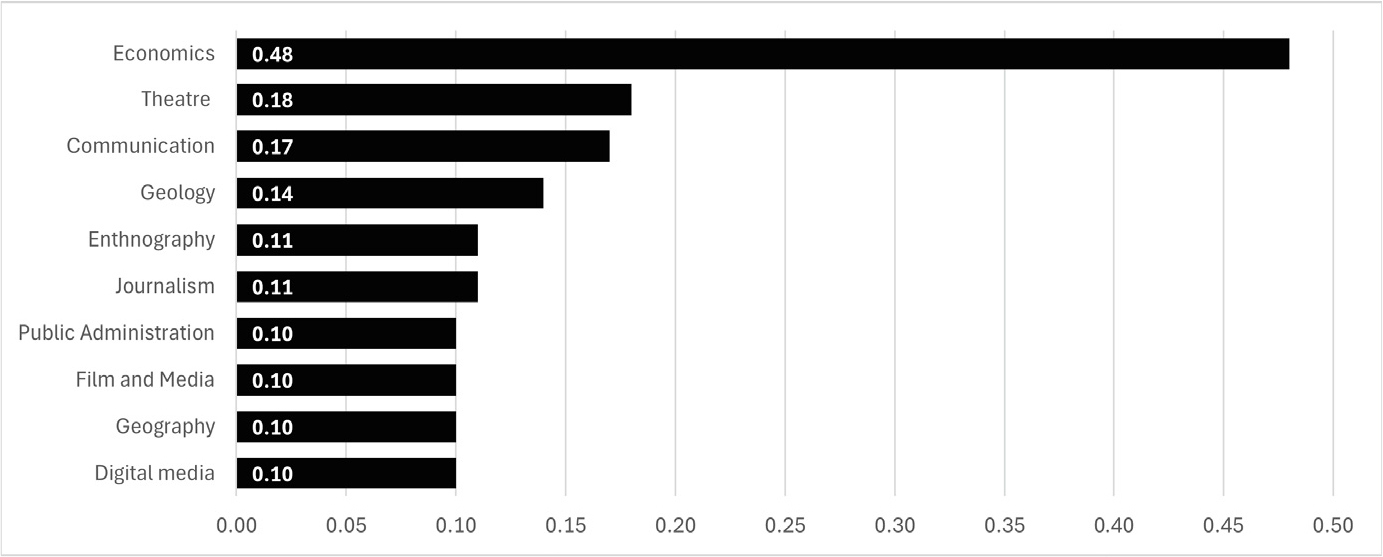
Figure 4:
Leading faculties based on average number of posts per day on Instagram
Within the Instagram dataset, the Economics faculty emerges as a clear frontrunner. By publishing new content every other day, this faculty maintains a more intensive communication strategy compared to all other faculties in the sample. The Theatre and Communication programmes occupy the second and third positions, respectively. It should be noted, that the Communication programme excels in both the follower count and posting intensity on Instagram, yet it fails to rank among the leaders on Facebook. This suggests that certain faculties and university programmes are consciously allocating more focus to the platforms where their core youth demographic is more active.
Another research question (RQ3) examined the format used on these social media platforms. Based on the data, we can conclude that the majority of Facebook posts consist of either a single image (39.5%) or a photo gallery (22.9%). Hyperlinks are the third most used category, accounting for 17.6% of the total posts, whereas events, videos, and text-only posts represent the minority of the corpus. Meanwhile, on Instagram, single-image posts dominate the platform, comprising 50% of all content, followed by carousel posts (35%), and videos (14%). These results highlight a clear strategic gap, indicating the underutilization of video formats in the social media communication strategies of the examined faculties.
The main focus of the current research (RQ4) was related to the content categories published by the examined institutions on Facebook and Instagram. Figure 5 presents the most popular content categories across the Facebook dataset. Approximately 40% of the total Facebook corpus is dedicated to Academic Opportunities, which includes announcements for events, grants, and mobility initiatives among others. This is followed by Faculty Events (16.5%) and Faculty and Staff Recognition (8.2%) categories. Similar patterns can be found on Instagram pages as well, illustrated on the next figure (Figure 6). Academic Opportunities (30.8%) is the most popular topic category on this social platform as well, followed by Faculty Events (24.7%), and the presentation of the Human side of Faculties (16.8%).
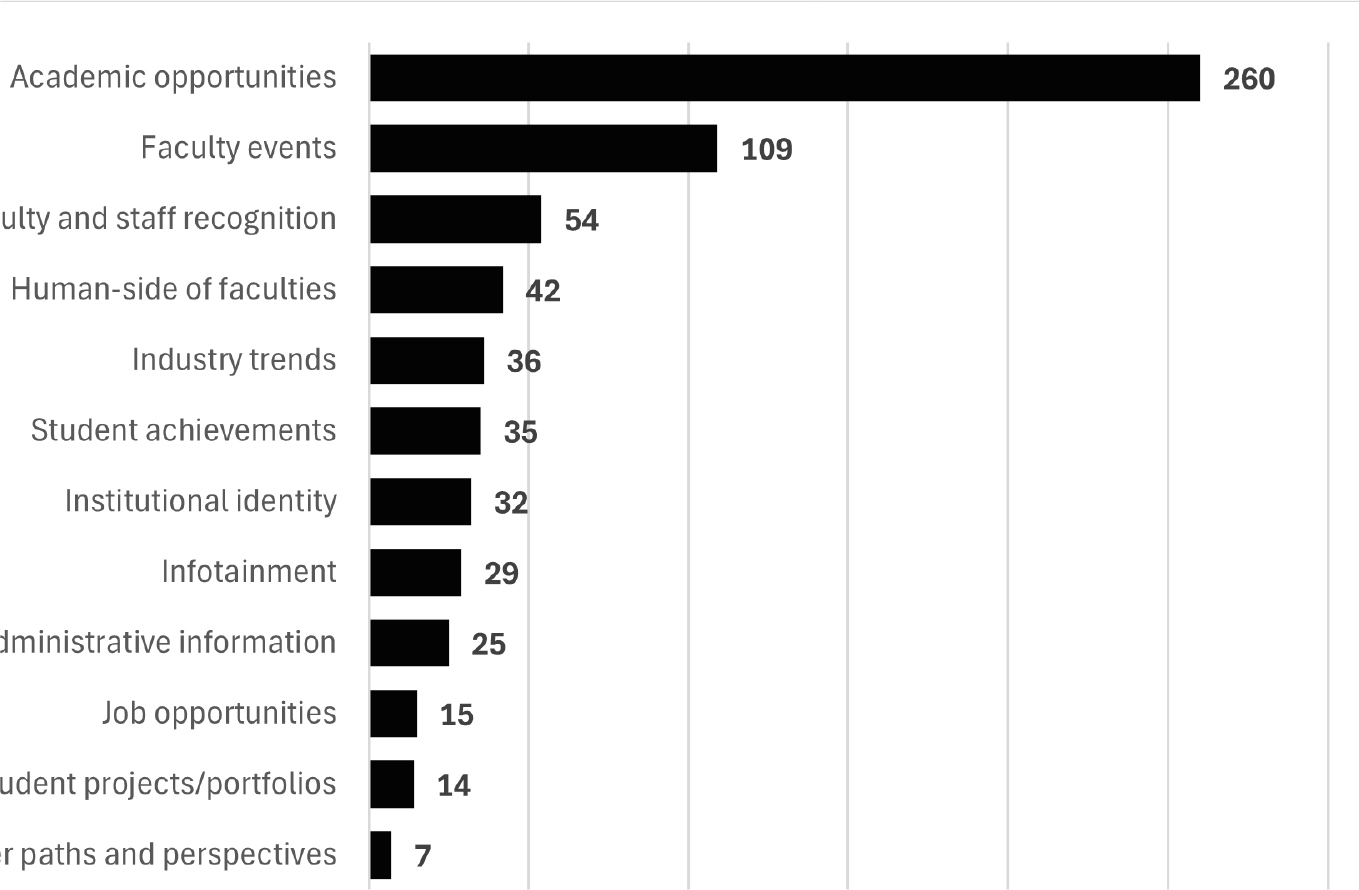
Figure 5:
The most popular content categories on Facebook
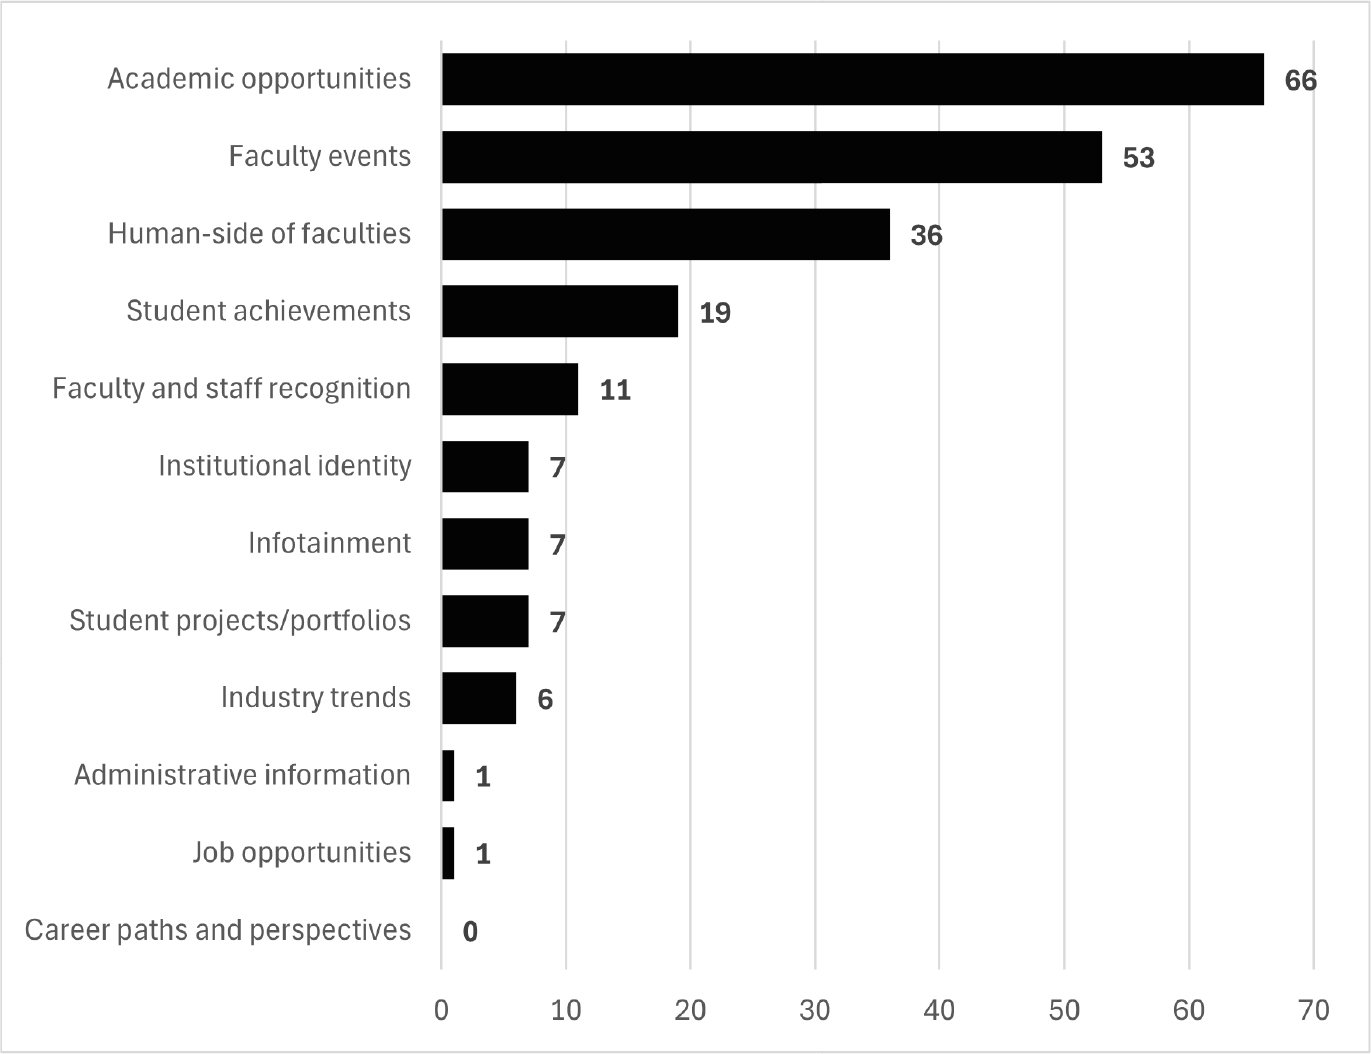
Figure 6:
The most popular content categories on Instagram
Despite the fact that there are clear similarities between the two datasets, certain key distinctions should be highlighted. For example, the Faculty and Staff Recognition category is more popular on Facebook (8.2%), compared to Instagram (5.1%), while the Student achievements category follows an opposite trend, with larger shares on Instagram (8.9%), compared to Facebook (5.3%). This divergence may be attributed to the distinct demographic profiles of the platforms’ user bases. Older generations presumably exhibit greater interest in faculty staff related updates, whereas the younger demographic on Instagram is more engaged with the accomplishments of their peers.
Similarly, there is also a contrast between the presentation of the human side of faculties on the examined social media platforms. This category accounted for 16.8% of the Instagram posts, compared to just 6.4% on Facebook. The findings suggests that community-oriented posts, with a more personal tone are predominantly concentrated on Instagram, while faculties follow a more professional and formal tone in their communication strategies on Facebook. This conclusion is also supported by the distribution of topic categories such as Administrative Information and Career and Job Opportunities, which appear almost exclusively on Facebook.
The final research question (RQ5) examined which content formats and topic categories perform better across the analysed social media platforms. To measure this, the engagement rate was utilized as the primary metric. Consistent with the methodology of prior studies,27 this metric was calculated by aggregating the total number of reactions, comments, and shares on posts, and dividing that sum by the total number of followers. This approach provides a weighted measure that reflects the level of engagement these faculties generate relative to their specific audience size.
Figure 7 summarizes the engagement rates of the formats used on Facebook pages. The results indicate that posts featuring multiple images represent the most effective content type in terms of user interaction. With a value of 2.28%, the engagement rate for this format stands out from all other formats. The engagement rates generated by all other formats, including text, single photo, video, links, and events posts, remain below 1%, while the average engagement rate for all formats on Facebook is 0.93%.
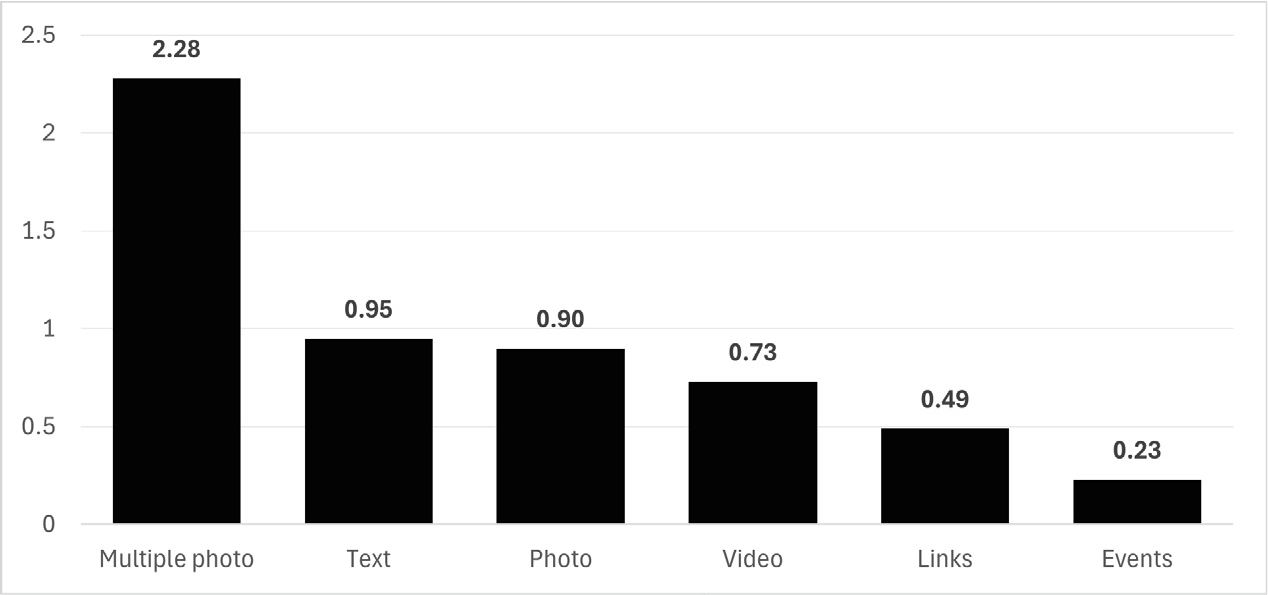
Figure 7:
The average engagement rate of post formats on Facebook pages
In comparison to the six possible content formats utilized on Facebook pages, the Instagram dataset contains only three dominant formats, illustrated on Figure 8. Based on this figure, we can conclude that posts with multiple photos, usually referred as carousel posts, perform the best on Instagram with an engagement rate of nearly 10%. The average engagement rate for all formats on Instagram was 7.76%, a figure that is significantly higher than the same metric on Facebook pages. This suggests that the faculties are more successful at engaging and mobilizing their own audience on Instagram.
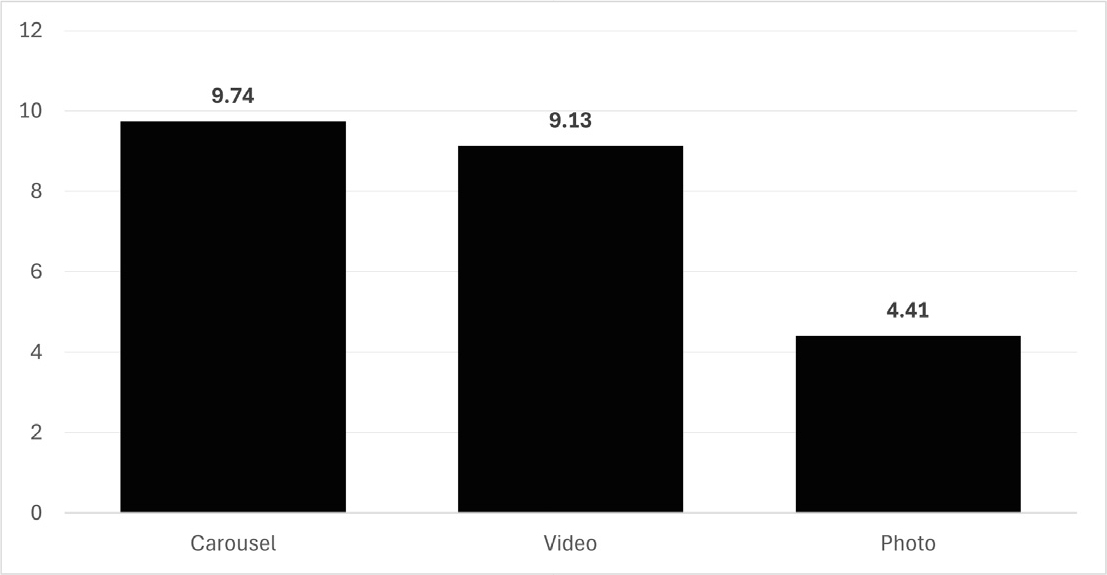
Figure 8:
The average engagement rate of post formats on Instagram pages
In addition to the format type, it was also worth examining which content categories generate the highest levels of interaction. Figure 9 summarizes these findings for the Facebook dataset. The findings indicate that posts categorized as Faculty and staff recognition perform the best (2.65%), followed by Faculty events (2.21%), and the presentation of Career paths and perspectives (1.80%). The lowest engagement rates were generated by content categories like Administrative Information (0.20%) and Job opportunities (0.19%). In contrast, on Instagram – as shown in Figure 10 –, the top-performing content categories include posts showcasing Student projects (12.4%), Faculty events (9.6%), and posts highlighting the Human side of the university programmes (9.3%). On the other hand, the lowest levels of interactions were generated by posts regarding Industry trends (2%) and Administrative information (1.7%).
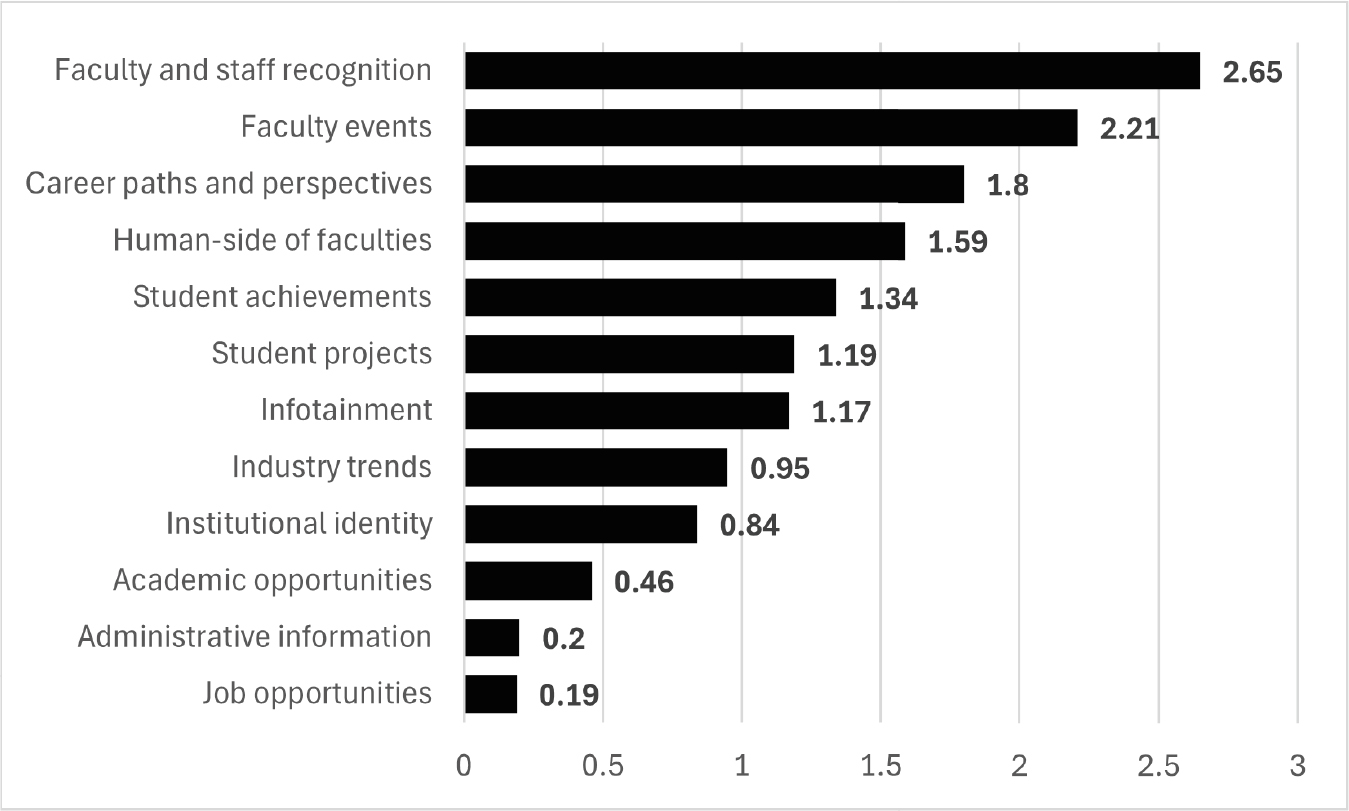
Figure 9:
The average engagement rate of content categories on Facebook
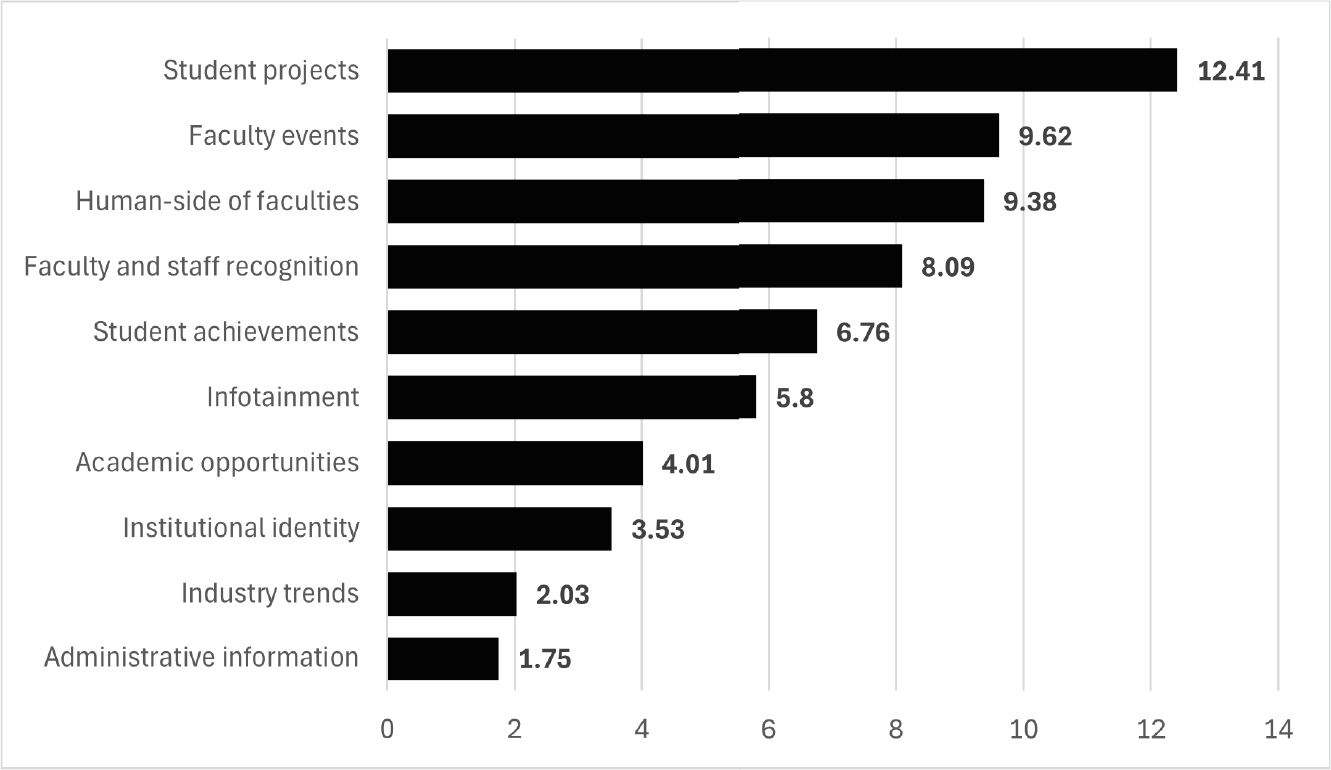
Figure 10:
The average engagement rate of content categories on Instagram
In addition to engagement rates, we examined other factors as well. For Facebook pages, one such factor was virality, measured based on the number of shares. Our data revealed that infotainment-style posts, student recognitions, and the presentation of student projects received the most shares. In terms of conversational potential, measured by the number of comments, posts highlighting the success of staff members and students generated the most comments. The likability of content was measured based on the number of reactions revealed a similar pattern. In the case of Instagram pages, we were unable to examine virality, but we could assess the conversational potential and the likability of different content categories. Based on the results, we can conclude that showcasing student projects is the type of content that generates the most comments, while posts highlighting student achievements and the human side of the faculties ranked highest in terms of reactions.
Conclusion and implications
This research paper proposed to investigate the social media communication strategies of Hungarian-language programmes at Babeş‒Bolyai University, with a specific focus on Facebook and Instagram. By analysing a total of 872 social media posts across 50 different accounts over a four-month period, our research provides a detailed and comparative picture of how academic faculties leverage digital channels in order to reach their target audiences. Our approach is distinct from the more common inter-institutional comparisons found in the existing literature,28 because it focuses on different faculties competing with each other under the umbrella of the same university brand. In this regard, the current analysis allows for a more nuanced examination of how faculty-level characteristics shape the social media communication strategies.
The findings highlight that Facebook remains the dominant communication channel for the examined faculties, both in terms of follower reach and posting frequency. However, the substantially higher average engagement rates observed on Instagram posts suggest that faculties that are able to maintain an active presence on Instagram are rewarded with more responsive and interactive audiences.
Based on the findings, we can also note that there are significant variations in communication intensity across faculties, and the majority of the programmes follow an ad-hoc content management strategy, with an average post per day below 0.20 value. In terms of content format, single-image posts dominate on both platforms, while video content remains underutilized, despite its demonstrated potential for higher engagement rates. These findings highlight a strategic gap in the content strategies of the examined faculties, mainly due to the algorithmic advantages that short-form video (SFV) formats currently enjoy on both social platforms. It should also be noted here that the multi-image formats, like the gallery on Facebook and carousel on Instagram, consistently outperforms all other formats in terms of engagement.
Additionally, regarding the content categories, we can point out that Academic opportunities is the dominant content category on both platforms, followed by the presentation of Faculty events. The overrepresentation of these categories comes at the expense of higher-engagement categories such as Student achievements, Faculty and staff recognition, or highlighting the Human side of these academic programmes. Our findings clearly demonstrate that content centred around people, including students, alumni, and faculty members, consistently generates higher interactions than administrative or event-focused announcements. This finding serves as an important practical implication for the current study. Communication managers and faculty administrators should invest in producing more human-centred content in order to gain more visibility and generate higher interaction on their social media platforms. At the same time, faculties should invest more resources in producing video content as well, as this format remains largely underutilized both on Facebook and Instagram. Finally, faculties should develop platform-specific content strategies, rather than using the same content across channels. Facebook can still serve as the primary channel for formal institutional communication, while Instagram should be viewed as space for community building, and visual storytelling, where faculties can really highlight their brand personalities.
Limitation and future directions
Several limitations of the present study should be acknowledged in order to appropriately contextualize its findings. First, the study focuses exclusively on Hungarian-language programmes at a single Romanian university. Future research should address this issue, and replicate this comparative framework across multiple institutions, and language programmes. Second, the study covers a fourmonth period between December and March. Future studies should cover a full academic year, in order to provide a more accurate and reliable baseline for social media communication patterns. Third, the research used only publicly available post-level metrics, and did not include internal platform analytics such as reach, impression, or views. In this sense, future studies should seek to collaborate directly with communication departments of universities and faculties in order to gain access to more data on content performance.
Endnotes
[2] Pavluska, 2010.
[6] Bulotaite, 2003.
[7] Beverland, 2009.
[8] Chapleo, 2010.
[11] Rutter et al., 2016; Perera et al., 2022; Nofrizal et al., 2024.
[12] Fujita et al., 2018.
[14] Nguyen et al., 2021; Perera et al., 2022; Rater & Balkhaya, 2023; Kumar et al., 2025.
[16] Statista, 2026.
[17] Bélanger et al., 2014.
[18] Peruta & Shields, 2017.
[19] Lund, 2019.
[20] Peruta & Shields, 2018.
[21] Taecharungroj, 2017.
[22] Maresova et al., 2020.
[24] Eger et al., 2021.
[25] DataReportal, 2026.
[26] Bélanger et al., 2014.