
Table 1.
Summary of the most relevant empirical studies on FinTech adoption, cybersecurity, and bank performance
| Authors | Year | Context | Method | Main finding | Relevance to this study |
|---|---|---|---|---|---|
| Wang et al. | 2021 | China | DEA + GMM | FinTech raises productivity and cuts operating costs | Baseline direct effect |
| Lee et al. | 2023 | China, 74 banks | DEA-Malmquist + GMM | FinTech reduces overall efficiency through funding costs | Contradictory evidence |
| Khan et al. | 2024 | 59 developing countries | Non-linear panel | U-shaped FinTech–efficiency relationship | Central motivation for a boundary condition |
| Juma Ally et al. | 2025 | Tanzania | Panel | Gains for large banks, losses for small and medium | Heterogeneity by capacity |
| Huang and Said | 2025 | Cross-country | Systematic review | FinTech raises efficiency, with unexplained variation in magnitude | Frames the boundary-condition question |
| Uddin et al. | 2020 | Cross-country | Panel | Cyber spending volume alone does not determine stability | Separates spending from capability |
| Hasan et al. | 2021 | Cross-sector | PLS-SEM | Cyber readiness improves security and organisational performance | Source of the readiness construct |
| Türegün | 2025 | International | Regression | Strategic integration matters more than spending volume | Supports the capability framing |
| Al Hammadi et al. | 2024 | UAE Islamic banks | Moderation analysis | IT security capability moderates the FinTech effect | Closest moderation test, different outcome |
| Murungu et al. | 2026 | Zimbabwe | Survey regression | Cybersecurity strategies enable digital transformation | Cybersecurity as enabler |
| Hanifan et al. | 2026 | Indonesia | Panel with interaction | Cyber risk management maturity raises the FinTech payoff | Closest direct moderation test |
| Al-Omoush | 2026 | Jordan, 247 respondents | PLS-SEM | AI and cybersecurity drive FinTech innovation and operational excellence | Mediated rather than moderated specification |
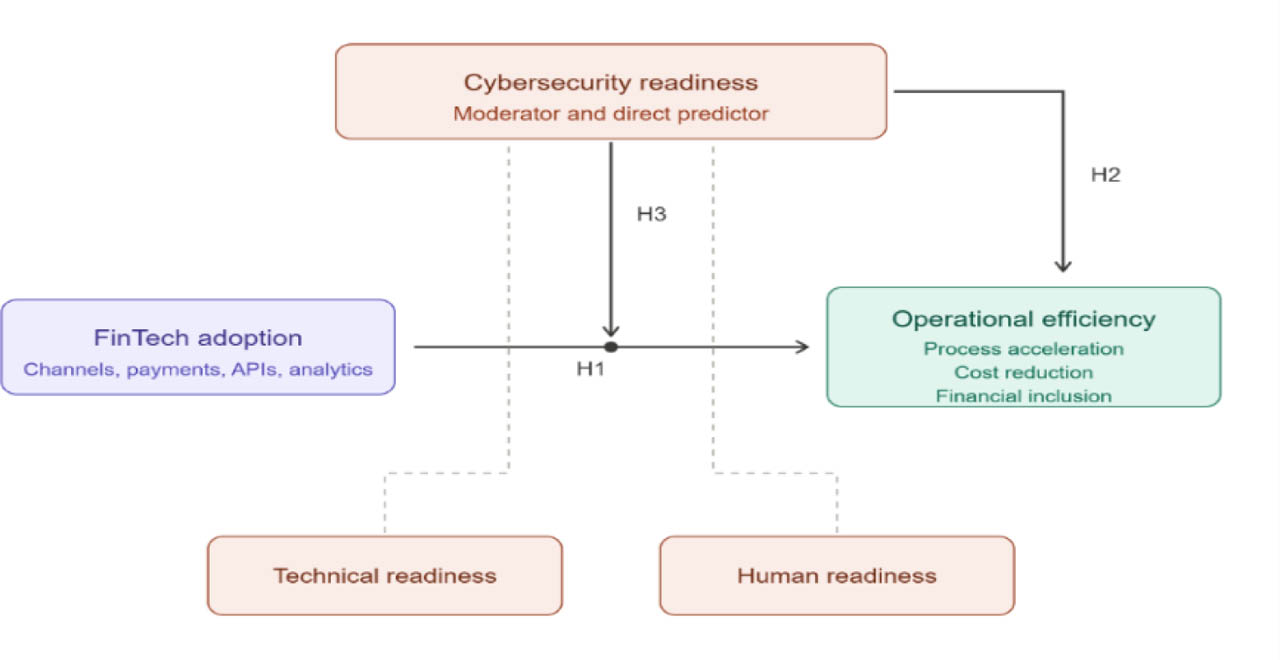
Figure 1.
Conceptual model: Cybersecurity readiness as a boundary condition of the FinTech–operational efficiency relationship
Source: own processing
Table 2.
Respondent profile
| Characteristic | Category | Frequency | Percentage |
|---|---|---|---|
| Gender | Male | 37 | 67.3 |
| Female | 18 | 32.7 | |
| Total | 55 | 100 | |
| Age | 25 years or under | 2 | 3.6 |
| 26 to 35 years | 30 | 54.5 | |
| 36 to 45 years | 21 | 38.2 | |
| Over 45 years | 2 | 3.6 | |
| Total | 55 | 100 | |
| Education | Bachelor's degree | 16 | 29.1 |
| Master's degree | 29 | 52.7 | |
| Doctorate | 5 | 9.1 | |
| Other qualification | 5 | 9.1 | |
| Total | 55 | 100 |
Table 3.
Convergent validity, reliability, and multicollinearity assessment
| Variable | Factors | Items | Loadings(FL) | Cronbach's Alpha | RHO-A | Composite Reliability (CR) | Average Variance Extracted (AVE) | Variance Inflation Factor (VIF) |
|---|---|---|---|---|---|---|---|---|
| FinTech adoption | Item 1 | 0.916 | 0.944 | 0.945 | 0.955 | 0.782 | 4.794 | |
| Item 2 | 0.902 | 4.779 | ||||||
| Item 3 | 0.848 | 2.823 | ||||||
| Item 4 | 0.848 | 2.779 | ||||||
| Item 5 | 0.896 | 3.537 | ||||||
| Item 6 | 0.893 | 4.165 | ||||||
| Cybersecurity readiness | Technical readiness | Item 7 | 0.874 | 0.918 | 0.920 | 0.939 | 0.754 | 2.910 |
| Item 8 | 0.840 | 2.506 | ||||||
| Item 9 | 0.900 | 3.388 | ||||||
| Item 10 | 0.820 | 2.208 | ||||||
| Item 11 | 0.905 | 3.570 | ||||||
| Human readiness | Item 12 | 0.807 | 0.907 | 0.914 | 0.935 | 0.783 | 2.080 | |
| Item 13 | 0.915 | 3.893 | ||||||
| Item 14 | 0.914 | 3.457 | ||||||
| Item 15 | 0.898 | 3.377 | ||||||
| Operational efficiency | Process acceleration | Item 16 | 0.941 | 0.918 | 0.918 | 0.948 | 0.859 | 3.851 |
| Item 17 | 0.918 | 3.042 | ||||||
| Item 18 | 0.922 | 3.201 | ||||||
| Cost reduction | Item 19 | 0.889 | 0.889 | 0.901 | 0.924 | 0.752 | 2.902 | |
| Item 20 | 0.882 | 2.685 | ||||||
| Item 21 | 0.928 | 3.846 | ||||||
| Item 22 | 0.762 | 1.678 | ||||||
| Financial inclusion | Item 23 | 0.950 | 0.920 | 0.822 | 0.949 | 0.862 | 4.677 | |
| Item 24 | 0.899 | 2.676 | ||||||
| Item 25 | 0.935 | 3.984 | ||||||
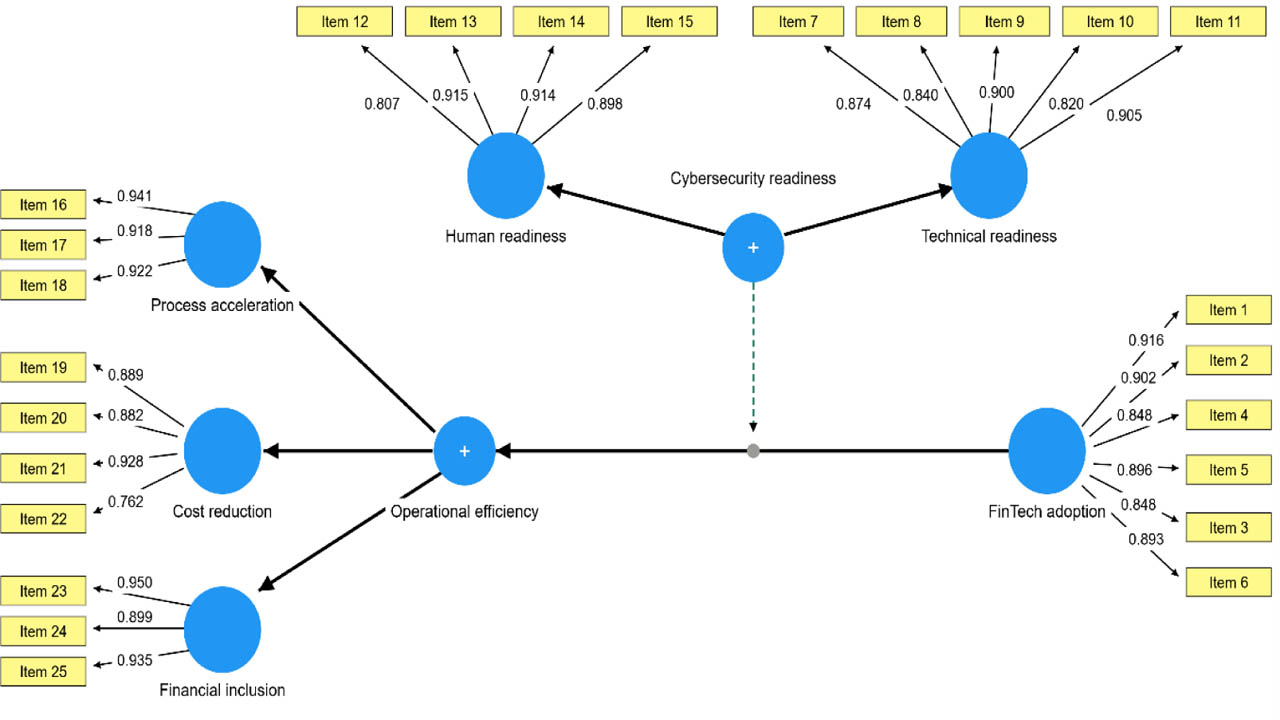
Figure 2.
Measurement model with standardised factor loadings
Source: own processing based on SmartPLS 4 output
Table 4.
Discriminant validity, Fornell-Larcker criterion
| Variables | Human readiness | Technical readiness | Financial inclusion | Cost reduction | Process acceleration |
|---|---|---|---|---|---|
| Human readiness | 0.917 | ||||
| Technical readiness | 0.885 | 0.868 | |||
| Financial inclusion | 0.080 | 0.164 | 0.971 | ||
| Cost reduction | 0.003 | 0.049 | 0.891 | 0.883 | |
| Process acceleration | 0.080 | 0.166 | 0.928 | 0.867 | 0.927 |
Table 5.
Discriminant validity, Heterotrait-Monotrait ratio (HTMT)
| Variables | Human readiness | Technical readiness | Financial inclusion | Cost reduction | Process acceleration |
|---|---|---|---|---|---|
| Human readiness | – | ||||
| Technical readiness | 0.725 | – | |||
| Financial inclusion | 0.123 | 0.181 | – | ||
| Cost reduction | 0.137 | 0.143 | 0.779 | – | |
| Process acceleration | 0.116 | 0.188 | 0.557 | 0.771 | – |
Table 6.
Coefficient of determination
| Endogenous construct | R2 | Adjusted R2 |
|---|---|---|
| Operational efficiency | 0.780 | 0.767 |
Table 7.
Effect size for structural paths
| Path | f2 |
|---|---|
| FinTech adoption → Operational efficiency | 3.430 |
| Cybersecurity readiness → Operational efficiency | 0.220 |
| Cybersecurity readiness × FinTech adoption → Operational efficiency | 0.467 |
Table 9.
Path coefficients and hypothesis testing results
| Path | O | M | STDEV | T | P | Decision |
|---|---|---|---|---|---|---|
| H1: FinTech adoption → Operational efficiency | 0.938 | 0.942 | 0.060 | 15.512 | 0.000 | Supported |
| H2: Cybersecurity readiness → Operational efficiency | 0.243 | 0.240 | 0.086 | 2.808 | 0.005 | Supported |
| H3: Cybersecurity readiness × FinTech adoption → Operational efficiency | 0.330 | 0.330 | 0.067 | 4.922 | 0.000 | Supported |
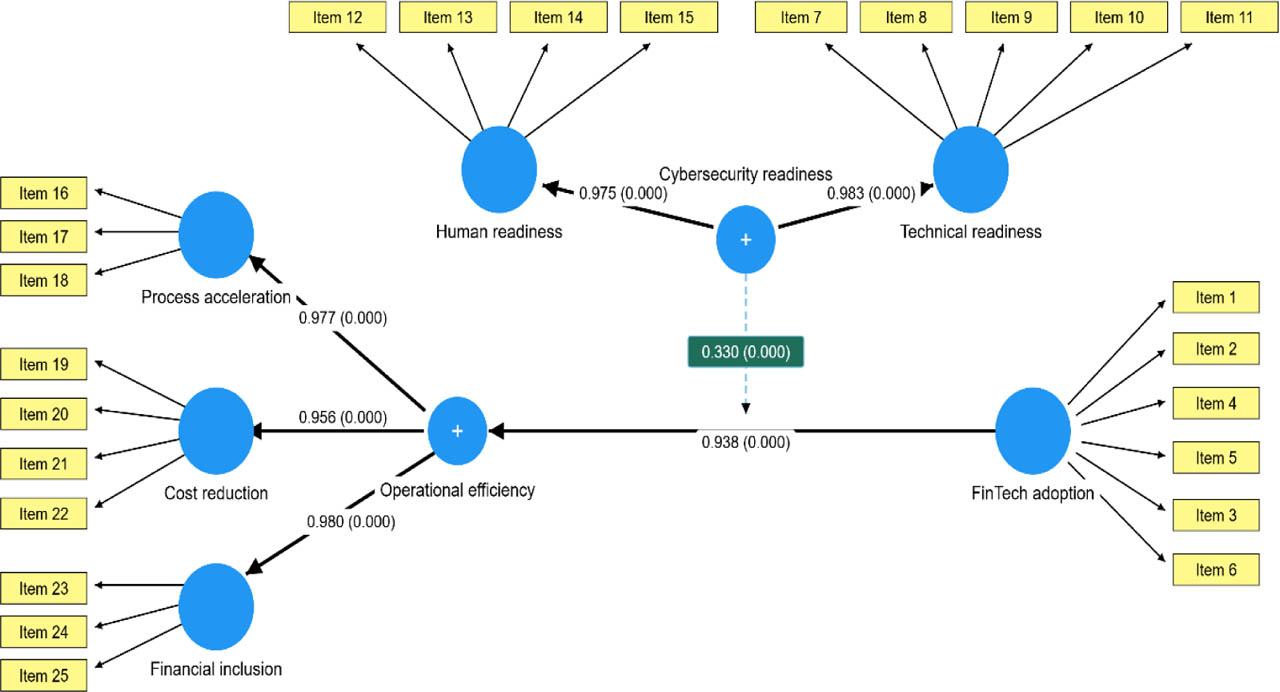
Figure 3.
Structural model with path coefficients and p-values
Source: own processing based on SmartPLS 4 output
Table 10.
Conditional effects of FinTech adoption at three levels of cybersecurity readiness
| Level of cybersecurity readiness | O | M | STDEV | T | P |
|---|---|---|---|---|---|
| High (+1 SD) | 1.268 | 1.272 | 0.112 | 11.285 | 0.000 |
| Mean | 0.938 | 0.942 | 0.060 | 15.512 | 0.000 |
| Low (−1 SD) | 0.608 | 0.612 | 0.061 | 10.004 | 0.000 |
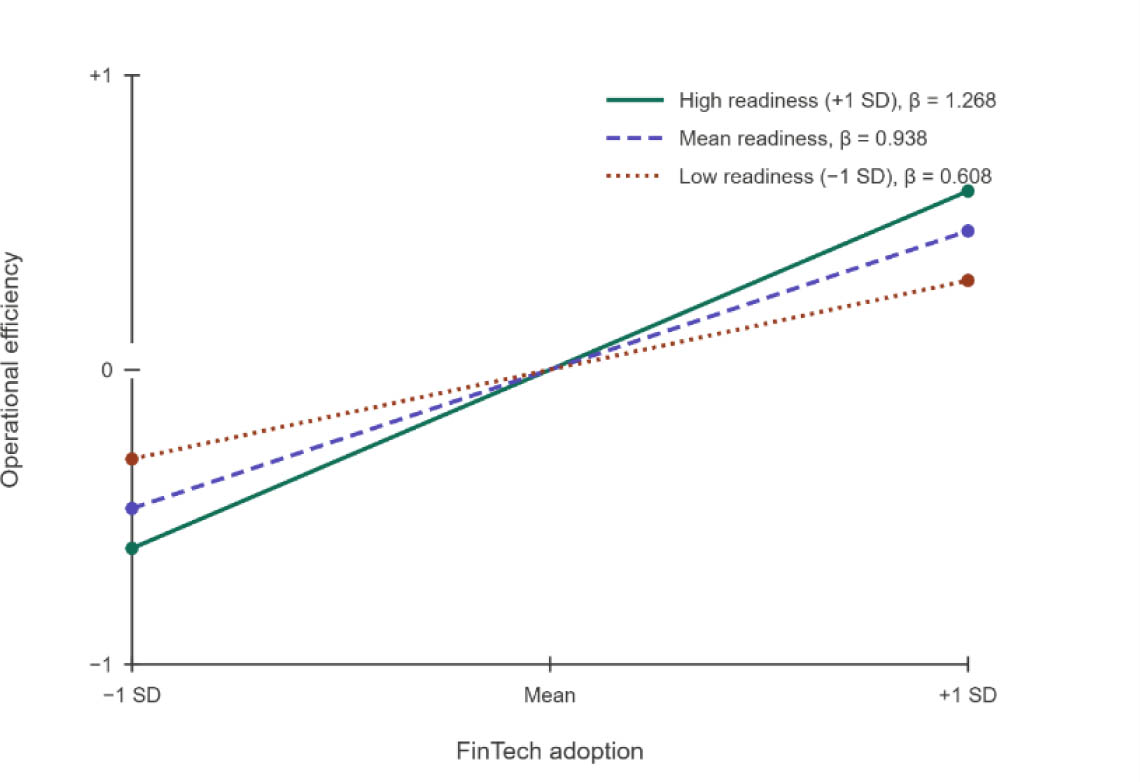
Figure 4.
Simple slope plot of the moderating effect of cybersecurity readiness
Source: own processing based on SmartPLS 4 output