
Introduction
Business competitiveness in sustainable finance has become a central concern for the OECD banking sector, where institutions must balance financial performance with Environmental, Social, and Governance (ESG) criteria and long-term sustainability management. ESG factors have been shown to be crucial drivers of banking performance and risk-adjusted outcomes (Sun et al., 2024). As banks operate in increasingly complex global environments, their ability to integrate ESG principles into core strategies has emerged as a decisive factor in maintaining competitiveness and institutional credibility (Cicchiello et al., 2023). Within the contemporary knowledge economy, intangible resources such as governance quality, stakeholder trust, and sustainability capabilities play a vital role in shaping organizational performance and strategic positioning. ESG scores provide information beyond traditional financial metrics and significantly influence corporate financial outcomes (Chen & Xie, 2022; Fatemi et al., 2018).
Yuen et al. (2022) argue that ESG performance has become a key indicator of sustainability and ethical responsibility in the banking industry, reflecting the growing expectations of regulators, investors, and society. In this context, ESG integration is no longer viewed merely as a regulatory or reputational obligation but as a strategic tool for enhancing sustainable finance outcomes and long-term competitiveness. As financial markets evolve, banks are increasingly required to align their operations with sustainability principles while maintaining efficiency, transparency, and effective risk management.
Previous studies (Alamsyah & Muljo, 2023; Cai et al., 2023; Mititean & Sărmaș, 2023; Yuen et al., 2022; Zamfiroiu & Pînzaru, 2021) have demonstrated that ESG integration enhances institutional transparency, financial performance, stakeholder trust, and long-term stability, thereby bolstering competitiveness within the banking sector. These studies underscore the increasing significance of ESG performance as a strategic element in sustainable finance and sustainability management. However, much of this research remains confined to specific industries, single-country analyses, or particular regional contexts and often depends on subjective weighting methods. This fragmented approach limits the development of integrated, cross-country frameworks capable of comparing ESG performance across the OECD banking sector within the knowledge economy.
Further research (Aleksandrovna et al., 2024; Ma et al., 2024; Nian & Said, 2024; Xu et al., 2024) demonstrates that ESG integration enhances disclosure quality, risk management, and institutional value, reinforcing its role as a strategic driver of competitiveness in sustainable finance. These studies also reveal significant regional disparities in ESG-driven competitiveness, attributable to differences in institutional environments, governance structures, and regulatory systems. Such findings underscore the need for objective and comparable evaluation models capable of assessing ESG-based competitiveness across countries, particularly within the OECD banking sector, where consistent benchmarking is essential for advancing sustainability management in the knowledge economy.
Moreover, many earlier studies rely on subjective weighting techniques or traditional finance-based evaluation models that fail to capture the multidimensional nature of ESG-related competitiveness. Previous research (Alves & Meneses, 2024; Benuzzi et al., 2025; Martiny et al., 2024) demonstrates that differences in ESG assessment methodologies, weighting structures, and conventional risk measures often result in inconsistent or incomplete evaluations of sustainability performance. This indicates that traditional financial indicators alone cannot fully reflect the complexity and multidimensionality of ESG outcomes.
In response to these gaps, this study proposes a comprehensive analysis of business competitiveness in sustainable finance by examining the ESG performance of leading banks within the OECD banking sector. The study employs an entropy–TOPSIS multi-criteria decision-making framework to evaluate five ESG dimensions: overall ESG score, shareholder score, CSR strategy, emissions, and resource use. This approach offers an objective, knowledge-driven benchmarking model for assessing sustainability management and competitive positioning across countries. The purpose of this study is to evaluate ESG-based competitiveness among leading OECD banks, identify the most influential ESG dimensions, and offer cross-country insights into sustainable finance within the context of a knowledge economy. By integrating ESG performance with the entropy–TOPSIS method, this study enhances the understanding of competitiveness dynamics and sustainability-oriented strategies in the OECD banking sector.
This study’s originality is demonstrated in four key ways. First, it provides a cross-country benchmark of OECD banks using entropy–TOPSIS across five disaggregated ESG dimensions. Second, it integrates ESG competitiveness within a knowledge-economy framework by linking ESG performance to knowledge-based capabilities, transparency, learning, and stakeholder trust. Third, it advances prior research by employing objective entropy-based weighting alongside sensitivity and bootstrap robustness analyses. Finally, it develops a conceptual framework explaining how ESG dimensions translate into competitiveness through knowledge-based capabilities in the banking sector.
Literature review
ESG Performance and competitive dynamics in the OECD banking sector
In today’s knowledge economy, ESG performance has become a key determinant of competitiveness in the banking industry, as regulatory pressures and stakeholder expectations increasingly emphasize sustainability, transparency, and ethical accountability. A previous study by Azmi et al. (2021) demonstrated that integrating ESG factors enhances financial performance, disclosure quality, risk management, and firm value, positioning ESG as a strategic resource rather than merely a compliance requirement. These findings suggest that sustainable finance practices are closely linked to long-term competitiveness and institutional resilience.
However, ESG-driven competitiveness remains uneven across the OECD banking sector. Research by Cornett et al. (2016) indicates that institutional context, governance structures, and firm-specific characteristics significantly influence ESG outcomes, resulting in regional disparities in banking performance. Regulatory fragmentation and inconsistent alignment with global sustainability standards further hinder ESG adoption in certain jurisdictions (Baker McKenzie, 2021). Additional studies emphasize the importance of transparency and disclosure quality in improving environmental and social outcomes (Mazzioni et al., 2024), while robust ESG implementation enhances credibility, reduces financial and credit risks, and contributes to financial system stability (Abdul Razak et al., 2023; KPMG, 2023). These findings demonstrate that sustainability management plays a critical role in shaping competitiveness within modern banking systems.
Theoretical perspectives on sustainable finance and competitiveness
The strategic importance of ESG performance in banking is rooted in Stakeholder Theory and Sustainable Development Theory. Stakeholder Theory posits that organizations gain a competitive advantage by addressing the interests of multiple stakeholders, including investors, regulators, customers, and society (Freeman, 1984). Sustainable Development Theory emphasizes long-term viability through responsible resource use, resilience, and alignment with environmental and social priorities (World Commission) on Environment and Development, 1987. Together, these perspectives support the view that integrating ESG factors enhances both organizational legitimacy and long-term performance.
Empirical evidence supports these theoretical arguments. Previous studies (Maside-Sanfiz et al., 2024; Shan et al., 2025) demonstrate that higher ESG engagement enhances institutional stability, reputational capital, and strategic outcomes in banking. Similarly, studies (Horobet et al., 2025; Waktola et al., 2024) show that banks that effectively integrate ESG principles are better positioned to attract capital, mitigate risks, and build stakeholder trust. These findings underscore ESG performance as a critical component of sustainable finance and competitive positioning within the knowledge economy. Nevertheless, ESG-focused research within the OECD banking sector remains limited in scope, highlighting the need for cross-country benchmarking and objective competitiveness assessments.
ESG, knowledge economy, and competitive advantage
Within the knowledge economy, ESG performance can be viewed as an intangible strategic resource rather than a compliance-based metric. From a Resource-Based View (RBV), ESG-related routines, governance quality, disclosure capabilities, and stakeholder alignment constitute valuable, rare, and inimitable resources that support sustainable competitive advantage. From a Knowledge-Based View (KBV), ESG practices enhance organizational learning, information integration, risk anticipation, and strategic adaptation (Gillan et al., 2021).
Grounded in Stakeholder Theory, Sustainable Development Theory, and the RBV and KBV perspectives, this study conceptualizes ESG as a strategic, knowledge-based capability. Accordingly, a conceptual framework (Figure 1) is developed to link ESG dimensions with business competitiveness in the OECD banking sector.
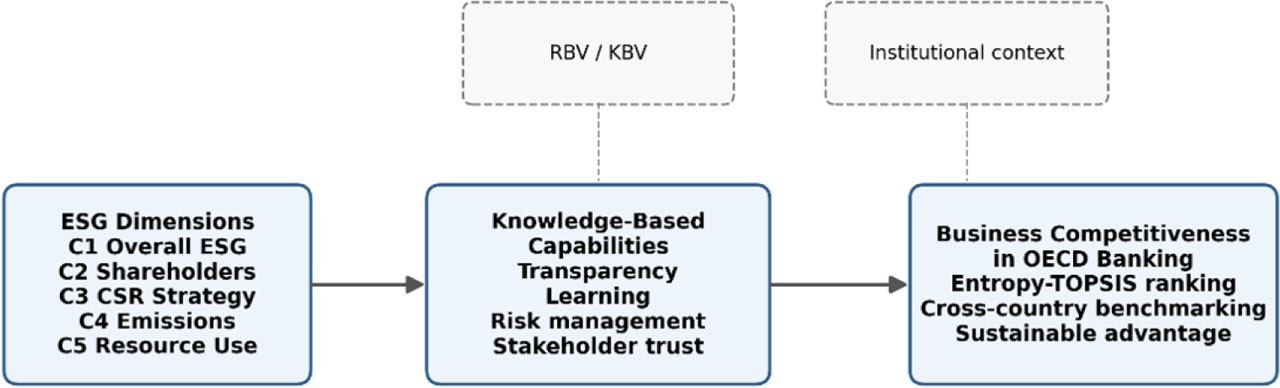
Figure 1.
Conceptual framework
Source: own processing
The framework demonstrates how ESG capabilities improve decision-making, reputational capital, funding conditions, regulatory responsiveness, and stakeholder trust by transforming sustainability-related information into strategic actions.
Methodological gaps and the need for objective ESG competitiveness assessment
Despite the growing body of research on ESG and sustainable finance, significant methodological gaps persist. Previous studies (Lebbar & El-Aroui, 2026; Lee et al., 2025) indicate that many ESG evaluations are context-specific, lack cross-country comparability, and rely on subjective weighting schemes that compromise consistency. Furthermore, limited attention has been given to ESG-driven competitiveness as a multidimensional construct encompassing governance quality, environmental risk management, and strategic sustainability orientation across international markets (Korankye et al., 2025; Mirza et al., 2025).
To address these limitations, recent studies advocate using objective, data-driven evaluation models that capture the multidimensional nature of ESG performance (Bouattour et al., 2024; Xi & Wang, 2024). The integration of entropy weighting with the TOPSIS method provides a transparent and replicable framework for cross-country benchmarking by assigning objective weights to ESG dimensions and ranking institutions based on their proximity to an ideal sustainability profile (Zournatzidou et al., 2025). Compared to traditional financial valuation models, such as price-to-earnings (P/E) ratios or discounted cash flow models, this approach more effectively captures the complex drivers of competitiveness in sustainable finance.
Building on these insights, the present study examines ESG-driven competitiveness within the OECD banking sector using an entropy–TOPSIS framework. By evaluating five ESG sub-dimensions, the study offers an objective benchmarking model for sustainability management in the knowledge economy. This approach overcomes the limitations of prior research by providing a comprehensive, cross-country analysis of ESG-based competitiveness and identifying strategic sustainability patterns among leading OECD banks.
Research methodology
The study employs a three-phase framework (Figure 2) to evaluate ESG-based competitiveness. First, a decision matrix is constructed using five ESG criteria: ESG (C1), Shareholders (C2), CSR Strategy (C3), Emissions (C4), and Resource Use (C5). Second, the entropy method is applied to determine objective weights. Third, the TOPSIS method ranks banks according to their proximity to the ideal ESG performance.
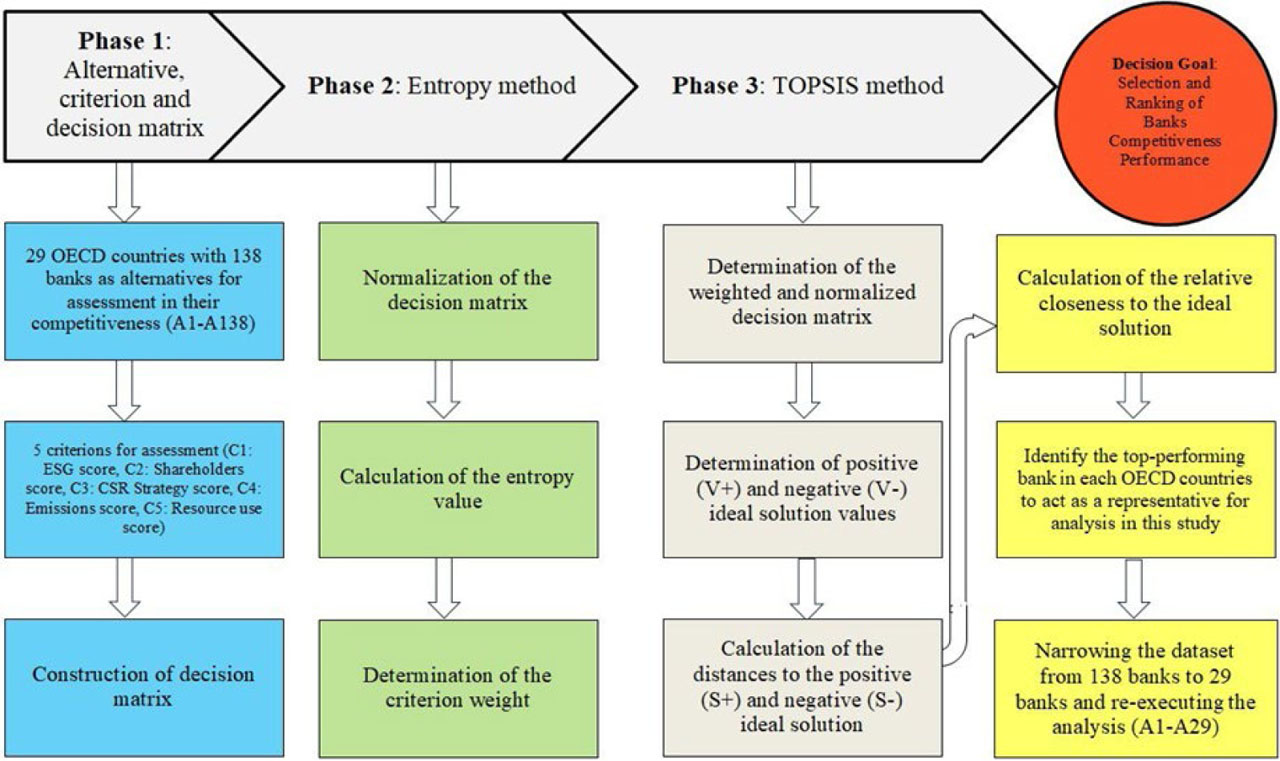
Figure 2.
Research workflow diagram
Source: own processing
This study employs the entropy–TOPSIS method to establish a hierarchical ranking of OECD banks. To enhance methodological transparency, the sample selection procedure was refined. The initial Refinitiv dataset included 1,145 banks from 38 OECD member countries over the period 2018–2023. Following rigorous data cleaning to ensure completeness and reliability across all five ESG dimensions, the sample was reduced to 138 banks from 29 countries with complete data. To ensure balanced cross-country comparability and avoid over-representation, only the top-performing bank from each country was retained, resulting in a final sample of 29 banks. The entropy–TOPSIS analysis was then re-executed on this refined dataset. Figure A1 in the Appendix illustrates the selected banks and highlights the top five performers. This refinement ensures a consistent and comparable dataset across countries.
The steps involved in this method are as follows:
Step 1: Create a data evaluation matrix, where:
This matrix (Formula 1) serves as the foundation for the subsequent steps in the methodology, where the data will be normalized, weighted, and analyzed to determine the ESG performance rankings of the banks (Ke et al., 2024). By creating a comprehensive data evaluation matrix, the study ensures that the analysis is based on accurate and well-organized data, leading to reliable and meaningful results.
Step 2: Normalizing the following matrix, where:
The normalization process (Formula 2) is crucial for ensuring that the ESG scores are comparable across different scales. Prior authors have applied this formula. By converting the raw scores into normalized values, the study can accurately assess the relative performance of each bank (Weng & Yang, 2022). This step is essential for the subsequent analysis using the entropy method and TOPSIS.
Step 3: Entropy-based calculation of the objective weight, where:
The entropy-based calculation (Formula 3) is crucial for determining the objective weights of each attribute in the ESG performance evaluation. By calculating the entropy values, the study can assess the level of uncertainty and variability in the ESG scores, which in turn reflects the relative importance of each attribute. This step is essential for the subsequent integrated assessment using the TOPSIS method (Luo et al., 2025).
Step 4: Integrated assessment, whereby:
Step 5: Benefit or cost of each criterion should be the minimum or maximum value, respectively, where:
This step (Formula 5) involves identifying whether each criterion (attribute) should be maximized (benefit) or minimized (cost). This step is crucial for accurately evaluating the performance of each bank based on the given criteria. This formulation follows prior applications (Guo et al., 2024). The positive ideal solution represents the best possible performance for each attribute. It is the maximum value for benefit criteria and the minimum value for cost criteria. The negative ideal solution represents the worst possible performance for each attribute. It is the minimum value for benefit criteria and the maximum value for cost criteria.Step 6: Calculate the closeness of the sample being classified to both the ideal positive and negative reference points, where:
The identification of positive and negative ideal solutions (Formula 6) is crucial for evaluating the relative performance of each bank. By comparing the actual performance of each bank to these ideal solutions, the study can assess how close each bank is to the best possible performance and how far it is from the worst possible performance. This step provides a clear benchmark for evaluating the ESG performance of banks and identifying areas for improvement.
Step 7: Computation of the relative ability indicator value, where:
The relative ability indicator value (Formula 7), denoted Ci, is calculated for each bank. This value represents the relative closeness of each bank to the ideal solution, providing a measure of how well each bank performs in terms of ESG criteria compared to the best and worst performers (Xueshan et al., 2025).
Step 8: Ranking
The ESG-based ranking of banks provides critical insights into institutional strengths, weaknesses, and relative competitiveness. The integration of entropy weighting with the TOPSIS method ensures that ESG indicators are assigned objective weights reflecting their informational importance, thereby producing a transparent and reliable ranking. ESG scores are first normalized, after which entropy weights are calculated to capture the relative contribution of each ESG dimension. TOPSIS then ranks banks according to their proximity to an ideal ESG performance benchmark, enabling the identification of leading institutions and areas requiring improvement. The results facilitate the diffusion of best practices among banks and offer actionable guidance for policymakers and regulators seeking to strengthen ESG standards and promote sustainable banking within OECD countries.
To enhance the empirical credibility of the ranking results, an additional robustness and sensitivity analysis framework was incorporated (Więckowski & Sałabun, 2023). First, a Monte Carlo weight-perturbation procedure was implemented, in which entropy weights were repeatedly varied within a controlled interval to assess whether the bank rankings remained stable under plausible weighting uncertainty.
Second, a bootstrap-based rank stability procedure was conducted by resampling yearly observations and recomputing the entropy–TOPSIS rankings across multiple iterations. Finally, a t-test was performed to examine statistical differences in the results. These procedures enable the study to report ranking persistence, average rank, rank dispersion, and top-position frequency, thereby strengthening the methodological robustness of the research.
Results and discussion
Table 1 presents the preprocessed decision matrix for 29 top-performing banks, one from each OECD country, ensuring data consistency across the analysis. Covering five ESG criteria (C1–C5) for 2018–2023, the matrix reveals substantial cross-country variation in sustainability performance and competitive positioning. These findings align with prior research on uneven ESG outcomes (Gutiérrez-Ponce & Wibowo, 2022, 2024), and highlight the importance of ESG criteria in institutional sustainability. Overall, the results provide valuable benchmarking insights into ESG-driven competitiveness in the OECD banking sector.
Table 1.
Bank Evaluation Matrix
| Alternatives | 2018 | 2019 | 2020 | ||||||||||||
|---|---|---|---|---|---|---|---|---|---|---|---|---|---|---|---|
| C1 | C2 | C3 | C4 | C5 | C1 | C2 | C3 | C4 | C5 | C1 | C2 | C3 | C4 | C5 | |
| A1 | 7707 | 9481 | 9864 | 6200 | 8440 | 7634 | 9681 | 9803 | 8675 | 8757 | 7393 | 9376 | 9853 | 8532 | 8993 |
| A2 | 2291 | 9669 | 6136 | 386 | 2 | 3267 | 9698 | 5290 | 1789 | 3057 | 4782 | 9716 | 4702 | 3084 | 4516 |
| A3 | 4230 | 4674 | 8872 | 4815 | 8089 | 4474 | 5840 | 9789 | 5222 | 8506 | 3901 | 4150 | 9588 | 4742 | 7623 |
| A4 | 1798 | 2116 | 2165 | 751 | 692 | 1997 | 1205 | 2018 | 930 | 774 | 1568 | 1142 | 1409 | 1552 | 2289 |
| A5 | 1703 | 5031 | 3999 | 2252 | 480 | 1828 | 3657 | 9724 | 3067 | 677 | 3232 | 3798 | 9281 | 7344 | 3255 |
| A6 | 1716 | 686 | 1056 | 1199 | 1519 | 2527 | 2999 | 2744 | 7427 | 4642 | 2757 | 7071 | 4649 | 9567 | 4850 |
| A7 | 3419 | 7656 | 1406 | 4204 | 4245 | 2737 | 3906 | 3906 | 4951 | 5277 | 3988 | 3906 | 5625 | 9158 | 6427 |
| A8 | 873 | 319 | 4064 | 2006 | 2104 | 1047 | 1947 | 4211 | 3137 | 1527 | 2489 | 2983 | 6268 | 3005 | 1877 |
| A9 | 5610 | 9752 | 5439 | 5746 | 8593 | 4621 | 8214 | 5081 | 5946 | 8547 | 5028 | 8718 | 9864 | 5087 | 9573 |
| A10 | 8966 | 6944 | 9862 | 9551 | 7317 | 9080 | 6551 | 9801 | 9561 | 7460 | 9027 | 6426 | 8686 | 8761 | 7855 |
| A11 | 5025 | 9489 | 5576 | 4927 | 5190 | 5562 | 9253 | 5758 | 5469 | 5178 | 6176 | 9254 | 9700 | 6785 | 6887 |
| A12 | 5342 | 5765 | 7857 | 5828 | 7893 | 5407 | 8879 | 9571 | 6997 | 7935 | 5898 | 8919 | 9571 | 9328 | 8259 |
| A13 | 5240 | 2500 | 1406 | 3832 | 316 | 3317 | 2500 | 1406 | 5688 | 1563 | 5449 | 2500 | 1406 | 6498 | 3406 |
| A14 | 3593 | 5006 | 3452 | 680 | 1585 | 3488 | 1985 | 1824 | 2010 | 1774 | 3527 | 6314 | 1567 | 3025 | 4591 |
| A15 | 5917 | 8789 | 7901 | 6982 | 7176 | 6330 | 6944 | 6944 | 8248 | 7894 | 6062 | 6400 | 8976 | 8274 | 8057 |
| A16 | 3226 | 9506 | 6590 | 3571 | 2930 | 5755 | 7406 | 6530 | 6479 | 5642 | 5878 | 7820 | 6742 | 6191 | 5924 |
| A17 | 6096 | 7071 | 7068 | 7809 | 2990 | 5631 | 6208 | 6833 | 7684 | 2466 | 5687 | 8763 | 9328 | 7649 | 2860 |
| A18 | 6031 | 9928 | 2765 | 8683 | 2180 | 6459 | 9813 | 3070 | 8714 | 2422 | 6626 | 8997 | 6902 | 6584 | 1845 |
| A19 | 3433 | 8314 | 9763 | 2677 | 1292 | 3275 | 7100 | 4351 | 5594 | 1475 | 3208 | 6757 | 3996 | 5262 | 1610 |
| A20 | 4692 | 2786 | 9025 | 4273 | 9324 | 4433 | 2113 | 8830 | 4375 | 9534 | 4855 | 2616 | 8540 | 4621 | 8294 |
| A21 | 5258 | 2870 | 5740 | 376 | 2233 | 4527 | 1544 | 4504 | 467 | 2400 | 4424 | 2500 | 5154 | 516 | 2820 |
| A22 | 5015 | 544 | 6747 | 9189 | 4762 | 6165 | 278 | 6747 | 9235 | 6161 | 5534 | 100 | 6173 | 8370 | 6247 |
| A23 | 7534 | 9099 | 9724 | 5115 | 9483 | 7073 | 8442 | 9481 | 5099 | 9314 | 6233 | 8656 | 9245 | 6054 | 8957 |
| A24 | 1927 | 3411 | 1121 | 1443 | 3 | 1552 | 2445 | 1474 | 541 | 9 | 1694 | 2560 | 1745 | 524 | 218 |
| A25 | 4754 | 4090 | 8692 | 8205 | 8035 | 4195 | 1947 | 8705 | 6826 | 7777 | 4243 | 2475 | 8348 | 5216 | 8276 |
| A26 | 5310 | 1125 | 9299 | 7389 | 9862 | 5537 | 539 | 9318 | 7247 | 9843 | 5413 | 699 | 9328 | 7436 | 9720 |
| A27 | 7393 | 8039 | 7027 | 4134 | 7458 | 7410 | 7923 | 7969 | 4264 | 5609 | 7832 | 8588 | 5657 | 4271 | 5753 |
| A28 | 4125 | 6257 | 689 | 560 | 504 | 4418 | 5300 | 516 | 707 | 463 | 4400 | 6249 | 2143 | 1164 | 296 |
| A29 | 6619 | 9481 | 8649 | 9086 | 5553 | 6956 | 8623 | 8403 | 9155 | 6889 | 6384 | 7656 | 6740 | 8859 | 9645 |
| Alternatives | 2021 | 2022 | 2023 | ||||||||||||
|---|---|---|---|---|---|---|---|---|---|---|---|---|---|---|---|
| C1 | C2 | C3 | C4 | C5 | C1 | C2 | C3 | C4 | C5 | C1 | C2 | C3 | C4 | C5 | |
| A1 | 7367 | 9266 | 9902 | 9415 | 9014 | 7049 | 9224 | 9880 | 9497 | 9382 | 7410 | 8896 | 9855 | 9392 | 9374 |
| A2 | 5293 | 9160 | 3774 | 3303 | 3715 | 5237 | 9183 | 3906 | 4432 | 3475 | 5586 | 8150 | 3402 | 3851 | 3032 |
| A3 | 3791 | 4018 | 9633 | 4908 | 7850 | 3544 | 3190 | 9626 | 3940 | 7942 | 3843 | 5492 | 9639 | 6647 | 7813 |
| A4 | 2295 | 1370 | 5797 | 3415 | 2568 | 2257 | 2125 | 6994 | 4543 | 3063 | 2408 | 1009 | 6887 | 3910 | 3693 |
| A5 | 4012 | 2191 | 9783 | 7751 | 5335 | 3507 | 1233 | 9783 | 7714 | 5660 | 4165 | 952 | 9783 | 7960 | 6067 |
| A6 | 4977 | 8683 | 5625 | 9849 | 8477 | 6098 | 7762 | 4768 | 9940 | 8671 | 6414 | 4768 | 4768 | 9849 | 7562 |
| A7 | 3197 | 3906 | 3906 | 9712 | 6966 | 4281 | 4900 | 4900 | 9635 | 7290 | 4154 | 3906 | 3906 | 9641 | 7951 |
| A8 | 1768 | 909 | 6089 | 3208 | 3149 | 2051 | 4676 | 5240 | 3676 | 3092 | 1828 | 3058 | 8664 | 3215 | 4064 |
| A9 | 5740 | 7604 | 9864 | 5162 | 9596 | 5791 | 7120 | 9864 | 6285 | 9460 | 5835 | 7086 | 9864 | 5891 | 9500 |
| A10 | 8913 | 5914 | 8688 | 8938 | 7877 | 8658 | 5399 | 8821 | 8949 | 8823 | 8558 | 6815 | 8757 | 7836 | 8138 |
| A11 | 5814 | 8387 | 9797 | 7533 | 7245 | 5834 | 6065 | 9720 | 6686 | 7086 | 5537 | 5216 | 9728 | 6273 | 6879 |
| A12 | 6508 | 9633 | 9571 | 7200 | 9042 | 6384 | 7732 | 7825 | 6706 | 9126 | 7051 | 9645 | 9245 | 7590 | 9076 |
| A13 | 5144 | 3402 | 3402 | 8021 | 4268 | 4721 | 459 | 4133 | 7424 | 4341 | 4942 | 459 | 4133 | 6992 | 4315 |
| A14 | 4194 | 6602 | 1089 | 3383 | 5117 | 3325 | 1441 | 1156 | 3109 | 5170 | 3429 | 1132 | 1089 | 2623 | 4932 |
| A15 | 5706 | 5825 | 9111 | 8523 | 8256 | 6165 | 8964 | 8403 | 8460 | 8230 | 6706 | 8985 | 8694 | 7672 | 6311 |
| A16 | 5015 | 5625 | 5831 | 6183 | 6230 | 6453 | 6711 | 5655 | 5787 | 6153 | 6437 | 8845 | 5061 | 5573 | 6901 |
| A17 | 6309 | 8361 | 9817 | 7799 | 3321 | 5147 | 4478 | 9704 | 5877 | 4591 | 5018 | 2934 | 9688 | 5784 | 4332 |
| A18 | 6252 | 9366 | 6944 | 5323 | 936 | 6065 | 8813 | 6677 | 5104 | 1865 | 6390 | 9120 | 6446 | 4282 | 1410 |
| A19 | 3905 | 2796 | 3686 | 5589 | 890 | 5222 | 9530 | 3313 | 6745 | 2500 | 4484 | 8940 | 2874 | 4593 | 3147 |
| A20 | 4434 | 1687 | 8540 | 4986 | 7716 | 4433 | 3216 | 8540 | 4151 | 7635 | 3641 | 3296 | 9874 | 5383 | 3490 |
| A21 | 7069 | 3798 | 8817 | 3192 | 5445 | 6999 | 7877 | 8521 | 3297 | 6688 | 6543 | 5721 | 4504 | 4087 | 6394 |
| A22 | 5855 | 100 | 5625 | 8447 | 6616 | 6228 | 100 | 5625 | 8658 | 8181 | 6311 | 100 | 5878 | 7611 | 8021 |
| A23 | 7300 | 7739 | 9245 | 6292 | 9685 | 8316 | 9392 | 9630 | 7100 | 9694 | 8446 | 8866 | 9610 | 9347 | 9730 |
| A24 | 3315 | 5940 | 5685 | 928 | 700 | 2890 | 6073 | 8776 | 3861 | 638 | 3576 | 4716 | 8705 | 4778 | 3036 |
| A25 | 4754 | 6626 | 8314 | 4987 | 8268 | 5107 | 5663 | 9368 | 6103 | 8429 | 5104 | 4886 | 9399 | 5358 | 8154 |
| A26 | 5341 | 572 | 9756 | 7606 | 9864 | 5750 | 476 | 9555 | 7672 | 9203 | 6260 | 1877 | 9421 | 7150 | 4138 |
| A27 | 7604 | 8486 | 9132 | 4039 | 6183 | 8236 | 7877 | 8959 | 4352 | 5421 | 8246 | 7273 | 8750 | 4146 | 4951 |
| A28 | 4099 | 4721 | 2177 | 2726 | 244 | 3637 | 4707 | 3944 | 4986 | 268 | 3349 | 5150 | 3946 | 4375 | 738 |
| A29 | 5709 | 3476 | 6162 | 8219 | 9567 | 6902 | 8245 | 4889 | 8549 | 9616 | 6082 | 7007 | 3783 | 8212 | 9628 |
Table 2 reports the normalized ESG performance scores (C1–C5) for 2018–2023 (Formula 2), highlighting significant regional disparities within the OECD banking sector.
Table 2.
Normalization
| Alternatives | 2018 | 2019 | 2020 | ||||||||||||
|---|---|---|---|---|---|---|---|---|---|---|---|---|---|---|---|
| C1 | C2 | C3 | C4 | C5 | C1 | C2 | C3 | C4 | C5 | C1 | C2 | C3 | C4 | C5 | |
| A1 | 0.24 | 0.24 | 0.24 | 0.22 | 0.25 | 0.24 | 0.25 | 0.24 | 0.24 | 0.25 | 0.23 | 0.24 | 0.23 | 0.23 | 0.24 |
| A2 | 0.13 | 0.24 | 0.19 | 0.05 | 0.00 | 0.15 | 0.25 | 0.17 | 0.11 | 0.15 | 0.18 | 0.24 | 0.16 | 0.14 | 0.17 |
| A3 | 0.18 | 0.17 | 0.23 | 0.19 | 0.25 | 0.18 | 0.20 | 0.24 | 0.18 | 0.24 | 0.16 | 0.16 | 0.22 | 0.17 | 0.22 |
| A4 | 0.12 | 0.11 | 0.11 | 0.08 | 0.07 | 0.12 | 0.09 | 0.11 | 0.08 | 0.07 | 0.10 | 0.08 | 0.09 | 0.10 | 0.12 |
| A5 | 0.11 | 0.17 | 0.15 | 0.13 | 0.06 | 0.12 | 0.15 | 0.24 | 0.14 | 0.07 | 0.15 | 0.15 | 0.22 | 0.21 | 0.14 |
| A6 | 0.11 | 0.06 | 0.08 | 0.10 | 0.11 | 0.14 | 0.14 | 0.13 | 0.22 | 0.18 | 0.14 | 0.21 | 0.16 | 0.24 | 0.17 |
| A7 | 0.16 | 0.21 | 0.09 | 0.18 | 0.18 | 0.14 | 0.16 | 0.15 | 0.18 | 0.19 | 0.17 | 0.15 | 0.17 | 0.23 | 0.20 |
| A8 | 0.08 | 0.04 | 0.15 | 0.12 | 0.13 | 0.09 | 0.11 | 0.16 | 0.14 | 0.10 | 0.13 | 0.13 | 0.18 | 0.13 | 0.11 |
| A9 | 0.20 | 0.24 | 0.18 | 0.21 | 0.26 | 0.18 | 0.23 | 0.17 | 0.20 | 0.24 | 0.19 | 0.23 | 0.23 | 0.17 | 0.24 |
| A10 | 0.26 | 0.20 | 0.24 | 0.27 | 0.24 | 0.26 | 0.21 | 0.24 | 0.25 | 0.23 | 0.25 | 0.20 | 0.21 | 0.23 | 0.22 |
| A11 | 0.19 | 0.24 | 0.18 | 0.19 | 0.20 | 0.20 | 0.25 | 0.18 | 0.19 | 0.19 | 0.21 | 0.24 | 0.23 | 0.20 | 0.21 |
| A12 | 0.20 | 0.18 | 0.21 | 0.21 | 0.25 | 0.20 | 0.24 | 0.23 | 0.21 | 0.24 | 0.20 | 0.23 | 0.22 | 0.24 | 0.23 |
| A13 | 0.20 | 0.12 | 0.09 | 0.17 | 0.05 | 0.16 | 0.13 | 0.09 | 0.19 | 0.10 | 0.19 | 0.12 | 0.09 | 0.20 | 0.15 |
| A14 | 0.16 | 0.17 | 0.14 | 0.07 | 0.11 | 0.16 | 0.11 | 0.10 | 0.11 | 0.11 | 0.16 | 0.20 | 0.09 | 0.13 | 0.17 |
| A15 | 0.21 | 0.23 | 0.21 | 0.23 | 0.23 | 0.22 | 0.21 | 0.20 | 0.23 | 0.23 | 0.21 | 0.20 | 0.22 | 0.22 | 0.22 |
| A16 | 0.15 | 0.24 | 0.20 | 0.16 | 0.15 | 0.21 | 0.22 | 0.19 | 0.20 | 0.20 | 0.20 | 0.22 | 0.19 | 0.19 | 0.19 |
| A17 | 0.21 | 0.20 | 0.20 | 0.24 | 0.15 | 0.20 | 0.20 | 0.20 | 0.22 | 0.13 | 0.20 | 0.23 | 0.22 | 0.21 | 0.13 |
| A18 | 0.21 | 0.24 | 0.13 | 0.26 | 0.13 | 0.22 | 0.25 | 0.13 | 0.24 | 0.13 | 0.21 | 0.23 | 0.19 | 0.20 | 0.11 |
| A19 | 0.16 | 0.22 | 0.24 | 0.14 | 0.10 | 0.15 | 0.22 | 0.16 | 0.19 | 0.10 | 0.15 | 0.20 | 0.14 | 0.18 | 0.10 |
| A20 | 0.19 | 0.13 | 0.23 | 0.18 | 0.27 | 0.18 | 0.12 | 0.22 | 0.17 | 0.26 | 0.18 | 0.13 | 0.21 | 0.17 | 0.23 |
| A21 | 0.20 | 0.13 | 0.18 | 0.05 | 0.13 | 0.18 | 0.10 | 0.16 | 0.05 | 0.13 | 0.18 | 0.12 | 0.16 | 0.06 | 0.13 |
| A22 | 0.19 | 0.06 | 0.20 | 0.26 | 0.19 | 0.21 | 0.04 | 0.20 | 0.24 | 0.21 | 0.20 | 0.02 | 0.18 | 0.22 | 0.20 |
| A23 | 0.24 | 0.23 | 0.24 | 0.20 | 0.27 | 0.23 | 0.23 | 0.23 | 0.18 | 0.25 | 0.21 | 0.23 | 0.22 | 0.19 | 0.24 |
| A24 | 0.12 | 0.14 | 0.08 | 0.10 | 0.00 | 0.11 | 0.13 | 0.09 | 0.06 | 0.01 | 0.11 | 0.12 | 0.10 | 0.06 | 0.04 |
| A25 | 0.19 | 0.15 | 0.22 | 0.25 | 0.25 | 0.18 | 0.11 | 0.22 | 0.21 | 0.23 | 0.17 | 0.12 | 0.21 | 0.18 | 0.23 |
| A26 | 0.20 | 0.08 | 0.23 | 0.24 | 0.28 | 0.20 | 0.06 | 0.23 | 0.22 | 0.26 | 0.19 | 0.07 | 0.22 | 0.21 | 0.25 |
| A27 | 0.23 | 0.22 | 0.20 | 0.18 | 0.24 | 0.23 | 0.23 | 0.21 | 0.17 | 0.20 | 0.23 | 0.23 | 0.17 | 0.16 | 0.19 |
| A28 | 0.17 | 0.19 | 0.06 | 0.07 | 0.06 | 0.18 | 0.19 | 0.05 | 0.07 | 0.06 | 0.17 | 0.19 | 0.11 | 0.08 | 0.04 |
| A29 | 0.22 | 0.24 | 0.22 | 0.26 | 0.21 | 0.23 | 0.24 | 0.22 | 0.24 | 0.22 | 0.21 | 0.22 | 0.19 | 0.23 | 0.24 |
| Alternatives | 2021 | 2022 | 2023 | ||||||||||||
|---|---|---|---|---|---|---|---|---|---|---|---|---|---|---|---|
| C1 | C2 | C3 | C4 | C5 | C1 | C2 | C3 | C4 | C5 | C1 | C2 | C3 | C4 | C5 | |
| A1 | 0.22 | 0.24 | 0.22 | 0.23 | 0.23 | 0.21 | 0.24 | 0.22 | 0.23 | 0.23 | 0.22 | 0.24 | 0.22 | 0.23 | 0.23 |
| A2 | 0.19 | 0.24 | 0.14 | 0.14 | 0.15 | 0.18 | 0.24 | 0.14 | 0.16 | 0.14 | 0.19 | 0.23 | 0.13 | 0.15 | 0.13 |
| A3 | 0.16 | 0.16 | 0.22 | 0.17 | 0.21 | 0.15 | 0.14 | 0.22 | 0.15 | 0.21 | 0.16 | 0.19 | 0.22 | 0.19 | 0.21 |
| A4 | 0.12 | 0.09 | 0.17 | 0.14 | 0.12 | 0.12 | 0.11 | 0.18 | 0.16 | 0.13 | 0.12 | 0.08 | 0.18 | 0.15 | 0.15 |
| A5 | 0.16 | 0.12 | 0.22 | 0.21 | 0.18 | 0.15 | 0.09 | 0.22 | 0.21 | 0.18 | 0.16 | 0.08 | 0.22 | 0.21 | 0.19 |
| A6 | 0.18 | 0.24 | 0.17 | 0.24 | 0.22 | 0.20 | 0.22 | 0.15 | 0.23 | 0.22 | 0.20 | 0.18 | 0.15 | 0.23 | 0.21 |
| A7 | 0.15 | 0.16 | 0.14 | 0.23 | 0.20 | 0.17 | 0.17 | 0.15 | 0.23 | 0.20 | 0.16 | 0.16 | 0.14 | 0.23 | 0.21 |
| A8 | 0.11 | 0.08 | 0.17 | 0.13 | 0.13 | 0.11 | 0.17 | 0.16 | 0.14 | 0.13 | 0.11 | 0.14 | 0.20 | 0.13 | 0.15 |
| A9 | 0.19 | 0.22 | 0.22 | 0.17 | 0.23 | 0.19 | 0.21 | 0.22 | 0.19 | 0.23 | 0.19 | 0.21 | 0.22 | 0.18 | 0.23 |
| A10 | 0.24 | 0.19 | 0.21 | 0.22 | 0.21 | 0.24 | 0.18 | 0.21 | 0.22 | 0.22 | 0.23 | 0.21 | 0.21 | 0.21 | 0.22 |
| A11 | 0.20 | 0.23 | 0.22 | 0.21 | 0.20 | 0.19 | 0.19 | 0.22 | 0.19 | 0.20 | 0.19 | 0.18 | 0.22 | 0.19 | 0.20 |
| A12 | 0.21 | 0.25 | 0.22 | 0.20 | 0.23 | 0.20 | 0.22 | 0.19 | 0.19 | 0.22 | 0.21 | 0.25 | 0.21 | 0.21 | 0.23 |
| A13 | 0.18 | 0.15 | 0.13 | 0.21 | 0.16 | 0.17 | 0.05 | 0.14 | 0.20 | 0.15 | 0.18 | 0.05 | 0.14 | 0.20 | 0.16 |
| A14 | 0.17 | 0.21 | 0.07 | 0.14 | 0.17 | 0.15 | 0.09 | 0.07 | 0.13 | 0.17 | 0.15 | 0.09 | 0.07 | 0.12 | 0.17 |
| A15 | 0.19 | 0.19 | 0.21 | 0.22 | 0.22 | 0.20 | 0.23 | 0.20 | 0.21 | 0.21 | 0.21 | 0.24 | 0.21 | 0.21 | 0.19 |
| A16 | 0.18 | 0.19 | 0.17 | 0.19 | 0.19 | 0.20 | 0.20 | 0.16 | 0.18 | 0.18 | 0.20 | 0.24 | 0.16 | 0.18 | 0.20 |
| A17 | 0.20 | 0.23 | 0.22 | 0.21 | 0.14 | 0.18 | 0.17 | 0.22 | 0.18 | 0.16 | 0.18 | 0.14 | 0.22 | 0.18 | 0.16 |
| A18 | 0.20 | 0.24 | 0.18 | 0.17 | 0.07 | 0.20 | 0.23 | 0.18 | 0.17 | 0.10 | 0.20 | 0.24 | 0.18 | 0.15 | 0.09 |
| A19 | 0.16 | 0.13 | 0.13 | 0.18 | 0.07 | 0.18 | 0.24 | 0.13 | 0.19 | 0.12 | 0.17 | 0.24 | 0.12 | 0.16 | 0.13 |
| A20 | 0.17 | 0.10 | 0.20 | 0.17 | 0.21 | 0.17 | 0.14 | 0.20 | 0.15 | 0.20 | 0.15 | 0.15 | 0.22 | 0.17 | 0.14 |
| A21 | 0.22 | 0.16 | 0.21 | 0.13 | 0.18 | 0.21 | 0.22 | 0.20 | 0.13 | 0.19 | 0.20 | 0.19 | 0.15 | 0.15 | 0.19 |
| A22 | 0.20 | 0.03 | 0.17 | 0.22 | 0.19 | 0.20 | 0.02 | 0.16 | 0.22 | 0.21 | 0.20 | 0.03 | 0.17 | 0.21 | 0.22 |
| A23 | 0.22 | 0.22 | 0.21 | 0.19 | 0.24 | 0.23 | 0.24 | 0.22 | 0.20 | 0.23 | 0.23 | 0.24 | 0.22 | 0.23 | 0.24 |
| A24 | 0.15 | 0.20 | 0.17 | 0.07 | 0.06 | 0.14 | 0.19 | 0.21 | 0.15 | 0.06 | 0.15 | 0.17 | 0.21 | 0.16 | 0.13 |
| A25 | 0.18 | 0.21 | 0.20 | 0.17 | 0.22 | 0.18 | 0.19 | 0.21 | 0.18 | 0.22 | 0.18 | 0.18 | 0.21 | 0.17 | 0.22 |
| A26 | 0.19 | 0.06 | 0.22 | 0.21 | 0.24 | 0.19 | 0.05 | 0.21 | 0.20 | 0.23 | 0.20 | 0.11 | 0.21 | 0.20 | 0.15 |
| A27 | 0.22 | 0.23 | 0.21 | 0.15 | 0.19 | 0.23 | 0.22 | 0.21 | 0.15 | 0.17 | 0.23 | 0.22 | 0.21 | 0.15 | 0.17 |
| A28 | 0.16 | 0.17 | 0.10 | 0.12 | 0.04 | 0.15 | 0.17 | 0.14 | 0.16 | 0.04 | 0.15 | 0.18 | 0.14 | 0.16 | 0.07 |
| A29 | 0.19 | 0.15 | 0.17 | 0.22 | 0.23 | 0.21 | 0.23 | 0.15 | 0.22 | 0.23 | 0.20 | 0.21 | 0.14 | 0.21 | 0.24 |
Banks from Canada (A10), Spain (A23), and Turkey (A29) achieve the highest scores, indicating stronger ESG integration, whereas those from Belgium (A8), Colombia (A14), and the Netherlands (A24) record the lowest, reflecting gaps in ESG adoption (Elamer & Boulhaga, 2024). These differences underscore the need for region-specific strategies to enhance ESG-driven competitiveness in the knowledge economy.
Table 3 presents entropy-based weights (Formula 3), highlighting regional differences in ESG performance variability. Banks from Canada (A10) and Spain (A23) exhibit the highest values, indicating greater uncertainty and elevated ESG-related risks, whereas those from Belgium (A8) and Colombia (A14) show the lowest, reflecting more stable performance (Ragazou et al., 2025). These findings emphasize the value of entropy analysis in identifying performance instability and informing sustainability strategies.
Table 3.
Entropy results
| Alternatives | 2018 | 2019 | 2020 | ||||||||||||
|---|---|---|---|---|---|---|---|---|---|---|---|---|---|---|---|
| C1 | C2 | C3 | C4 | C5 | C1 | C2 | C3 | C4 | C5 | C1 | C2 | C3 | C4 | C5 | |
| A1 | −0.34 | −0.34 | −0.34 | −0.33 | −0.35 | −0.34 | −0.35 | −0.34 | −0.34 | −0.35 | −0.34 | −0.34 | −0.34 | −0.34 | −0.34 |
| A2 | −0.27 | −0.34 | −0.31 | −0.16 | −0.02 | −0.29 | −0.35 | −0.30 | −0.24 | −0.28 | −0.31 | −0.34 | −0.29 | −0.27 | −0.30 |
| A3 | −0.31 | −0.30 | −0.34 | −0.32 | −0.35 | −0.31 | −0.32 | −0.34 | −0.31 | −0.34 | −0.30 | −0.29 | −0.34 | −0.30 | −0.33 |
| A4 | −0.25 | −0.24 | −0.25 | −0.20 | −0.19 | −0.26 | −0.21 | −0.24 | −0.20 | −0.19 | −0.24 | −0.21 | −0.21 | −0.23 | −0.25 |
| A5 | −0.25 | −0.30 | −0.29 | −0.27 | −0.17 | −0.25 | −0.29 | −0.34 | −0.28 | −0.18 | −0.28 | −0.29 | −0.33 | −0.33 | −0.28 |
| A6 | −0.25 | −0.17 | −0.20 | −0.22 | −0.24 | −0.27 | −0.28 | −0.26 | −0.33 | −0.31 | −0.27 | −0.33 | −0.29 | −0.34 | −0.30 |
| A7 | −0.29 | −0.33 | −0.22 | −0.31 | −0.31 | −0.28 | −0.29 | −0.28 | −0.31 | −0.32 | −0.30 | −0.29 | −0.30 | −0.34 | −0.32 |
| A8 | −0.20 | −0.14 | −0.29 | −0.26 | −0.26 | −0.21 | −0.25 | −0.29 | −0.28 | −0.23 | −0.27 | −0.27 | −0.31 | −0.27 | −0.24 |
| A9 | −0.32 | −0.34 | −0.31 | −0.33 | −0.35 | −0.31 | −0.34 | −0.30 | −0.32 | −0.34 | −0.31 | −0.34 | −0.34 | −0.30 | −0.34 |
| A10 | −0.35 | −0.32 | −0.34 | −0.35 | −0.34 | −0.35 | −0.33 | −0.34 | −0.35 | −0.34 | −0.35 | −0.32 | −0.33 | −0.34 | −0.33 |
| A11 | −0.32 | −0.34 | −0.31 | −0.32 | −0.32 | −0.32 | −0.34 | −0.31 | −0.31 | −0.32 | −0.33 | −0.34 | −0.34 | −0.32 | −0.33 |
| A12 | −0.32 | −0.31 | −0.33 | −0.33 | −0.35 | −0.32 | −0.34 | −0.34 | −0.33 | −0.34 | −0.32 | −0.34 | −0.33 | −0.34 | −0.34 |
| A13 | −0.32 | −0.26 | −0.22 | −0.30 | −0.15 | −0.29 | −0.26 | −0.22 | −0.32 | −0.24 | −0.32 | −0.26 | −0.21 | −0.32 | −0.28 |
| A14 | −0.30 | −0.30 | −0.28 | −0.19 | −0.24 | −0.29 | −0.25 | −0.23 | −0.25 | −0.24 | −0.29 | −0.32 | −0.22 | −0.27 | −0.30 |
| A15 | −0.33 | −0.34 | −0.33 | −0.34 | −0.34 | −0.33 | −0.33 | −0.32 | −0.34 | −0.34 | −0.33 | −0.32 | −0.33 | −0.33 | −0.34 |
| A16 | −0.29 | −0.34 | −0.32 | −0.30 | −0.28 | −0.32 | −0.33 | −0.32 | −0.32 | −0.32 | −0.32 | −0.33 | −0.31 | −0.32 | −0.32 |
| A17 | −0.33 | −0.32 | −0.32 | −0.34 | −0.29 | −0.32 | −0.32 | −0.32 | −0.33 | −0.27 | −0.32 | −0.34 | −0.33 | −0.33 | −0.27 |
| A18 | −0.33 | −0.34 | −0.26 | −0.35 | −0.26 | −0.33 | −0.35 | −0.27 | −0.34 | −0.27 | −0.33 | −0.34 | −0.32 | −0.32 | −0.24 |
| A19 | −0.29 | −0.33 | −0.34 | −0.28 | −0.23 | −0.29 | −0.33 | −0.29 | −0.32 | −0.23 | −0.28 | −0.32 | −0.28 | −0.31 | −0.23 |
| A20 | −0.31 | −0.26 | −0.34 | −0.31 | −0.35 | −0.31 | −0.25 | −0.34 | −0.30 | −0.35 | −0.31 | −0.26 | −0.33 | −0.30 | −0.34 |
| A21 | −0.32 | −0.26 | −0.31 | −0.16 | −0.27 | −0.31 | −0.23 | −0.29 | −0.16 | −0.26 | −0.31 | −0.26 | −0.30 | −0.16 | −0.27 |
| A22 | −0.32 | −0.16 | −0.32 | −0.35 | −0.32 | −0.33 | −0.13 | −0.32 | −0.34 | −0.33 | −0.32 | −0.09 | −0.31 | −0.33 | −0.32 |
| A23 | −0.34 | −0.34 | −0.34 | −0.32 | −0.35 | −0.34 | −0.34 | −0.34 | −0.31 | −0.35 | −0.33 | −0.34 | −0.33 | −0.32 | −0.34 |
| A24 | −0.25 | −0.28 | −0.20 | −0.24 | −0.03 | −0.24 | −0.26 | −0.22 | −0.17 | −0.04 | −0.24 | −0.26 | −0.22 | −0.16 | −0.12 |
| A25 | −0.31 | −0.29 | −0.34 | −0.35 | −0.35 | −0.31 | −0.25 | −0.33 | −0.33 | −0.34 | −0.30 | −0.26 | −0.33 | −0.31 | −0.34 |
| A26 | −0.32 | −0.20 | −0.34 | −0.34 | −0.36 | −0.32 | −0.17 | −0.34 | −0.33 | −0.35 | −0.32 | −0.18 | −0.33 | −0.33 | −0.34 |
| A27 | −0.34 | −0.33 | −0.32 | −0.31 | −0.34 | −0.34 | −0.34 | −0.33 | −0.30 | −0.32 | −0.34 | −0.34 | −0.30 | −0.29 | −0.31 |
| A28 | −0.30 | −0.32 | −0.17 | −0.18 | −0.17 | −0.31 | −0.31 | −0.16 | −0.18 | −0.16 | −0.31 | −0.32 | −0.24 | −0.21 | −0.14 |
| A29 | −0.33 | −0.34 | −0.34 | −0.35 | −0.33 | −0.34 | −0.34 | −0.33 | −0.34 | −0.33 | −0.33 | −0.33 | −0.31 | −0.34 | −0.34 |
| Alternatives | 2021 | 2022 | 2023 | ||||||||||||
|---|---|---|---|---|---|---|---|---|---|---|---|---|---|---|---|
| C1 | C2 | C3 | C4 | C5 | C1 | C2 | C3 | C4 | C5 | C1 | C2 | C3 | C4 | C5 | |
| A1 | −0.33 | −0.34 | −0.33 | −0.34 | −0.34 | −0.33 | −0.34 | −0.33 | −0.34 | −0.34 | −0.33 | −0.34 | −0.33 | −0.34 | −0.34 |
| A2 | −0.31 | −0.34 | −0.27 | −0.27 | −0.28 | −0.31 | −0.34 | −0.27 | −0.29 | −0.27 | −0.31 | −0.34 | −0.26 | −0.28 | −0.27 |
| A3 | −0.29 | −0.29 | −0.33 | −0.30 | −0.33 | −0.29 | −0.28 | −0.33 | −0.28 | −0.33 | −0.29 | −0.31 | −0.33 | −0.32 | −0.33 |
| A4 | −0.26 | −0.22 | −0.30 | −0.27 | −0.26 | −0.25 | −0.25 | −0.31 | −0.29 | −0.27 | −0.26 | −0.20 | −0.31 | −0.28 | −0.28 |
| A5 | −0.30 | −0.25 | −0.33 | −0.33 | −0.31 | −0.28 | −0.21 | −0.33 | −0.32 | −0.31 | −0.30 | −0.20 | −0.33 | −0.33 | −0.31 |
| A6 | −0.31 | −0.34 | −0.30 | −0.34 | −0.33 | −0.32 | −0.33 | −0.29 | −0.34 | −0.33 | −0.32 | −0.31 | −0.29 | −0.34 | −0.33 |
| A7 | −0.28 | −0.29 | −0.27 | −0.34 | −0.32 | −0.30 | −0.30 | −0.29 | −0.34 | −0.32 | −0.30 | −0.29 | −0.27 | −0.34 | −0.33 |
| A8 | −0.24 | −0.20 | −0.30 | −0.27 | −0.27 | −0.25 | −0.30 | −0.29 | −0.28 | −0.27 | −0.24 | −0.28 | −0.32 | −0.27 | −0.29 |
| A9 | −0.32 | −0.33 | −0.33 | −0.30 | −0.34 | −0.32 | −0.33 | −0.33 | −0.31 | −0.34 | −0.32 | −0.33 | −0.33 | −0.31 | −0.34 |
| A10 | −0.34 | −0.32 | −0.33 | −0.34 | −0.33 | −0.34 | −0.31 | −0.33 | −0.33 | −0.33 | −0.34 | −0.33 | −0.33 | −0.33 | −0.33 |
| A11 | −0.32 | −0.34 | −0.33 | −0.33 | −0.32 | −0.32 | −0.32 | −0.33 | −0.32 | −0.32 | −0.31 | −0.31 | −0.33 | −0.31 | −0.32 |
| A12 | −0.33 | −0.35 | −0.33 | −0.32 | −0.34 | −0.32 | −0.33 | −0.32 | −0.32 | −0.34 | −0.33 | −0.35 | −0.33 | −0.33 | −0.34 |
| A13 | −0.31 | −0.28 | −0.26 | −0.33 | −0.29 | −0.30 | −0.16 | −0.28 | −0.32 | −0.29 | −0.31 | −0.16 | −0.28 | −0.32 | −0.29 |
| A14 | −0.30 | −0.33 | −0.19 | −0.27 | −0.30 | −0.28 | −0.22 | −0.19 | −0.27 | −0.30 | −0.28 | −0.21 | −0.19 | −0.26 | −0.30 |
| A15 | −0.32 | −0.32 | −0.33 | −0.33 | −0.33 | −0.32 | −0.34 | −0.32 | −0.33 | −0.33 | −0.33 | −0.34 | −0.33 | −0.33 | −0.32 |
| A16 | −0.31 | −0.32 | −0.30 | −0.31 | −0.31 | −0.32 | −0.32 | −0.30 | −0.31 | −0.31 | −0.32 | −0.34 | −0.29 | −0.31 | −0.32 |
| A17 | −0.32 | −0.34 | −0.33 | −0.33 | −0.27 | −0.31 | −0.30 | −0.33 | −0.31 | −0.29 | −0.31 | −0.27 | −0.33 | −0.31 | −0.29 |
| A18 | −0.32 | −0.34 | −0.31 | −0.30 | −0.19 | −0.32 | −0.34 | −0.31 | −0.30 | −0.23 | −0.32 | −0.34 | −0.31 | −0.29 | −0.22 |
| A19 | −0.29 | −0.27 | −0.27 | −0.31 | −0.19 | −0.31 | −0.34 | −0.26 | −0.32 | −0.25 | −0.30 | −0.34 | −0.25 | −0.29 | −0.27 |
| A20 | −0.30 | −0.24 | −0.32 | −0.30 | −0.33 | −0.30 | −0.28 | −0.32 | −0.29 | −0.32 | −0.29 | −0.28 | −0.33 | −0.30 | −0.28 |
| A21 | −0.33 | −0.29 | −0.33 | −0.27 | −0.31 | −0.33 | −0.33 | −0.32 | −0.27 | −0.32 | −0.32 | −0.32 | −0.28 | −0.29 | −0.32 |
| A22 | −0.32 | −0.09 | −0.30 | −0.33 | −0.32 | −0.32 | −0.09 | −0.30 | −0.33 | −0.33 | −0.32 | −0.09 | −0.30 | −0.33 | −0.33 |
| A23 | −0.33 | −0.33 | −0.33 | −0.31 | −0.34 | −0.34 | −0.34 | −0.33 | −0.32 | −0.34 | −0.34 | −0.34 | −0.33 | −0.34 | −0.34 |
| A24 | −0.28 | −0.32 | −0.30 | −0.19 | −0.17 | −0.27 | −0.32 | −0.33 | −0.28 | −0.17 | −0.29 | −0.30 | −0.33 | −0.30 | −0.27 |
| A25 | −0.31 | −0.33 | −0.32 | −0.30 | −0.33 | −0.31 | −0.31 | −0.33 | −0.31 | −0.33 | −0.31 | −0.31 | −0.33 | −0.30 | −0.33 |
| A26 | −0.31 | −0.17 | −0.33 | −0.33 | −0.34 | −0.32 | −0.16 | −0.33 | −0.32 | −0.34 | −0.32 | −0.24 | −0.33 | −0.32 | −0.29 |
| A27 | −0.34 | −0.34 | −0.33 | −0.29 | −0.31 | −0.34 | −0.33 | −0.33 | −0.29 | −0.30 | −0.34 | −0.33 | −0.33 | −0.29 | −0.30 |
| A28 | −0.30 | −0.30 | −0.23 | −0.26 | −0.12 | −0.29 | −0.30 | −0.27 | −0.30 | −0.13 | −0.28 | −0.31 | −0.27 | −0.29 | −0.18 |
| A29 | −0.32 | −0.28 | −0.30 | −0.33 | −0.34 | −0.33 | −0.34 | −0.29 | −0.33 | −0.34 | −0.32 | −0.33 | −0.27 | −0.33 | −0.34 |
Table 4 presents the positive (V+) and negative (V−) ideal solutions for OECD banks (Formula 5), derived from entropy-weighted and normalized ESG indicators (C1–C5) (Formula 4). This approach reflects the relative importance of each ESG dimension and provides an objective assessment of ESG competitiveness.
The ideal benchmarks indicate that top performers achieve strong results in ESG, shareholder, and CSR strategy scores (C1–C3), alongside lower emissions and resource use (C4–C5) (Yuen et al., 2022), whereas underperformers exhibit weaker ESG integration and higher environmental impacts (Elamer & Boulhaga, 2024). These findings highlight the need to improve environmental efficiency and sustainability management in the knowledge economy.
Table 5 reports the positive (Sᵢ+) and negative (Sᵢ−) distances (Formula 6) and the relative closeness (Cᵢ) derived from the TOPSIS method (Formula 7). The Austrian bank (A2) achieves the highest score (0.65), indicating strong ESG alignment and sustainability management (Menicucci & Paolucci, 2023), whereas the Portuguese bank (A22) records the lowest (0.34), reflecting weaker ESG integration (Dadabada, 2025). These disparities highlight the need for region-specific sustainability strategies to enhance competitiveness in the knowledge economy.
Table 5.
The closeness coefficient s+, s− and rank
| Alternatives | Si+ | Si− | Ci | Rank | Alternatives | Si+ | Si− | Ci | Rank |
|---|---|---|---|---|---|---|---|---|---|
| A1 | 0.02 | 0.02 | 0.54 | 12 | A16 | 0.02 | 0.02 | 0.55 | 10 |
| A2 | 0.01 | 0.02 | 0.65 | 1 | A17 | 0.02 | 0.02 | 0.58 | 8 |
| A3 | 0.02 | 0.02 | 0.49 | 19 | A18 | 0.01 | 0.02 | 0.63 | 2 |
| A4 | 0.02 | 0.02 | 0.48 | 20 | A19 | 0.01 | 0.02 | 0.59 | 7 |
| A5 | 0.02 | 0.02 | 0.50 | 17 | A20 | 0.02 | 0.02 | 0.46 | 24 |
| A6 | 0.02 | 0.02 | 0.44 | 25 | A21 | 0.01 | 0.02 | 0.60 | 6 |
| A7 | 0.02 | 0.01 | 0.41 | 27 | A22 | 0.03 | 0.01 | 0.34 | 29 |
| A8 | 0.02 | 0.02 | 0.47 | 22 | A23 | 0.02 | 0.02 | 0.55 | 11 |
| A9 | 0.02 | 0.02 | 0.52 | 15 | A24 | 0.02 | 0.02 | 0.60 | 5 |
| A10 | 0.02 | 0.02 | 0.52 | 14 | A25 | 0.02 | 0.02 | 0.47 | 23 |
| A11 | 0.02 | 0.02 | 0.55 | 9 | A26 | 0.02 | 0.02 | 0.39 | 28 |
| A12 | 0.02 | 0.02 | 0.53 | 13 | A27 | 0.01 | 0.02 | 0.61 | 4 |
| A13 | 0.02 | 0.01 | 0.42 | 26 | A28 | 0.01 | 0.02 | 0.62 | 3 |
| A14 | 0.02 | 0.02 | 0.48 | 21 | A29 | 0.02 | 0.02 | 0.49 | 18 |
| A15 | 0.02 | 0.02 | 0.52 | 16 |
The robustness of the ranking results was evaluated using Monte Carlo simulation and bootstrap resampling (Table 6). The Monte Carlo weight-perturbation analysis indicated strong stability, with a high average Spearman correlation (ρ = 0.9764) and low rank variability (1.6137); the top-ranked bank consistently retained its position across all 1,000 simulations.
Table 6.
Robustness check and sensitivity analyses
| Method | Metric | Result | Interpretation |
|---|---|---|---|
| Monte Carlo | Avg. Spearman ρ vs. Initial | 0.9764 | Higher values indicate stronger agreement between initial and perturbed rankings. |
| Monte Carlo | Rank Variability (Avg. Std Dev) | 1.6137 | Lower values indicate more stable ranks across perturbations. |
| Monte Carlo | Max First-Place Frequency | 1000 | Indicates the highest frequency a company achieved rank 1. |
| Bootstrap | Avg. Spearman ρ vs. Initial | 0.9685 | Higher values indicate stronger agreement between initial and resampled rankings. |
| Bootstrap | Rank Variability (Avg. Std Dev) | 2.0209 | Lower values indicate more stable ranks across perturbations. |
| Bootstrap | Max First-Place Frequency | 975 | Indicates the highest frequency a company achieved rank 1. |
Bootstrap resampling further confirmed reliability, yielding a high average Spearman correlation (ρ = 0.9685) and low rank variability (2.0209), with the top-ranked bank remaining first in 975 out of 1,000 samples. Additionally, a t-test produced a nonsignificant result (p = 1), indicating no meaningful difference between the original and modified data.
These findings provide strong evidence of the robustness, stability, and low sensitivity of the ESG-based competitiveness rankings to weighting assumptions. The overall rankings are presented in Figure 3.
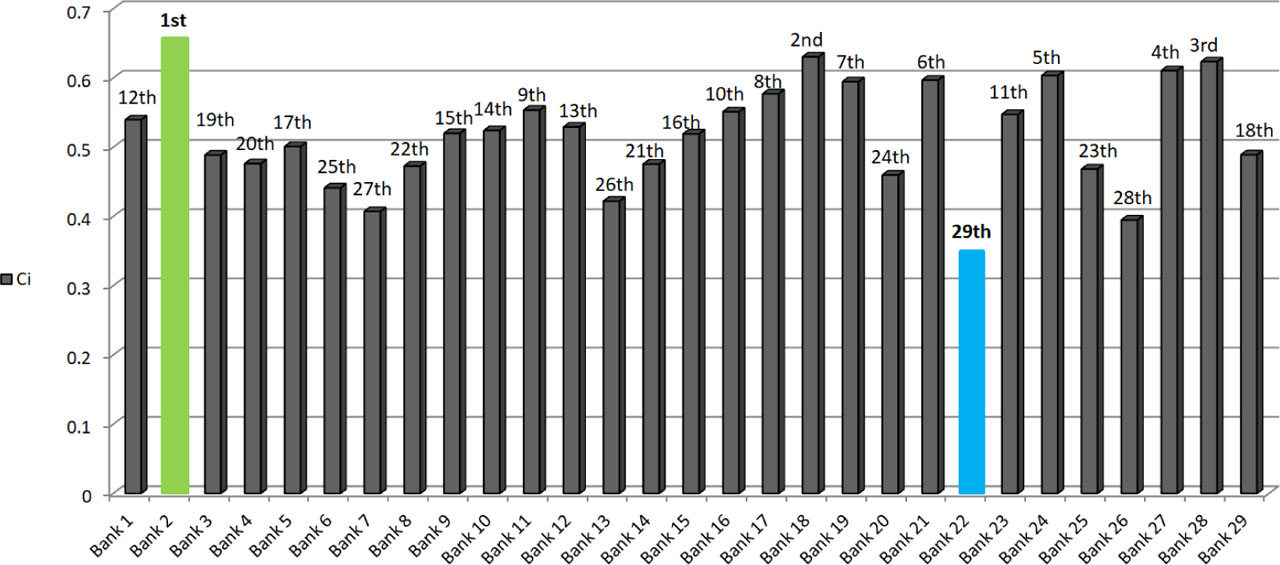
Figure 3.
Overall ranking of top bank in OECD countries
Source: own processing
Figure 4 compares Austrian and Portuguese banks across ESG dimensions (C1–C5). The Austrian bank demonstrates weaker social and governance performance within ESG (C1) despite strong environmental practices, whereas the Portuguese bank benefits from stronger social engagement. In Shareholder Score (C2), Austria exhibits stronger governance and shareholder alignment, while Portugal is constrained by fragmented ownership. In CSR Strategy (C3), the Austrian bank emphasizes environmental initiatives but shows weaker community engagement, whereas the Portuguese bank performs better in socially oriented CSR. In Emissions (C4) and Resource Use (C5), the Austrian bank leads due to proactive environmental policies and advanced infrastructure, while the Portuguese bank lags because of structural and regulatory constraints.
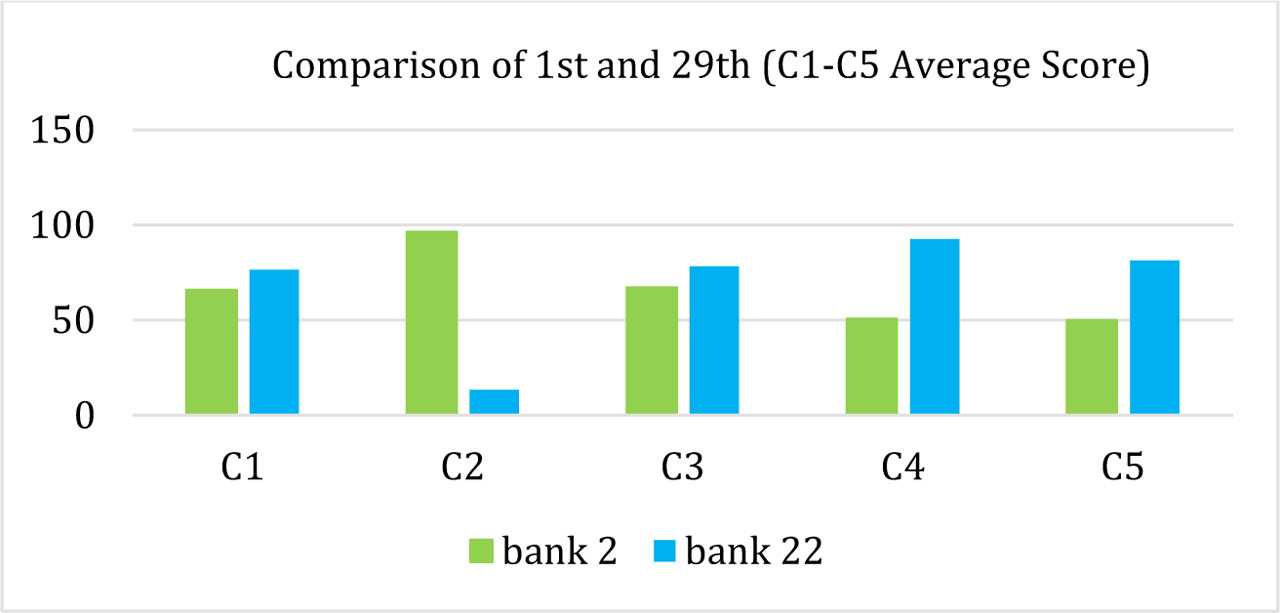
Figure 4.
Average score comparison of the top rank and the lowest rank bank in OECD countries. Note. C4 and C5: Lower scores indicate better performance
Source: own processing
These differences highlight contrasting sustainability approaches and their implications for ESG-driven competitiveness in the knowledge economy.
Figure 5 illustrates the evolving competitiveness of Austrian and Portuguese banks from 2018 to 2023 across five sustainability dimensions (C1–C5), highlighting distinct regional trajectories. In ESG Score (C1), the Austrian bank shows steady improvement, peaking in 2023, reflecting effective ESG integration under regulatory reform, whereas the Portuguese bank performs strongly in social metrics, peaking in 2022. In Shareholder Score (C2), the Austrian bank demonstrates governance maturity, reaching a 2023 peak, while the Portuguese bank shows gradual improvement despite structural constraints. In CSR Strategy (C3), the Austrian bank exhibits a consistent, regulation-driven approach, whereas the Portuguese bank displays a more socially oriented but less integrated strategy. In Emissions (C4) and Resource Use (C5), the Austrian bank leads, supported by early green finance adoption and strong regulatory frameworks, while the Portuguese bank lags due to slower structural and policy development, despite recent progress.
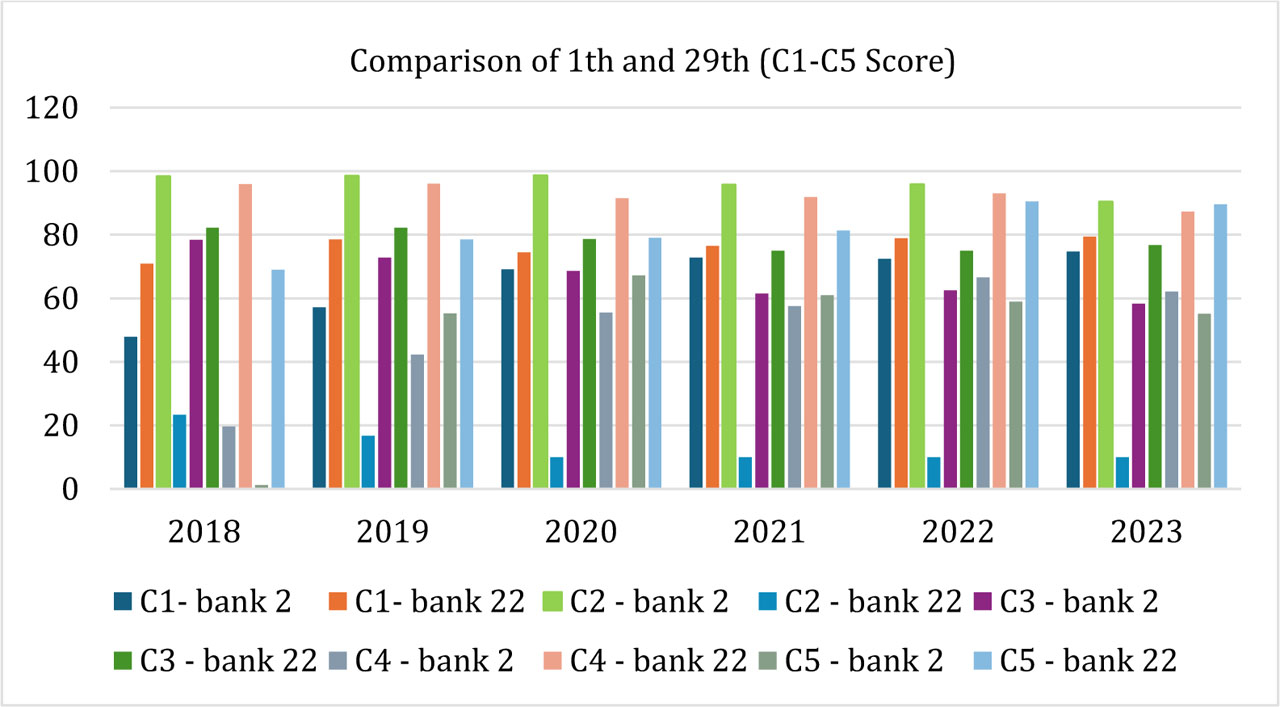
Figure 5.
Comparison of the top rank and the lowest rank of OECD countries
Source: own processing
Overall, these patterns reveal distinct regional sustainability pathways and their implications for competitiveness in the knowledge economy.
Conclusions and future directions
This study provides a comprehensive assessment of ESG performance within the OECD banking sector, demonstrating that disaggregated indicators, particularly shareholder score (C2), emissions score (C4), and resource use score (C5), offer more precise insights into sustainability management and competitiveness than aggregated ESG measures. The findings confirm that targeted governance and environmental practices are closely associated with improved institutional performance, supporting evidence from prior research (Horobet et al., 2025). Rather than relying solely on composite ESG indicators, the results emphasize the importance of criterion-specific evaluations that reflect differences in institutional contexts and regulatory environments across OECD countries. Although aggregated ESG (C1) and CSR strategy (C3) indicators remain important, they do not consistently correlate with higher competitiveness across all regions. Instead, the analysis reveals that shareholder engagement, emissions control, and resource efficiency exert stronger and more direct influences on ESG-driven competitiveness. Simultaneously, the results confirm that robust ESG disclosures and CSR strategies continue to play essential roles in enhancing banking performance and stakeholder trust (Lamanda & Tamásné Vőneki, 2024). Overall, the findings reinforce the theoretical foundations of sustainable development and stakeholder-oriented value creation, demonstrating that long-term competitiveness in the knowledge economy is better captured through dimension-specific ESG capabilities.
Strategic implications for policymakers
The results offer valuable insights for policymakers aiming to enhance sustainable finance and ESG-driven competitiveness within the OECD banking sector. Regulatory authorities should move beyond aggregated ESG indicators and promote criterion-specific sustainability frameworks, particularly focusing on governance, emissions, and resource management. Given the observed regional disparities, policymakers in organizations such as the OECD and the United Nations should develop region-sensitive ESG policies that account for differences in institutional capacity, economic structure, and environmental priorities. These approaches can foster more balanced and effective sustainability management across diverse banking systems.
Implications for businesses
For banking institutions, the findings underscore the strategic importance of focusing on specific ESG dimensions to enhance competitiveness. Managers should prioritize improvements in shareholder alignment, emissions reduction, and resource efficiency, as these areas exhibit stronger correlations with performance outcomes. The comparative analysis also reveals that banks in different regions excel in distinct ESG dimensions, indicating that peer benchmarking and context-specific sustainability strategies can help institutions strengthen weaker areas without compromising their core strengths. These insights support more informed, knowledge-based strategic decision-making within the banking sector.
Implications for researchers
This study contributes a knowledge-oriented, data-driven framework for evaluating ESGbased competitiveness across countries in academic research. By integrating the entropy–TOPSIS method, it provides an objective approach to weighting ESG criteria and ranking institutions according to their relative sustainability performance. This methodological contribution supports future research on sustainable finance, ESG performance, and competitiveness within the knowledge economy, especially in cross-country and multi-industry contexts.
Limitations and future directions
Several limitations should be acknowledged. First, the study focuses exclusively on the OECD banking sector, which may limit the generalizability of the findings to emerging or non-OECD economies. Future research could extend the analysis to include a broader range of countries and financial systems. Second, data availability varies across some OECD countries, and the selected ESG indicators may not fully capture the complexity of sustainability practices. Third, the analysis covers a six-year period ending in 2023; future studies could incorporate longer time horizons to better capture structural trends.
Finally, the study employs the entropy-TOPSIS approach, which, although objective and transparent, represents only one methodological perspective. Future research could apply alternative techniques, such as machine learning, panel econometric models, or longitudinal analyses, to further investigate ESG-driven competitiveness. Expanding methodological diversity would provide deeper insights into the evolving dynamics of sustainable finance within the knowledge economy.
Acknowledgements:
The researchers extend sincere appreciation to the National Cheng Kung University (NCKU) Library for granting access to its comprehensive database resources (Refinitiv). The availability of these data repositories was instrumental in facilitating the collection, verification, and analysis of the financial and institutional information used in this study. The support provided by the NCKU Library significantly enhanced the rigor and credibility of the research findings.
Appendices
Appendix
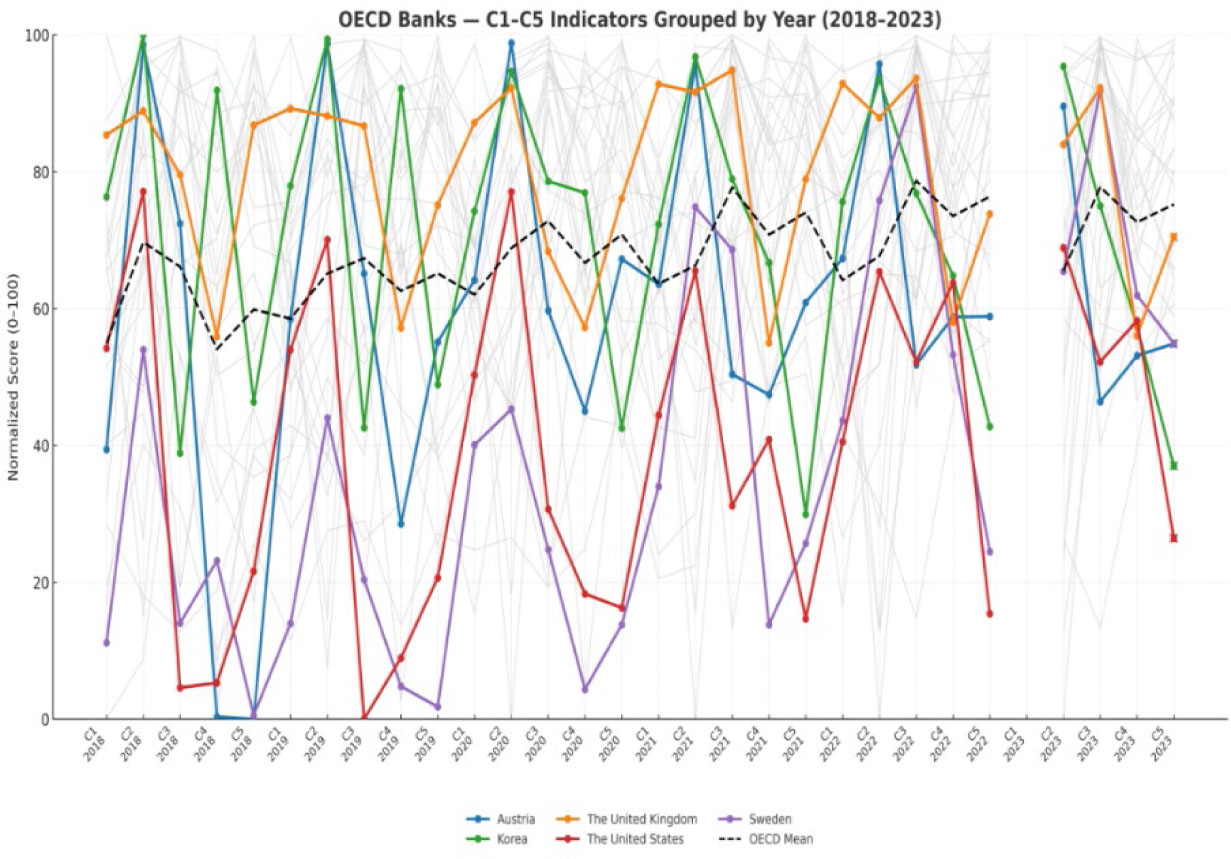
Figure A1.
OECD Bank ESG Score
Source: own processing