
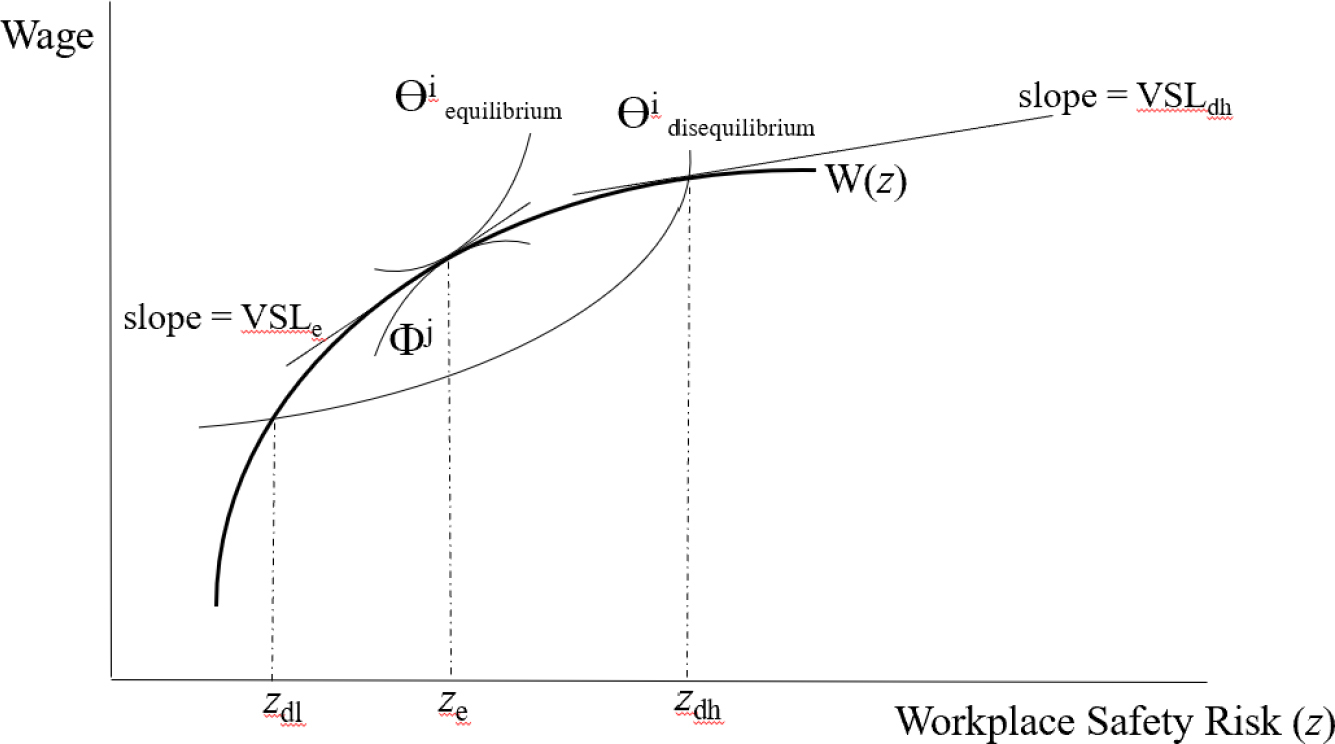
Figure 1.
Hedonic Labor Market Equilibrium and Disequilibrium
Table I.
Worker Welfare Comparisons Between Equilibrium and Disequilibrium, Derived from VSL and Expressed per Statistical Fatality (2001 dollars)
| (ii) | (iii) | (iv) | (v) | (vi) | (vii) | (viii) | (ix) | ||
|---|---|---|---|---|---|---|---|---|---|
| (a) | VSL for Occupation-or Industry-Switchers a | $6.1 million | $7 million | $8.8 million | $10 million | ||||
| (b) | Switcher and Non-Switcher Weighted Average VSL b | $4.4 million | $5.1 million | $4.8 million | $5.5 million | ||||
| (c) | Short-Run VSL c | $5.8 M | $6.6 M | $8.2 M | $8.6 M | $6.7 M | $7.6 M | $9.5 M | $9.8 M |
| (d) | Long-Run VSL c | $6.2 M | $7.6 M | $9.2 M | $10.4 M | $7.2 M | $8.7 M | $10.5 M | $12 M |
| (e) | In Year 0, Disequilibrium-vs-Equilibrium Worker Welfare Harm (per Statistical Fatality): (f) + [(d)-(c)] | $2.5 M | $3.7 M | $3.9M | $5.5 M | $5.0 M | $6.2 M | $6.5 M | $8.9 M |
| (f) | In Year 2: (g) + [(d)-(c)] | $2.1 M | $2.7 M | $2.9 M | $3.7 M | $4.5 M | $5.1 M | $5.5 M | $6.7 M |
| (g) | In Year 4: (a) – (b) | $1.7 M | $1.7 M | $1.9 M | $1.9 M | $4.0 M | $4.0 M | $4.5 M | $4.5 M |
| (h) | In Year 6: (g) – [(d)-(c)] | $1.3 M | $0.7 M | $0.9 M | $0.1 M | $3.5 M | $2.9 M | $3.5 M | $2.3 M |
| (i) | In Year 8: (h) – [(d)-(c)] | $0.9 M | FWI | FWI | FWI | $3.0 M | $1.8 M | $2.5 M | $0.1 M |
| (j) | In Year 10: (i) – [(d)-(c)] | $0.5 M | $2.5 M | $0.7 M | $1.5 M | FWI | |||
| (k) | In Year 12: (j) – [(d)-(c)] | $0.1 M | $2.0 M | FWI | $0.5 M | ||||
| (l) | In Year 14: (k) – [(d)-(c)] | FWI | $1.5 M | FWI | |||||
| (m) | In Year 16: (l) – [(d)-(c)] | $1.0 M | |||||||
| (n) | In Year 18: (m) – [(d)-(c)] | $0.5 M | |||||||
| (o) | In Year 20: (n) – [(d)-(c)] | FWI | |||||||
1a Source: Kniesner et al. (2012) Table 4 (various exploratory specifications).
1b Source: Author calculations using Kniesner et al. (2012) Table 4.
1c Source: Kniesner et al. (2012) Table 6.
Table II.
Employment-Related Welfare Effects
| (ii) | (iii) | (iv) | (v) | (vi) | (vii) | (viii) | (ix) | |
|---|---|---|---|---|---|---|---|---|
| Friction cost of job risk (could be avoided with voluntary unemployment), derived from Table I, * | $830 | $850 | $930 | $1,120 | $2,270 | $1,940 | $2,290 | $2,240 |
| Friction cost of job loss, per Kuminoff et al.’s (2015) Table 1, panel C | Expansion | Normal Conditions | Recession | |||||
| Rehired at identical job after temporary layoff | $1,230 | $1,620 | $2,490 | |||||
| Layoff leads to worker moving house | $7,000 | $7,300 | $7,950 | |||||
1* Other inputs: fatality risk of 6.415 × 10⁻⁵ (per Kniesner et al., 2012); 7% discount rate (for comparability with Kuminoff et al., 2015); linear interpolation between rows (e) and (f), (f) and (g), etc., of Table I. Non-fatal short-term risks and occupational exposure to fatal and non-fatal long-term health hazards introduce uncertainty into the estimates; the probable consequence, especially for the leftmost columns, is a tendency toward underestimation.