
Table 1.
Genes and primers used for RT-qPCR analysis of cytokine genes expressed in mastitic udder quarters and adjacent healthy quarters sampled post slaughter from Polish Holstein-Friesian cows between the first and fourth lactation
| Gene symbol and GenBank accession No. | Primer sequences (5′–3′) | Melting temp. (°C) | Annealing temp. (°C) | Source |
|---|---|---|---|---|
| IL1A NM_174092 | F: ATGAGCCACTTCGTGAGGAC R: GCTTCCAGGTCATCATCGGT | 53.8 53.8 | 50 | Primer-BLAST |
| IL1B NM_174093 | F: AGACCCCAAAGTCTACCCCA R: GTCCTCGGGGTTATTCAGCC | 53.8 55.9 | 52 | Primer-BLAST |
| IL2 NM_180997 | F: GCTCTACGGGGAACACAATG R: CATCCTGGAGAGCTTGAGGT | 53.8 53.8 | 50 | Primer-BLAST |
| IL6 NM_173923 | F: TCCAGAACGAGTATGAGG R: CATCCGAATAGCTCTCAG | 48.0 48.0 | 45 | (31) |
| IL8 JN559767 | F: GACTTCCAAGCTGGCTGTTG R: TTTGGGGTGGAAAGGTGTGG | 53.8 53.8 | 50 | Primer-BLAST |
| IL12A NM_174355 | F: ACAACCCTGTGCCTTAGAAGT R: TGCCAGCATGTTCTGGTCTA | 52.4 51.8 | 49 | (49) |
| IL12B NM_174356 | F: ACCAGAGCAGTGAGGTCTTG R: GAGTGAACGACTCAGAGCCT | 53.8 53.8 | 50 | (49) |
| IL18 NM_174091 | F: CAGATAATGCACCCCAGACCA R: TACGGCCAGACCTCTAGTGA | 54.4 53.8 | 51 | Primer-BLAST |
| TNF NM_173966 | F: GAAGTTGCTTGTGCCTCAGC R: AACCAGAGGGCTGTTGATGG | 53.8 53.8 | 50 | Primer-BLAST |
| CXCL5 NM_174300 | F: TGAGACTGCTATCCAGCCG R: AGATCACTGACCGTTTTGGG | 53.2 51.8 | 50 | (20) |
| GROα U95812 | F: CCAGAGCGTGAAGGTGACAA R: TAAACACAGTCCAGATGGCCC | 53.8 54.4 | 51 | Primer-BLAST |
| GAPDH NM_001034034 | F: ACCACTTTGGCATCGTGGAG R: GGGCCATCCACAGTCTTCTG | 53.8 55.9 | 50 | (30) |
| HPRT1 NM_001034035.2 | F: TGCTGAGGATTTGGAGAAGG R: CAACAGGTCGGCAAAGAACT | 51.8 51.8 | 48 | (30) |
Table 2.
Levene’s test for homogeneity of variance in log-transformed data for cytokine expression in mastitic udder quarters and adjacent healthy quarters sampled post slaughter from Polish Holstein-Friesian cows between the first and fourth lactation
| Gene symbol | F statistic | P-value | Protein name | Result | F statistic | P-value | Result |
|---|---|---|---|---|---|---|---|
| IL1A | 0.55 | 0.7010 | IL-1α | Homogeneous | 0.85 | 0.5040 | Homogeneous |
| IL1B | 4.60 | 0.0040 | IL-1β | Heterogeneous | 0.37 | 0.8258 | Homogeneous |
| IL2 | 1.97 | 0.1197 | IL-2 | Homogeneous | 2.56 | 0.0590 | Homogeneous |
| IL6 | 3.35 | 0.0191 | IL-6 | Heterogeneous | 3.03 | 0.0356 | Heterogeneous |
| IL8 | 2.30 | 0.0777 | IL-8 | Homogeneous | 2.63 | 0.0556 | Homogeneous |
| IL12A | 5.06 | 0.0024 | IL-12α | Heterogeneous | 0.37 | 0.8287 | Homogeneous |
| IL12B | 4.52 | 0.0040 | IL-12β | Heterogeneous | 1.03 | 0.4080 | Homogeneous |
| IL18 | 3.82 | 0.0103 | IL-18 | Heterogeneous | 1.90 | 0.1370 | Homogeneous |
| TNF | 5.13 | 0.0022 | TNF-α | Heterogeneous | 0.79 | 0.5409 | Homogeneous |
| CXCL5 | 0.62 | 0.6496 | CXCL5 | Homogeneous | 5.53 | 0.0020 | Heterogeneous |
| GROα | 2.44 | 0.0636 | GROα | Homogeneous | 0.90 | 0.4766 | Homogeneous |
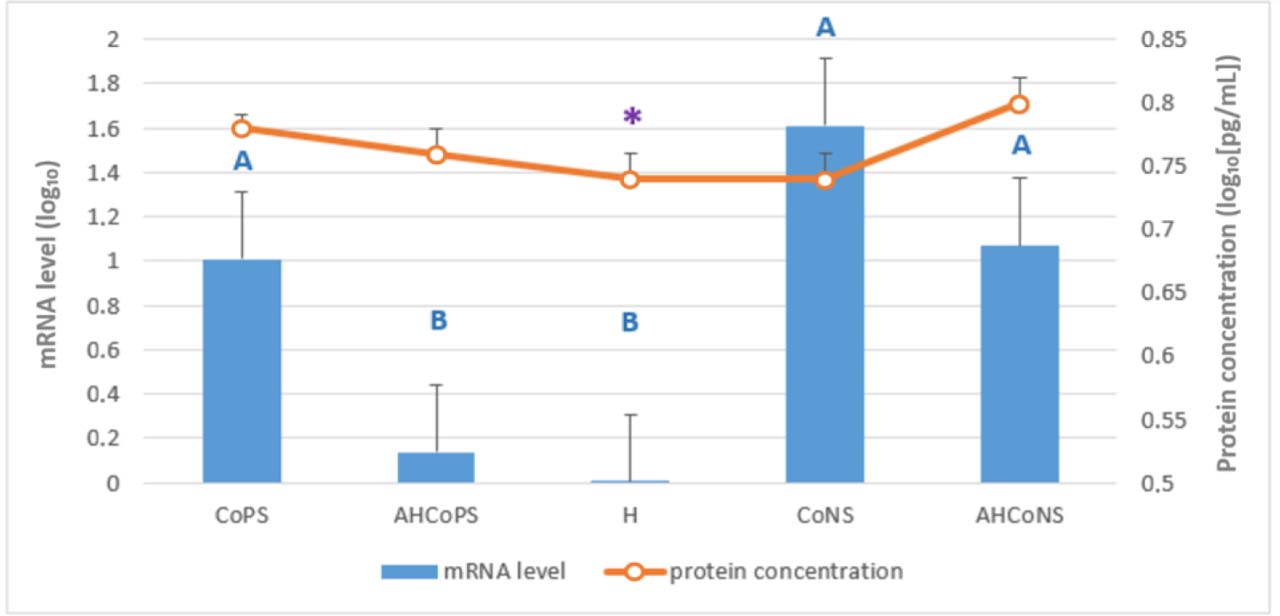
Fig. 1.
Least-squares means estimated from the final linear mixed-effects model for relative mRNA levels of the IL1A gene (bars) and IL-1α protein concentration determined by ELISA (line), both log10-transformed. Tissue was analysed which had been sampled post slaughter from Polish Holstein-Friesian cows between the first and fourth lactation. CoPS – quarters infected with coagulase-positive staphylococci; AHCoPS – healthy quarters adjacent to one infected with CoPS; H – quarters taken from udders healthy in all quarters; CoNS – quarters infected with coagulase-negative staphylococci; AHCoNS – healthy quarters adjacent to one infected with CoNS; * – statistically significant within-group correlation between mRNA and protein levels (Spearman’s rank correlation, P-value ≤ 0.05); A and B – different uppercase letters indicate statistically significant differences between groups (P-value ≤ 0.01)
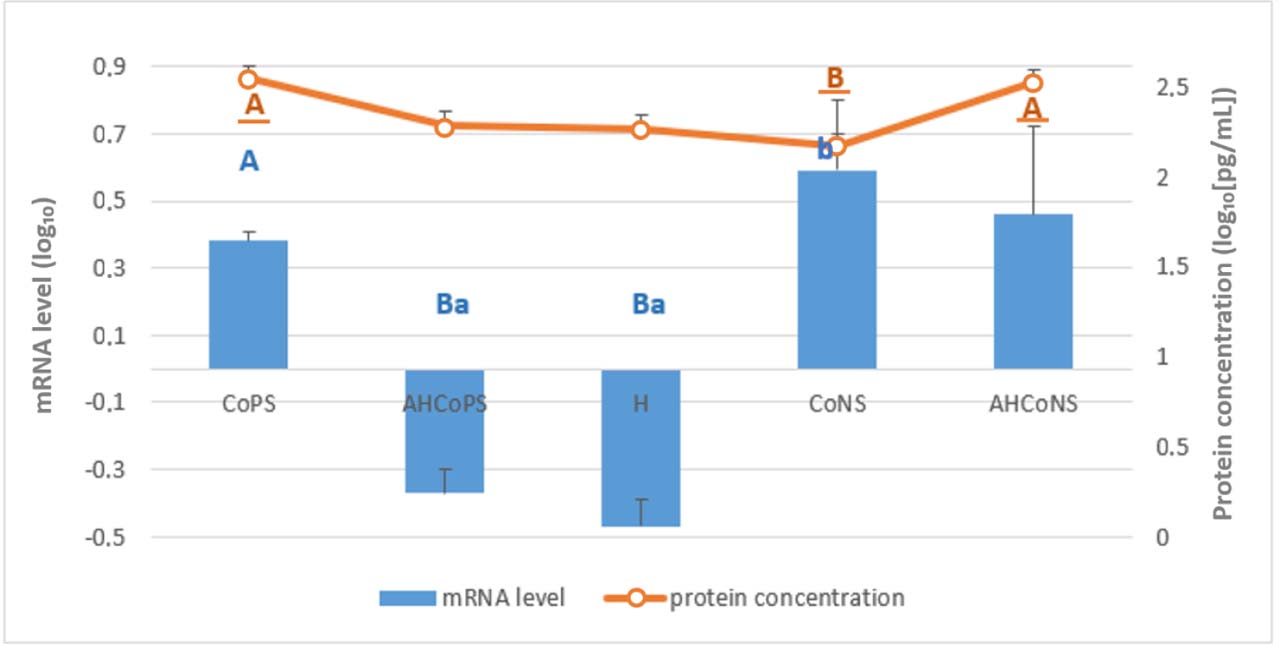
Fig. 2.
Least-squares means estimated from the final linear mixed-effects model for relative mRNA levels of the IL1B gene (bars) and IL-1β protein concentration determined by ELISA (line), both log10-transformed. Tissue was analysed which had been sampled post slaughter from Polish Holstein-Friesian cows between the first and fourth lactation. CoPS – quarters infected with coagulase-positive staphylococci; AHCoPS – healthy quarters adjacent to one infected with CoPS; H – quarters taken from udders healthy in all quarters; CoNS – quarters infected with coagulase-negative staphylococci; AHCoNS – healthy quarters adjacent to one infected with CoNS; A and B – different upper-case letters indicate statistically significant differences between groups (P-value ≤ 0.01); a and b – different lower-case letters indicate statistically significant differences between groups (P-value ≤ 0.05); non-underlined letters – mRNA-level differences; underlined letters – protein-concentration differences
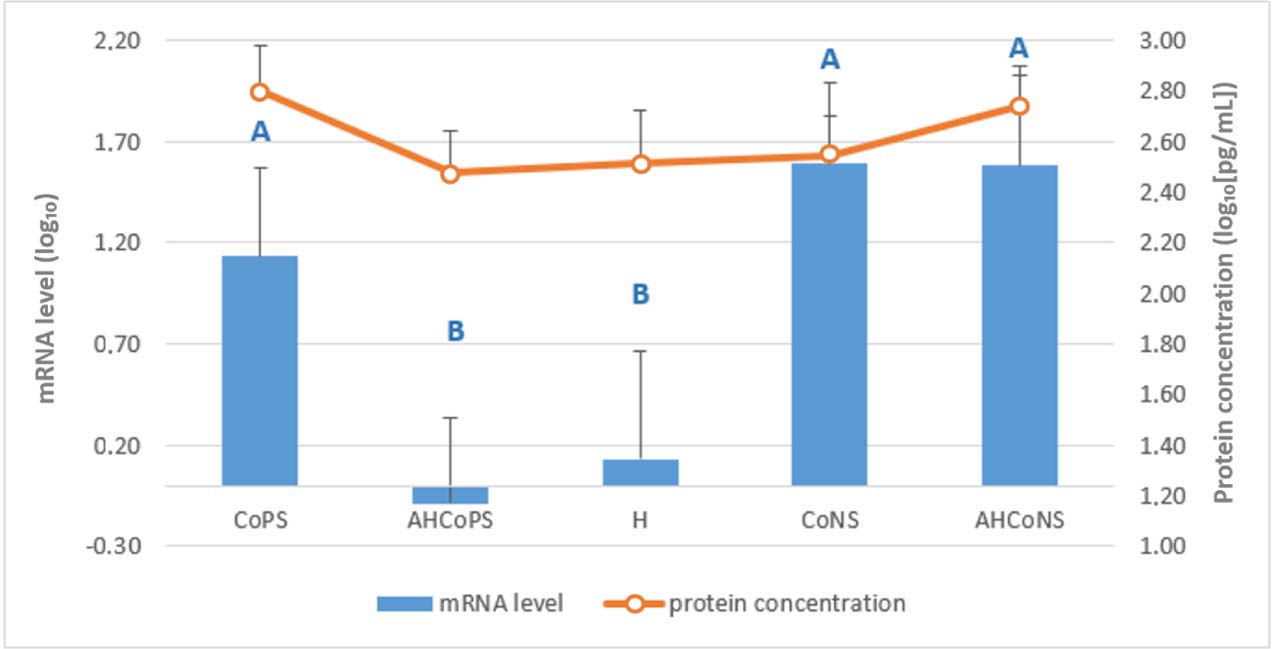
Fig. 3.
Least-squares means estimated from the final linear mixed-effects model for relative mRNA levels of the IL2 gene (bars) and IL-2 protein concentration determined by ELISA (line), both log10-transformed. Tissue was analysed which had been sampled post slaughter from Polish Holstein-Friesian cows between the first and fourth lactation. CoPS – quarters infected with coagulase-positive staphylococci; AHCoPS – healthy quarters adjacent to one infected with CoPS; H – quarters taken from udders healthy in all quarters; CoNS – quarters infected with coagulase-negative staphylococci; AHCoNS – healthy quarters adjacent to one infected with CoNS; A and B – different upper-case letters indicate statistically significant differences between groups (P-value ≤ 0.01)
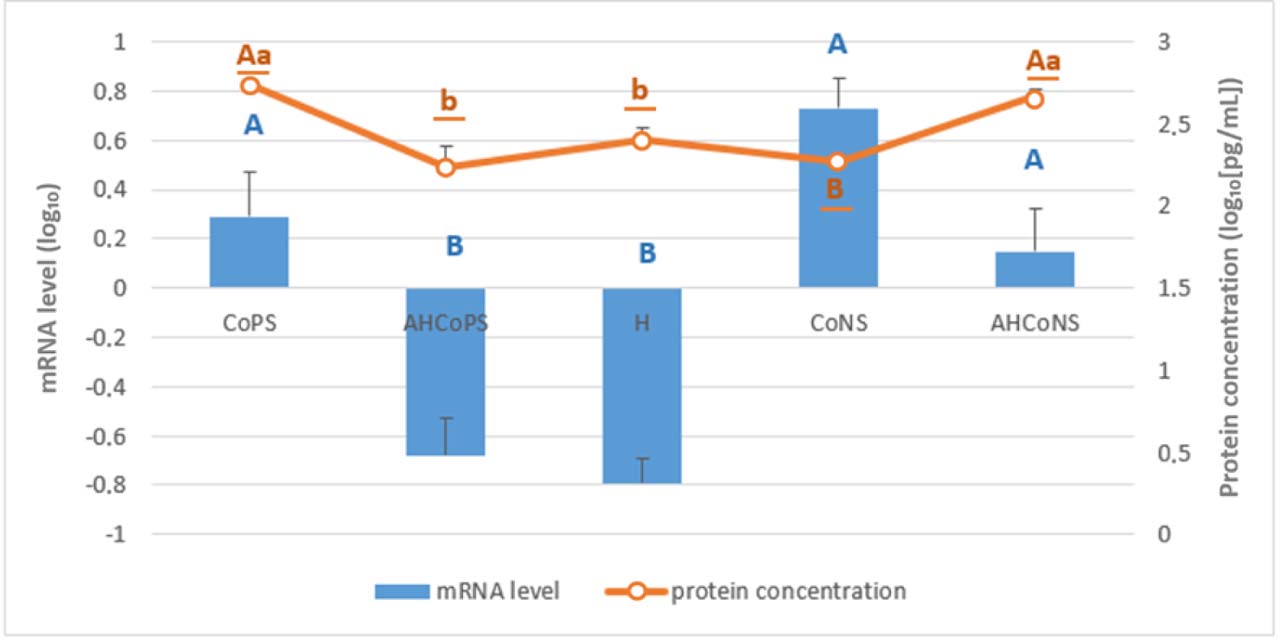
Fig. 4.
Least-squares means estimated from the final linear mixed-effects model for relative mRNA levels of the IL6 gene (bars) and IL-6 protein concentration determined by ELISA (line), both log10-transformed. Tissue was analysed which had been sampled post slaughter from Polish Holstein-Friesian cows between the first and fourth lactation. CoPS – quarters infected with coagulase-positive staphylococci; AHCoPS – healthy quarters adjacent to one infected with CoPS; H – quarters taken from udders healthy in all quarters; CoNS – quarters infected with coagulase-negative staphylococci; AHCoNS – healthy quarters adjacent to one infected with CoNS; A and B – different upper-case letters indicate statistically significant differences between groups (P-value ≤ 0.01); a and b – different lower-case letters indicate statistically significant differences between groups (P-value ≤ 0.05); non-underlined letters – mRNA-level differences; underlined letters – protein-concentration differences
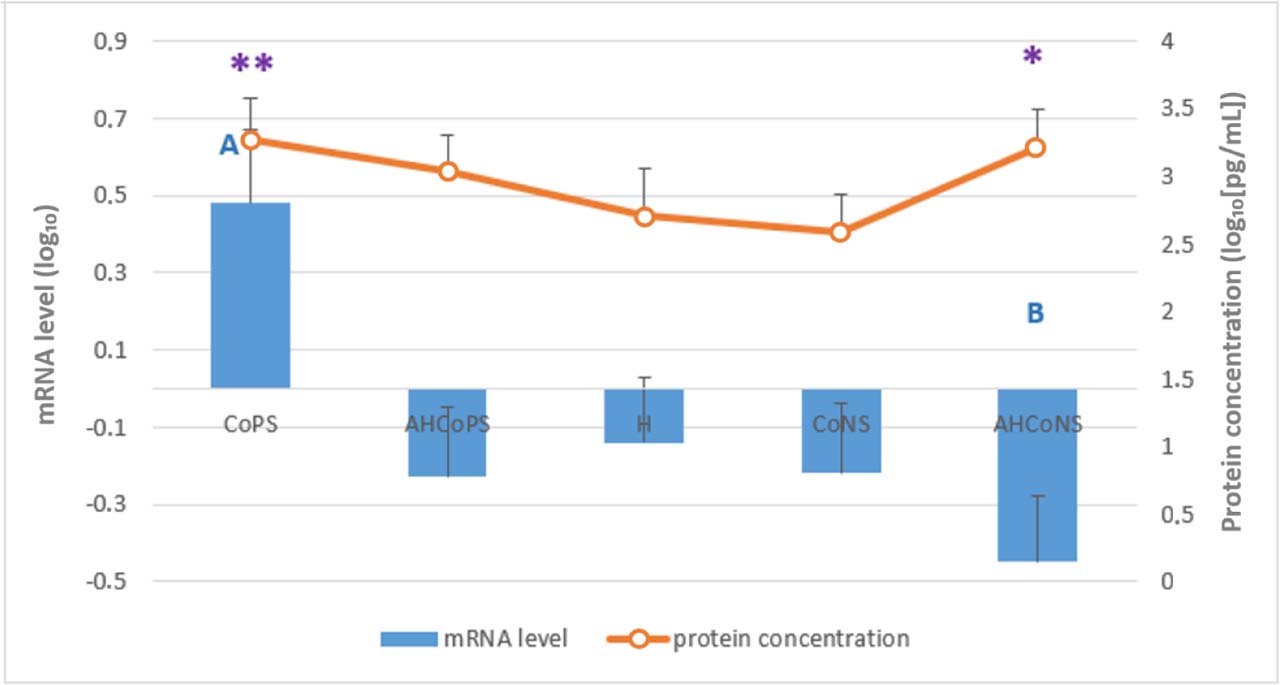
Fig. 5.
Least-squares means estimated from the final linear mixed-effects model for relative mRNA levels of the IL8 gene (bars) and IL-8 protein concentration determined by ELISA (line), both log10-transformed. Tissue was analysed which had been sampled post slaughter from Polish Holstein-Friesian cows between the first and fourth lactation. CoPS – quarters infected with coagulase-positive staphylococci; AHCoPS – healthy quarters adjacent to one infected with CoPS; H – quarters taken from udders healthy in all quarters; CoNS – quarters infected with coagulase-negative staphylococci; AHCoNS – healthy quarters adjacent to one infected with CoNS; * and ** – statistically significant within-group correlation between mRNA and protein levels (Spearman’s rank correlation, P-value ≤ 0.05 (*) or ≤ 0.01 (**)); A and B – different upper-case letters indicate statistically significant differences between groups (P-value ≤ 0.01)
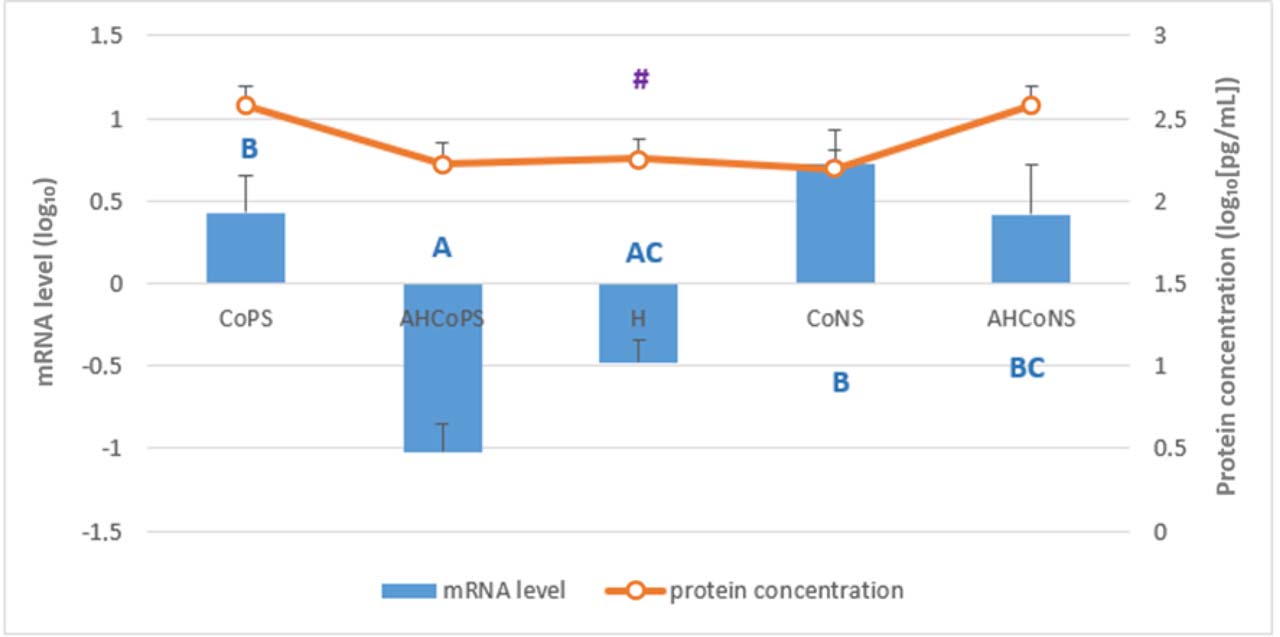
Fig. 6.
Least-squares means estimated from the final linear mixed-effects model for relative mRNA levels of the IL12A gene (bars) and IL-12α protein concentration determined by ELISA (line), both log10-transformed. Tissue was analysed which had been sampled post slaughter from Polish Holstein-Friesian cows between the first and fourth lactation. CoPS – quarters infected with coagulase-positive staphylococci; AHCoPS – healthy quarters adjacent to one infected with CoPS; H – quarters taken from udders healthy in all quarters; CoNS – quarters infected with coagulase-negative staphylococci; AHCoNS – healthy quarters adjacent to one infected with CoNS; # – statistically significant within-group correlation between mRNA and protein levels (Spearman’s rank correlation, P-value ≤ 0.10); A, B and C – different upper-case letters indicate statistically significant differences between groups (P-value ≤ 0.01)
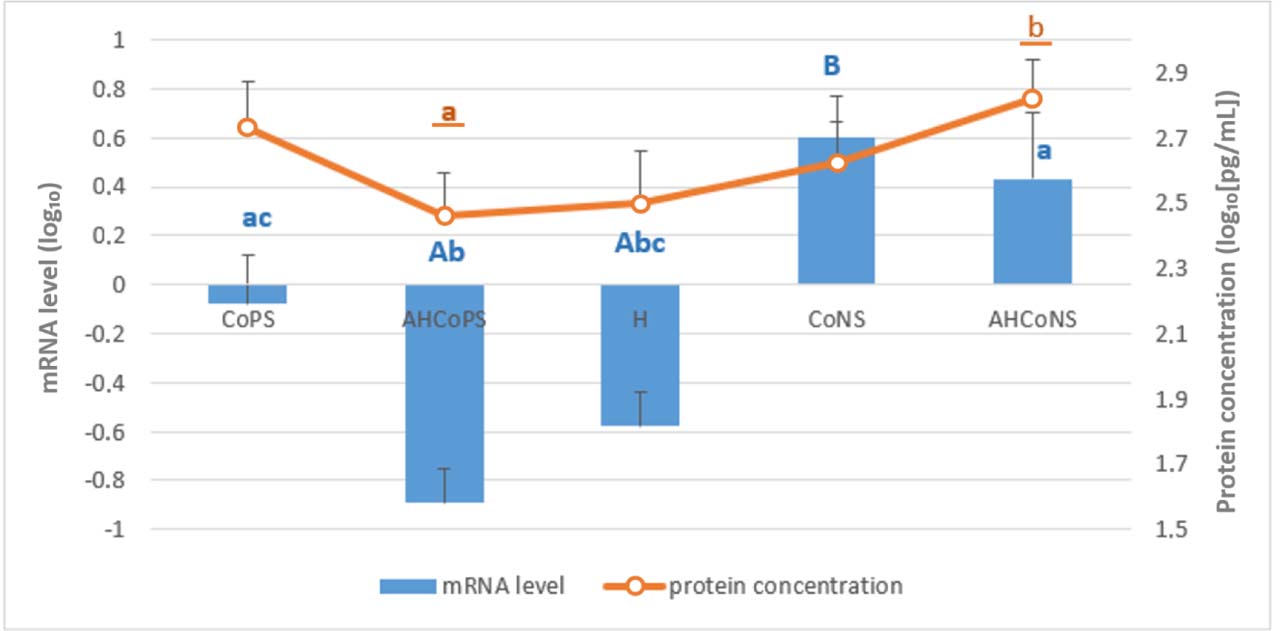
Fig. 7.
Least-squares means estimated from the final linear mixed-effects model for relative mRNA levels of the IL12B gene (bars) and IL-12β protein concentration determined by ELISA (line), both log10-transformed. Tissue was analysed which had been sampled post slaughter from Polish Holstein-Friesian cows between the first and fourth lactation. CoPS – quarters infected with coagulase-positive staphylococci; AHCoPS – healthy quarters adjacent to one infected with CoPS; H – quarters taken from udders healthy in all quarters; CoNS – quarters infected with coagulase-negative staphylococci; AHCoNS – healthy quarters adjacent to one infected with CoNS; A, B and C – different upper-case letters indicate statistically significant differences between groups (P-value ≤ 0.01); a, b and c – different lower-case letters indicate statistically significant differences between groups (P-value ≤ 0.05); non-underlined letters – mRNA-level differences; underlined letters – protein-concentration differences
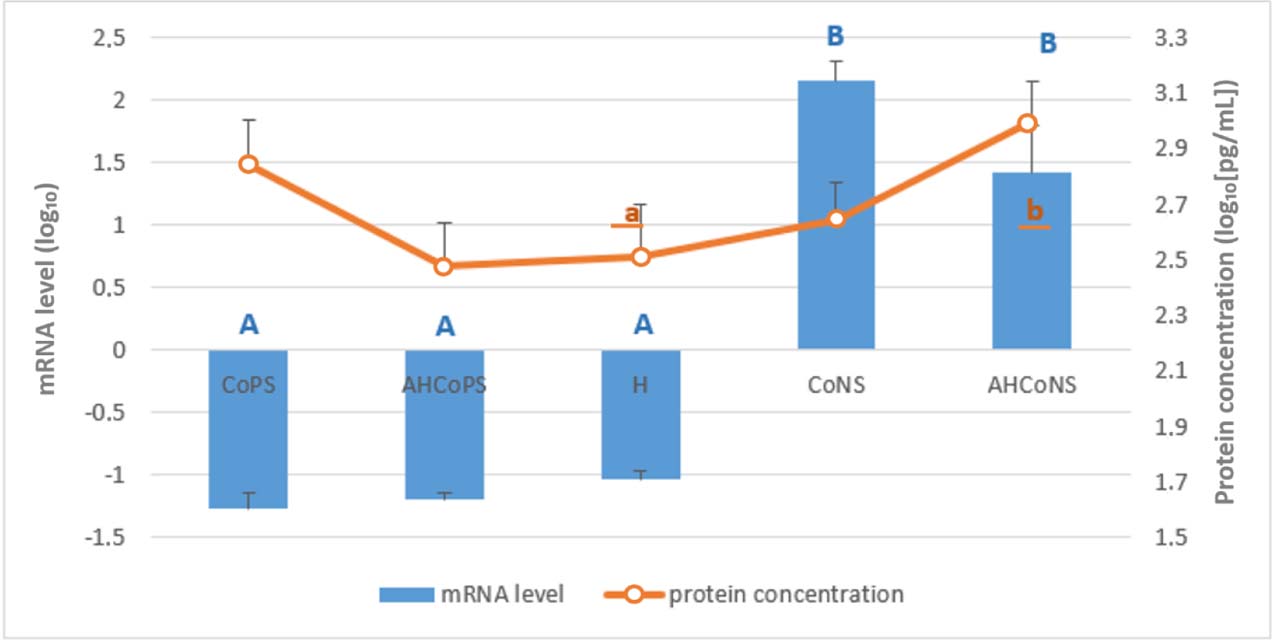
Fig. 8.
Least-squares means estimated from the final linear mixed-effects model for relative mRNA levels of the IL18 gene (bars) and IL-18 protein concentration determined by ELISA (line), both log10-transformed. Tissue was analysed which had been sampled post slaughter from Polish Holstein-Friesian cows between the first and fourth lactation. CoPS – quarters infected with coagulase-positive staphylococci; AHCoPS – healthy quarters adjacent to one infected with CoPS; H – quarters taken from udders healthy in all quarters; CoNS – quarters infected with coagulase-negative staphylococci; AHCoNS – healthy quarters adjacent to one infected with CoNS; A and B – different upper-case letters indicate statistically significant differences between groups (P-value ≤ 0.01); a and b – different lower-case letters indicate statistically significant differences between groups (P-value ≤ 0.05); non-underlined letters – mRNA-level differences; underlined letters – protein-concentration differences
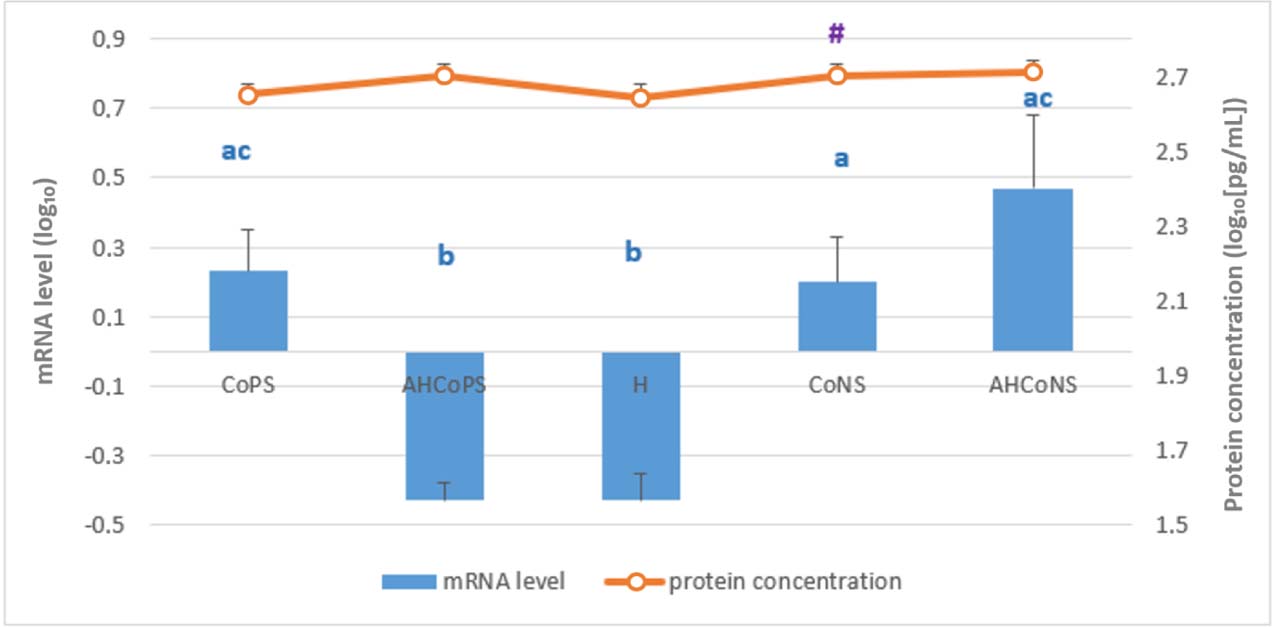
Fig. 9.
Least-squares means estimated from the final linear mixed-effects model for relative mRNA levels of the TNF gene (bars) and TNF-α protein concentration determined by ELISA (line), both log10-transformed. Tissue was analysed which had been sampled post slaughter from Polish Holstein-Friesian cows between the first and fourth lactation. CoPS – quarters infected with coagulase-positive staphylococci; AHCoPS – healthy quarters adjacent to one infected with CoPS; H – quarters taken from udders healthy in all quarters; CoNS – quarters infected with coagulase-negative staphylococci; AHCoNS – healthy quarters adjacent to one infected with CoNS; # – statistically significant within-group correlation between mRNA and protein levels (Spearman’s rank correlation, P-value ≤ 0.10); a, b and c – different lower-case letters indicate statistically significant difference (P-value ≤ 0.05)
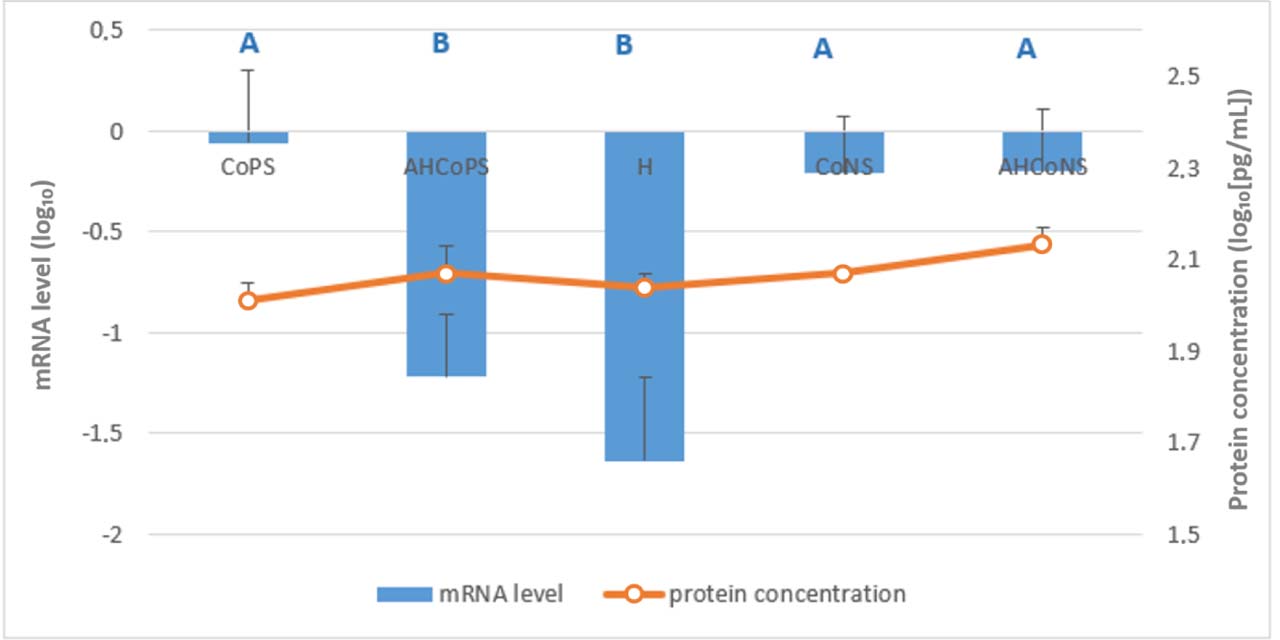
Fig. 10.
Least-squares means estimated from the final linear mixed-effects model for relative mRNA levels of the C-X-C motif chemokine ligand 5 (CXCL5) gene (bars) and CXCL5 protein concentration determined by ELISA (line), both log10-transformed. Tissue was analysed which had been sampled post slaughter from Polish Holstein-Friesian cows between the first and fourth lactation. CoPS – quarters infected with coagulase-positive staphylococci; AHCoPS – healthy quarters adjacent to one infected with CoPS; H – quarters taken from udders healthy in all quarters; CoNS – quarters infected with coagulase-negative staphylococci; AHCoNS – healthy quarters adjacent to one infected with CoNS; A and B – different upper-case letters indicate statistically significant differences between groups (P-value ≤ 0.01)
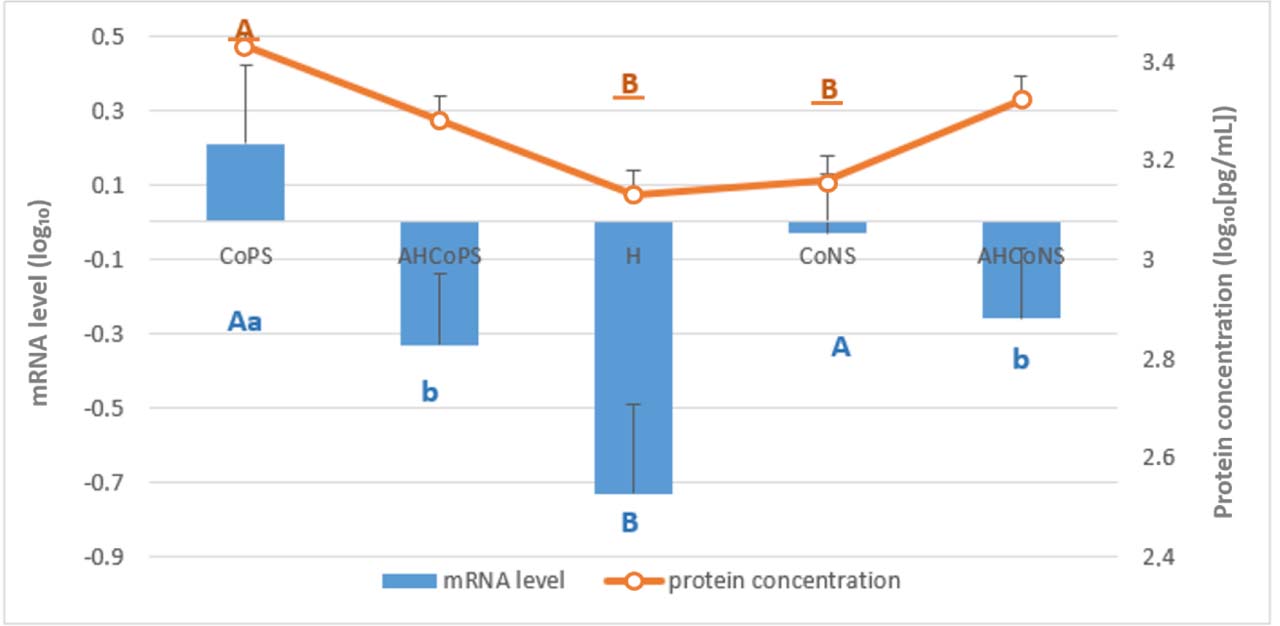
Fig. 11.
Least-squares means estimated from the final linear mixed-effects model for relative mRNA levels of the chemokine growth-regulated oncogene α protein (CXCL1/GROα) gene (bars) and CXCL1 protein concentration determined by ELISA (line), both log10-transformed. Tissue was analysed which had been sampled post slaughter from Polish Holstein-Friesian cows between the first and fourth lactation. CoPS – quarters infected with coagulase-positive staphylococci; AHCoPS – healthy quarters adjacent to one infected with CoPS; H – quarters taken from udders healthy in all quarters; CoNS – quarters infected with coagulase-negative staphylococci; AHCoNS – healthy quarters adjacent to one infected with CoNS; A and B – different upper-case letters indicate statistically significant differences between groups (P-value ≤ 0.01); a and b – different lower-case letters indicate statistically significant differences between groups (P-value ≤ 0.05); non-underlined letters – mRNA-level differences; underlined letters – protein-concentration differences