
Introduction
Bovine mastitis remains one of the most economically burdensome diseases in dairy farming, resulting in substantial production losses (50) and increased treatment costs (26). The disease occurs in two forms, with subclinical mastitis being notably more challenging to diagnose than the clinical form (54). The aetiology of mastitis is predominantly bacterial, with streptococci, staphylococci, and coliforms being the most frequently isolated pathogens (39). Among these, coagulase-negative (CoNS) and coagulase-positive staphylococci (CoPS) are particularly prevalent (13). Both clinical and subclinical mastitis alter the physical, chemical and organoleptic properties of milk, adversely affecting its yield, composition, and nutritional quality (50, 68). Besides these quality impairments, clinical or subclinical mastitis in a quarter can lead to raw milk sourced from that quarter containing significant levels of pro-inflammatory agents (35).
Although pasteurisation and sterilisation effectively neutralise bacteria, these processes may not remove thermostable toxins. Such toxins are primarily produced by CoPS (44) and, to a lesser extent, by certain CoNS (55). If present in milk, they pose a potential threat to human health (12). Furthermore, heat treatment reduces both the diversity and abundance of milk proteins - boiling has been shown to reduce the total protein content to approximately half compared with that of raw milk (9).
Raw milk is routinely subjected to heat treatment to ensure microbiological safety. However, thermal processing can also alter the composition of biologically active milk components, including proteins associated with immune responses. Proteomic analyses conducted by Brick et al. (9) revealed distinct processing-specific patterns across 140 proteins. Of these, 23 heat-sensitive proteins, predominantly associated with immune functions, were significantly reduced following intensive heating, although not all proteins were affected. Parallel research on human milk indicates that while interferon gamma, TNF-α, IL-1β, IL-10 and hepatocyte growth factor were reduced by pasteurisation, IL-2, IL-4, IL-5, IL-8, IL-13 and the active heterodimer of IL-12p70 remained stable (18). However, some reports suggest that IL-10 remains unaffected, while IL-8 levels are frequently preserved. In certain experimental systems, IL-8 concentrations have even been observed to increase because of heat-mediated release from vesicular carriers (15, 22). Thus, in bovine milk, pasteurisation tends to diminish certain immune factors, whereas many soluble cytokines remain detectable. Their reported levels, however, may vary depending on the specific cytokine, the thermal protocol and the analytical method applied. In practice, quarters affected by clinical mastitis are often milked separately, their milk is kept out of the food chain, and the quarters are subsequently treated with intramammary antibiotics. In contrast, milk from quarters with undiagnosed subclinical mastitis, as well as from healthy quarters adjacent to infected ones, may still be pooled for human consumption.
The quarters are the four distinct mammary glands into which the bovine udder is anatomically partitioned. These are separated by connective tissue septa composed primarily of collagen and elastin fibres, which divide the udder into fore and hind quarters, and by the median suspensory ligament, consisting of sheets of yellow elastic tissue and fibrous connective tissue, which bisects the udder into left and right halves (3). No direct internal communication exists between quarters (21, 45). Until recently, the mammary gland quarters were considered to be not only anatomically but also physiologically independent units (45, 46).
Pharmacokinetic studies support this functional separation, demonstrating that intramammary administration of drugs (e.g. ceftiofur) into an infected quarter does not result in detectable residues in adjacent untreated quarters (10). Quarter-milk collection systems further reflect this independence, as each gland produces milk with distinct yield characteristics, although compositional differences remain minimal under healthy conditions (63). Immunologically, it appears that each quarter exhibits localised responses, with lymphatic drainage patterns potentially preventing the spread of antigen-specific plasma cells to non-stimulated quarters (23). Consequently, the bovine udder has long been viewed as a system of four anatomically and physiologically autonomous glandular units. Previous research on the interdependencies between healthy and infected quarters has focused primarily on polymorphonuclear leukocytes, somatic cell count (SCC), or the risk of pathogen transfer within the same animal (1, 7, 42). However, emerging evidence, such as the study by Jensen et al. (28) on experimentally induced intramammary infections, suggests that Staphylococcus aureus and Escherichia coli can modulate transcriptional processes in neighbouring healthy quarters, altering the expression of nearly 200 genes, including several key cytokines.
Cytokines are low-molecular-weight proteins that function as critical immune modulators, mediating diverse biological processes in both immune and non-immune tissues. Although they primarily exert local (paracrine or autocrine) effects, they can also elicit systemic humoral responses (16). The presence of elevated pro-inflammatory cytokines in food products may adversely affect human health (38, 61). Given their soluble nature and relatively small molecular size, cytokines may also be mediators capable of moving between anatomically adjacent mammary quarters. Granger and Taylor (24) identified structural gaps in the connective tissue septa, suggesting that certain substances, including proteins, may pass between udder quarters. Despite these early findings, such investigations remain exceptionally rare. Our preliminary research demonstrated that milk from healthy quarters adjacent to those infected with staphylococci is characterised by higher SCC (approximately 7.5 × 10⁵ cells/mL; natural logarithm (ln) = 6.57) than milk from quarters of entirely healthy udders (4.5 × 10⁴ cells/mL; ln = 3.54). In comparison, quarters infected with CoPS or CoNS yielded milk with approximately 2.46 × 10⁶ cells/mL (ln = 7.86) (60). Consequently, inflammation in an infected quarter may elicit an immune response in adjacent quarters even in the absence of mastitis-causing pathogens. This suggests that immune-related mediators may be transported between udder quarters potentially as a mechanism to prime the defences of healthy glands. Alongside mammary epithelial cells, leukocytes including neutrophils, lymphocytes, and macrophages secrete cytokines as part of a coordinated innate and adaptive immune response (8, 43). Thus, elevations in milk SCC are typically accompanied by increased concentrations of cytokines, particularly pro-inflammatory mediators. Furthermore, many cytokines, especially chemokines, exhibit potent chemotactic properties, enhancing the recruitment and accumulation of leukocytes at the site of inflammation (27, 64). Based on these observations, milk from clinically healthy quarters adjacent to those with subclinical staphylococcal mastitis was hypothesised to also contain elevated levels of pro-inflammatory agents.
The present study aims to evaluate the impact of subclinical staphylococcal infection of a single dairy cow udder quarter on the expressions of selected cytokine genes in adjacent udder quarters. Because transcriptional activity and protein abundance provide complementary information on local immune activation, both cytokine gene expression and protein concentrations were analysed. Assessing both molecular levels allows a more comprehensive characterisation of the inflammatory response than either approach alone. Importantly, there remains a notable scarcity of such mRNA-protein level investigations focusing specifically on clinically healthy mammary quarters proximal to the site of infection.
A previous Kyoto Encyclopedia of Genes and Genomes analysis (33) demonstrated that chemokine signalling and cytokine–cytokine receptor interaction pathways are overrepresented in the mammary gland parenchyma during subclinical staphylococcal mastitis. It has been confirmed that cytokine gene-expression profiles in the mammary gland parenchyma differ significantly between quarters infected with CoPS or CoNS and healthy control udders (30). However, that study focused exclusively on infected quarters and quarters from udders healthy in all four glands and did not investigate clinically healthy quarters adjacent to infected glands. The current study extends those findings by examining the mRNA and protein expression of 11 cytokines, selected based on prior genomic and transcriptomic screenings (30, 33, 34), to characterise the local immune response within infected quarters, healthy quarters adjacent to infected ones, and those from udders healthy in all quarters.
Material and Methods
Animals
The present study is an extension of a previous investigation (30) and utilises tissues from the same experimental cohort. However, it addresses an entirely distinct biological question and presents completely original data. While the previous work (30) focused strictly on comparing infected quarters with completely healthy controls, it did not investigate or report data from the adjacent healthy quarters. In strict alignment with the 3Rs principle (Replacement, Reduction, and Refinement) of minimising unnecessary animal use, tissue samples from the same baseline collection were utilised. All laboratory analyses for the present study were performed de novo: total RNA was freshly re-extracted from all archived parenchyma samples, and quantitative RT-qPCR reactions were conducted. Cytokine protein concentrations were also determined by ELISA to complement the transcriptomic analyses performed in the present study. Consequently, all laboratory results, statistical comparisons, and biological conclusions presented here are completely novel and have not been previously reported.
The study was conducted on 50 Polish Holstein-Friesian (PHF) dairy cows of the black-and-white variety maintained at the Experimental Farm of the Institute of Genetics and Animal Biotechnology in Jastrzębiec, located in central Poland. The experimental groups comprised cows between their first and fourth lactation. Detailed metadata characterising the animals across each experimental group, including PHF gene share, parity distribution, average milk yield at the last control milking, and the milk’s composition parameters (fat content, protein content and SCC) are comprehensively summarised in Supplementary Table S1. These group-specific baselines demonstrate the phenotypic homogeneity of the cohorts. Housing and management details were previously characterised by Kościuczuk et al. (33), while specific nutritional protocols were described by Korwin-Kossakowska et al. (32). Briefly, animals were housed in a loose-housing system with access to outdoor runs and provided with a total mixed ration (TMR) ad libitum. The TMR was based on corn silage, high-quality hay and concentrate, supplemented with a dedicated mineral-vitamin premix (Vitamix KM, Polmass, Bydgoszcz, Poland). The diet was formulated according to Institut National de la Recherche Agronomique standards but adapted to Polish conditions (59). Animals had ad libitum access to fresh water via automatic drinkers, with heated water provided during the winter. Continuous veterinary supervision was maintained throughout the study. Cows were culled as part of routine herd management at approximately 280 d of lactation (±25 d) and transported to a certified commercial slaughterhouse. Slaughter was performed in accordance with national and EU animal welfare regulations with standard stunning and exsanguination methods. Formal permission for mammary tissue collection was obtained from both the facility owner and the official veterinarian.
The experimental group comprised cows with subclinical staphylococcal mastitis that remained unresponsive to several antibiotic treatments during their final lactation. In all cases, a minimum withdrawal period of one month was maintained before slaughter. The control group consisted of cows with no detectable bacterial infection in any udder quarter, culled due to reproductive disorders. Any animals displaying active clinical mastitis at the time of slaughter were excluded from the study.
Sample collection
An initial cohort of 50 cows was selected, and the health status of all 200 mammary quarters was assessed. Udder health was evaluated based on quarter-specific SCC and microbiological screening. Two days before slaughter, milk samples were collected from each quarter separately. After forestripping and disinfecting teats with 70% alcohol, approximately 5–10 mL of foremilk was manually stripped aseptically into sterile 30 mL-capacity tubes for microbiological analysis. Each tube was opened only for the brief duration of the single-quarter collection to minimise exposure to the environment. Subsequently, samples for SCC and milk composition analysis were obtained during complete quarter milking using a dedicated quarter-milking bucket system with collection containers (Bentley Instruments, Chaska, MN, USA) connected to the milking unit. After milking, the total milk from each quarter within the collection container was gently mixed, and a representative 50 mL aliquot was transferred into an individual plastic tube. All samples were transported and maintained at 4°C and processed within 24 h of collection. In the laboratory, after secondary mixing, a 20 mL sub-sample was transferred into a 30 mL tube containing Microtabs preservative (Bentley Instruments). Milk composition was analysed using a MilkoScan FT2 apparatus (Foss, Hillerød, Denmark), and SCC was determined using a BactoCount IBC-M individual bacteria counter (Bentley Instruments), following the manufacturer’s instructions.
A total of 200 samples were subjected to microbiological analysis. Prior to inoculation, each sample was thoroughly mixed. Subsequently, a 100 μL aliquot of each sample was aseptically spread onto Columbia agar supplemented with 5% sheep blood, Mannitol Salt agar and MacConkey agar (bioMérieux, Craponne, France) using a sterile spreader. This larger inoculum volume was consistently utilised according to previously described protocols to maximise diagnostic sensitivity for detecting low-level bacterial shedding typical of subclinical infections (5, 69). The plates were incubated aerobically at 37°C for 24–48 h. Following incubation, morphologically distinct colonies were isolated and characterised via Gram staining and biochemical testing. The first 100 samples were microbiologically identified based on biochemical profiles and nutrient utilisation using the manual API system (bioMérieux), following the manufacturer’s instructions. To confirm the isolation of staphylococci, colonies exhibiting characteristic morphology were subjected to a catalase test (via hydrogen peroxide application) and a tube coagulase test using rabbit plasma (Biomed, Warsaw, Poland). The presence of S. aureus was further confirmed using the Slidex Staph-Kit (bioMérieux). The remaining 100 samples were analysed using the automated VITEK 2 Compact system (bioMérieux). Following isolation and Gram staining, morphologically distinct colonies were processed using VITEK 2 GN cards for Gram-negative bacteria and GP cards for Gram-positive bacteria, as per the manufacturer’s protocol.
Both identification methods are based on identical biochemical principles and were supplied by the same manufacturer (bioMérieux). The transition to the VITEK 2 system represents a methodological advancement over manual API testing, as it provides enhanced automation, standardised result interpretation, and reduced operator-dependent variability. While the manual API system is considered a gold standard in biochemical bacterial identification and offers high accuracy, the automated VITEK 2 system is a recognised benchmark. It ensures high reproducibility and accuracy – reported to be between 95% and 98% – while significantly increasing throughput and analytical consistency.
While milk samples were used to determine the microbiological status of the udder, the primary objective of this study was to analyse gene expression (mRNA) and protein levels within the mammary parenchyma. Specifically, tissue samples with a predominance of secretory epithelium were collected to evaluate cytokine expression localised in mammary secretory cells. This approach was chosen to distinguish epithelial-derived cytokines from those produced by leukocytes migrating from the bloodstream, as cytokines present in milk represent a combined pool from both sources. Accordingly, mammary gland parenchyma samples (1 cm × 1 cm × 5 cm) were collected from the secretory tissue of all 200 udder quarters immediately after slaughter. To ensure representative sampling of the secretory epithelium, tissue was collected from the deep, dorsal (upper) region of the mammary gland. The specimens were promptly rinsed in PBS of pH 7.2 (Merck, Darmstadt, Germany), flash-frozen in liquid nitrogen and transported to the laboratory. All samples were stored at −80°C until molecular and biochemical analyses were undertaken.
The staphylococcal species distribution in the infected quarters was that described by Bagnicka et al. (5), because the same animals were in the cohort. Of the infected milk samples, 35.8% were positive for coagulase-positive S. aureus, whereas 32.8% were positive for coagulase-negative staphylococci (also currently referred to as non-aureus staphylococci, NAS). Within the CoNS group, the most frequent isolate was Staphylococcus epidermidis (45%), and next in descending order were Staphylococcus sciuri (13%), Staphylococcus vitulinus (12%), Staphylococcus xylosus (12%), Staphylococcus chromogenes (10%) and Staphylococcus lentus (8%). While the 2021 study (31) compared infected quarters from mastitic cows with quarters from control cows with no mastitis in any quarter, the present work compares these infected quarters with the adjacent healthy ones from the same mastitic cows.
Cows with multiple infected quarters or those harbouring diverse pathogens were excluded from the study. Quarters with coliform infections (n = 2) or mixed infections (e.g. Staphylococcus spp. and Streptococcus spp.; n = 3) were also omitted. Environmental bacteria identified in milk were not considered as primary pathogens during the classification of infection status (they were not considered during classification). A paired-quarter model was established for each cow which did not need to be excluded, consisting of one infected quarter and one adjacent or contralateral healthy quarter for comparative analysis. Finally, the selected samples (n = 50) were allocated into five groups (n = 10 per group): (1) tissue infected with CoPS, (2) healthy tissue from quarters adjacent to those infected with CoPS (AHCoPS), (3) tissue infected with CoNS, (4) healthy tissue from quarters adjacent to those infected with CoNS (AHCoNS), and (5) bacteria-free control samples (H) from healthy udders with no history of clinical mastitis. The study cohorts were balanced with respect to parity and stage of lactation.
RT-qPCR
Total RNA was isolated from 30 mg of each tissue sample using the RNeasy Mini Kit (Qiagen, Hilden, Germany), following the manufacturer’s recommendations. To ensure optimal quality, the RNA was further purified and concentrated using the DNA/RNA Clean & Concentrator kit (Zymo Research, Irvine, CA, USA). The purity and concentration of RNA were initially assessed via spectrophotometry using a NanoDrop 1000 spectrophotometer (Thermo Fisher Scientific, Waltham, MA, USA) and verified by electrophoresis on a 1% agarose gel with RNA Marker 1 RTU (a ready-to-use size marker) (A&A Biotechnology, Gdańsk, Poland) at 80 V on Bio-Rad Laboratories apparatus (Hercules, CA, USA). The integrity of the RNA was subsequently evaluated using the Agilent 2100 Bioanalyzer with the RNA 6000 Nano LabChip Kit (Agilent Technologies, Santa Clara, CA, USA). Only samples with an RNA integrity number (RIN) above 7.0 were deemed acceptable for further analysis. Samples failing to meet this threshold were subjected to re-extraction.
Subsequently, 1,000 ng of total RNA from each sample was reverse-transcribed using the Transcriptor First Strand cDNA Synthesis kit (Roche Diagnostics, Basel, Switzerland) according to the manufacturer’s instructions. The reverse transcription was performed under the following thermal conditions: annealing and synthesis at 50°C for 60 min, inactivation at 85°C for 5 min, and a final hold at 4°C. The resulting cDNA was diluted to a working concentration of 50 ng/μL. A qPCR was conducted using the LightCycler 480 SYBR Green I Master kit (Roche Diagnostics) following the optimised thermal cycling protocols. To ensure analytical precision, each sample was analysed in technical triplicates for every target gene. The expression profiles of 11 selected cytokine genes were analysed: IL1A, IL1B, IL2, IL6, IL8, IL12A, IL12B, IL18, TNF, C-X-C motif chemokine ligand 5 (CXCL5) and chemokine growth-regulated oncogene α (GROα, also known as CXCL1). Primers were either synthesised based on validated sequences from the literature or designed using the NCBI Primer-BLAST tool (67). For normalisation, glyceraldehyde 3-phosphate dehydrogenase (GAPDH) and hypoxanthine phosphoribosyltransferase 1 (HPRT1) were used as reference genes. Their suitability for mammary gland parenchyma expression studies was previously validated (30, 34, 69). Detailed information for all target and reference genes – including symbols, full names, GenBank accession numbers, primer sequences and melting temperatures (Tm) – is summarised in Table 1.
Table 1.
Genes and primers used for RT-qPCR analysis of cytokine genes expressed in mastitic udder quarters and adjacent healthy quarters sampled post slaughter from Polish Holstein-Friesian cows between the first and fourth lactation
| Gene symbol and GenBank accession No. | Primer sequences (5′–3′) | Melting temp. (°C) | Annealing temp. (°C) | Source |
|---|---|---|---|---|
| IL1A NM_174092 | F: ATGAGCCACTTCGTGAGGAC R: GCTTCCAGGTCATCATCGGT | 53.8 53.8 | 50 | Primer-BLAST |
| IL1B NM_174093 | F: AGACCCCAAAGTCTACCCCA R: GTCCTCGGGGTTATTCAGCC | 53.8 55.9 | 52 | Primer-BLAST |
| IL2 NM_180997 | F: GCTCTACGGGGAACACAATG R: CATCCTGGAGAGCTTGAGGT | 53.8 53.8 | 50 | Primer-BLAST |
| IL6 NM_173923 | F: TCCAGAACGAGTATGAGG R: CATCCGAATAGCTCTCAG | 48.0 48.0 | 45 | (31) |
| IL8 JN559767 | F: GACTTCCAAGCTGGCTGTTG R: TTTGGGGTGGAAAGGTGTGG | 53.8 53.8 | 50 | Primer-BLAST |
| IL12A NM_174355 | F: ACAACCCTGTGCCTTAGAAGT R: TGCCAGCATGTTCTGGTCTA | 52.4 51.8 | 49 | (49) |
| IL12B NM_174356 | F: ACCAGAGCAGTGAGGTCTTG R: GAGTGAACGACTCAGAGCCT | 53.8 53.8 | 50 | (49) |
| IL18 NM_174091 | F: CAGATAATGCACCCCAGACCA R: TACGGCCAGACCTCTAGTGA | 54.4 53.8 | 51 | Primer-BLAST |
| TNF NM_173966 | F: GAAGTTGCTTGTGCCTCAGC R: AACCAGAGGGCTGTTGATGG | 53.8 53.8 | 50 | Primer-BLAST |
| CXCL5 NM_174300 | F: TGAGACTGCTATCCAGCCG R: AGATCACTGACCGTTTTGGG | 53.2 51.8 | 50 | (20) |
| GROα U95812 | F: CCAGAGCGTGAAGGTGACAA R: TAAACACAGTCCAGATGGCCC | 53.8 54.4 | 51 | Primer-BLAST |
| GAPDH NM_001034034 | F: ACCACTTTGGCATCGTGGAG R: GGGCCATCCACAGTCTTCTG | 53.8 55.9 | 50 | (30) |
| HPRT1 NM_001034035.2 | F: TGCTGAGGATTTGGAGAAGG R: CAACAGGTCGGCAAAGAACT | 51.8 51.8 | 48 | (30) |
The qPCR amplification was performed using the following thermal profile: initial denaturation at 95°C for 5 min (1 cycle), 45 cycles consisting of denaturation at 95°C for 10 s, annealing at temperatures optimised for each primer pair as specified in Table 1 for 10 s, and elongation at 72°C for 10 s. To confirm the specificity of the amplification products, a melting curve analysis was conducted immediately after the final cycle. This involved heating to 95°C for 5 s, cooling to 65°C for 1 min and a gradual temperature increase to 97°C in continuous acquisition mode. The process was concluded with a final cooling step at 40°C for 30 s. To verify the specificity of the amplification and the expected product size, RT-qPCR products were resolved by electrophoresis on 2% agarose gels stained with Midori Green Advance DNA STAIN (ABO, Gdańsk, Poland) at 80 V on the Bio-Rad Laboratories apparatus with a 100 bp DNA Ladder RTU (range: 100–1,500 base pair; GeneDireX, Taoyuan, Taiwan) as a molecular weight standard to determine the size of the amplicons.
ELISA tests
Cytokines were extracted from the same mammary parenchyma samples used for mRNA isolation to ensure experimental consistency. Protein concentrations were determined using an ELISA. Cytokine concentrations were calculated based on the standard curve (provided by the manufacturer) and expressed as pg/mL of tissue homogenate. To ensure comparability between samples, a strict tissue-to-buffer ratio was maintained: 70 mg of tissue was homogenised in 1 mL of PBS. The protein fraction was separated according to the manufacturer’s recommendations. Briefly, tissue samples were mechanically homogenised in tubes filled with silica beads (A&A Biotechnology) and in PBS solution. Apart from samples designated for GROα, all homogenates were sonicated twice using a 4710 Series Ultrasonic Homogenizer (Cole-Parmer Instrument, Chicago, IL, USA) at 60% output power for 5 s, with cooling on ice between cycles. Finally, the homogenates were centrifuged (10,000 × g at 4°C for 5 min), and the supernatants were collected into clear tubes for ELISA testing.
The detection of IL-1α, IL-1β, IL-2, IL-6, IL-8, IL-12α, IL-12β, IL-18 and TNF-α was done with ELISAs from ELK Biotechnology (Denver, USA), the presence of CXCL5 was detected with a Bioassay Technology Laboratory assay (Shanghai, China), and the indication of GROα was with a kit from Xinqidibio (Wuhan, China). The readings for each standard, control and experimental group sample were taken in duplicate (according to protocol) at 450 nm, and the mean value was recorded. The protein levels were calculated according to the manufacturers’ instructions. First, the mean values of the pairs of readings for each standard and sample were taken. A standard curve was then constructed in the form of a scatter plot with a trend line for standards. This was used to create linear or exponential regression equations and an R2 value, which were used to calculate the concentration of the tested protein based on the mean absorbance.
Statistical analysis
After data editing and exclusion of extreme mRNA copy number values, between eight and ten samples per group were statistically analysed depending on the particular cytokine. As transcription analyses are valuable with five-sample groups, the size of the groups was sufficient (62). All ELISA-test values were included in the analysis. Data for mRNA and protein levels were assessed for normality using PROC UNIVARIATE (SAS/STAT v. 9.4; SAS Institute, Cary, NC, USA). Because the relative expression levels and protein concentrations exhibited skewed distributions (as confirmed by the Shapiro-Wilk test), data were log10-transformed. This stabilisation of variance ensured compliance with the linearity, homoscedasticity, and residual normality assumptions of the linear models. Prior to the main analysis, the homogeneity of variance was formally assessed on the log-transformed data using Levene’s test conducted in the general linear model procedure of the SAS package. For variables where the assumption of homogeneity was met (P-value > 0.05), a linear mixed-effects model (PROC MIXED) was applied, including the individual animal as a random effect. For variables where heteroscedasticity was detected (P-value < 0.05), the model was adjusted using the REPEATED statement with the GROUP = group and SUBJECT = cow options (using a compound symmetry, TYPE = CS and covariance structure) to formally account for heterogeneous residual variances across groups. The results of Levene’s test (Table 2) justified the use of the GROUP option in the PROC MIXED procedure for traits with unequal variances (P-value < 0.05). The final models included the health status of the quarter as a fixed effect. Parity and the anatomical position of the quarters (right, left, hind, and front) were included in preliminary analyses but were subsequently excluded from the final models as they were non-significant. Days in milk were omitted as all animals were at a consistent stage of late lactation. In all models, the Satterthwaite approximation was used to estimate degrees of freedom. Pairwise comparisons of the least-squares means were evaluated using the Tukey–Kramer adjustment, with the significance level set at P-value < 0.05.
Table 2.
Levene’s test for homogeneity of variance in log-transformed data for cytokine expression in mastitic udder quarters and adjacent healthy quarters sampled post slaughter from Polish Holstein-Friesian cows between the first and fourth lactation
| Gene symbol | F statistic | P-value | Protein name | Result | F statistic | P-value | Result |
|---|---|---|---|---|---|---|---|
| IL1A | 0.55 | 0.7010 | IL-1α | Homogeneous | 0.85 | 0.5040 | Homogeneous |
| IL1B | 4.60 | 0.0040 | IL-1β | Heterogeneous | 0.37 | 0.8258 | Homogeneous |
| IL2 | 1.97 | 0.1197 | IL-2 | Homogeneous | 2.56 | 0.0590 | Homogeneous |
| IL6 | 3.35 | 0.0191 | IL-6 | Heterogeneous | 3.03 | 0.0356 | Heterogeneous |
| IL8 | 2.30 | 0.0777 | IL-8 | Homogeneous | 2.63 | 0.0556 | Homogeneous |
| IL12A | 5.06 | 0.0024 | IL-12α | Heterogeneous | 0.37 | 0.8287 | Homogeneous |
| IL12B | 4.52 | 0.0040 | IL-12β | Heterogeneous | 1.03 | 0.4080 | Homogeneous |
| IL18 | 3.82 | 0.0103 | IL-18 | Heterogeneous | 1.90 | 0.1370 | Homogeneous |
| TNF | 5.13 | 0.0022 | TNF-α | Heterogeneous | 0.79 | 0.5409 | Homogeneous |
| CXCL5 | 0.62 | 0.6496 | CXCL5 | Homogeneous | 5.53 | 0.0020 | Heterogeneous |
| GROα | 2.44 | 0.0636 | GROα | Homogeneous | 0.90 | 0.4766 | Homogeneous |
Correlation and regression analyses were performed separately within each experimental group to account for potential heterogeneity in the direction and magnitude of associations. Spearman’s rank correlation (PROC CORR) was initially applied. The linear regression analysis was performed using the PROC MIXED procedure as described above with the same model for each trait supplemented with regression effect. Two regression models were used: 1) mRNA levels were treated as the independent variable and protein concentrations as the dependent variable, based on the biological assumption that protein abundance is regulated by mRNA levels; 2) protein levels were treated as the independent variable and mRNA levels as the dependent variable, based on the assumption of the existence of feedback between mRNA and protein. Statistical significance was defined at P-value ≤ 0.05 and P-value ≤ 0.01, while results within the range of 0.05 ≤ P-value ≤ 0.1 were considered statistical tendencies and discussed accordingly. All analyses were performed using SAS/STAT v. 9.4.
Results
The results of statistical analyses are gathered in Supplementary Table S2, and the differences between groups are visualised in Figs 1–11. The box plots generated separately for mRNA and protein levels of each cytokine (Supplementary Figs S1–S22) illustrated within-group variability and revealed remaining outliers, which persisted even after editing and excluding extreme mRNA copy number values.
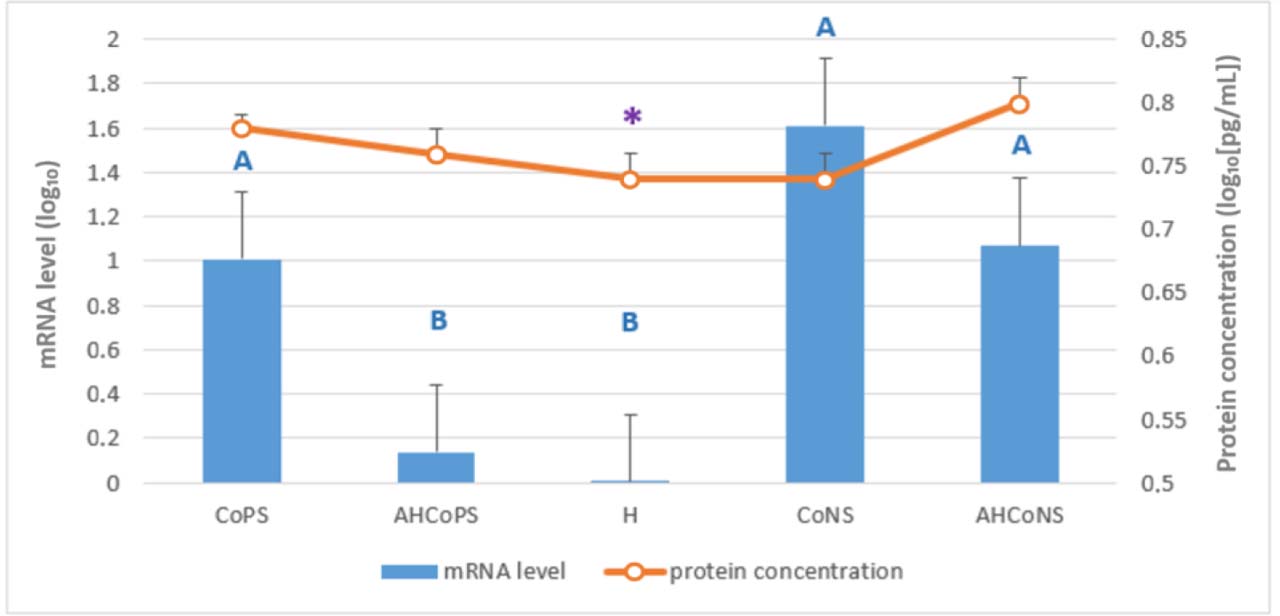
Fig. 1.
Least-squares means estimated from the final linear mixed-effects model for relative mRNA levels of the IL1A gene (bars) and IL-1α protein concentration determined by ELISA (line), both log10-transformed. Tissue was analysed which had been sampled post slaughter from Polish Holstein-Friesian cows between the first and fourth lactation. CoPS – quarters infected with coagulase-positive staphylococci; AHCoPS – healthy quarters adjacent to one infected with CoPS; H – quarters taken from udders healthy in all quarters; CoNS – quarters infected with coagulase-negative staphylococci; AHCoNS – healthy quarters adjacent to one infected with CoNS; * – statistically significant within-group correlation between mRNA and protein levels (Spearman’s rank correlation, P-value ≤ 0.05); A and B – different uppercase letters indicate statistically significant differences between groups (P-value ≤ 0.01)
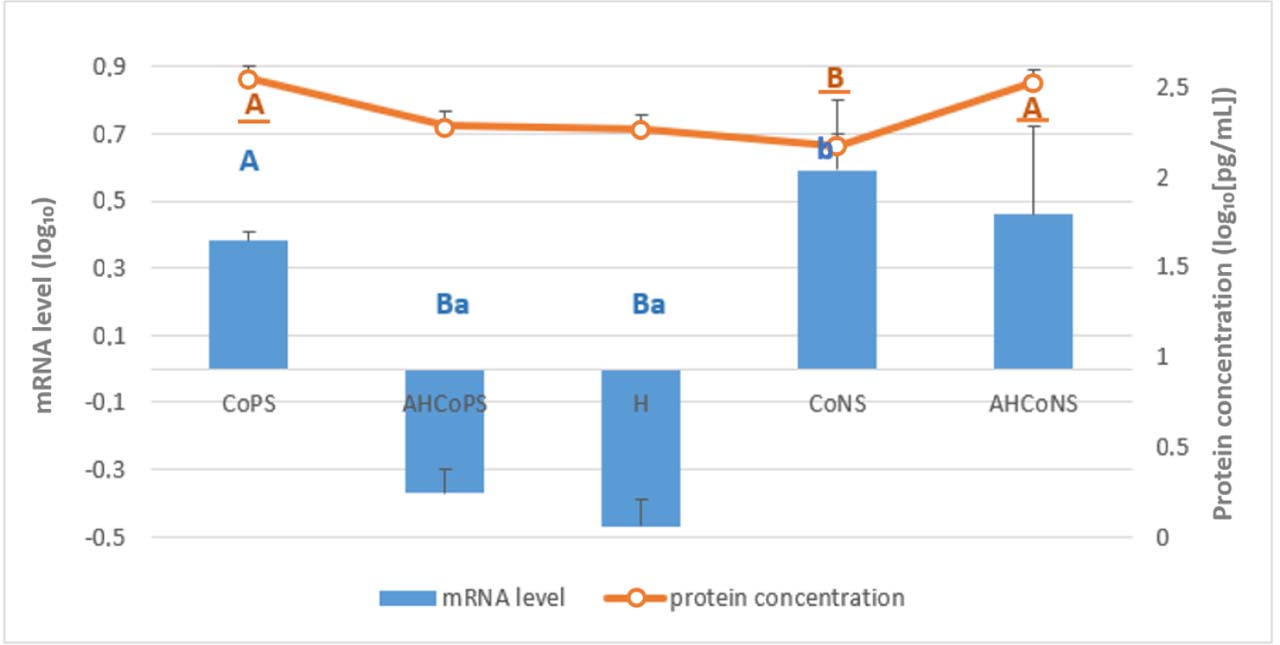
Fig. 2.
Least-squares means estimated from the final linear mixed-effects model for relative mRNA levels of the IL1B gene (bars) and IL-1β protein concentration determined by ELISA (line), both log10-transformed. Tissue was analysed which had been sampled post slaughter from Polish Holstein-Friesian cows between the first and fourth lactation. CoPS – quarters infected with coagulase-positive staphylococci; AHCoPS – healthy quarters adjacent to one infected with CoPS; H – quarters taken from udders healthy in all quarters; CoNS – quarters infected with coagulase-negative staphylococci; AHCoNS – healthy quarters adjacent to one infected with CoNS; A and B – different upper-case letters indicate statistically significant differences between groups (P-value ≤ 0.01); a and b – different lower-case letters indicate statistically significant differences between groups (P-value ≤ 0.05); non-underlined letters – mRNA-level differences; underlined letters – protein-concentration differences
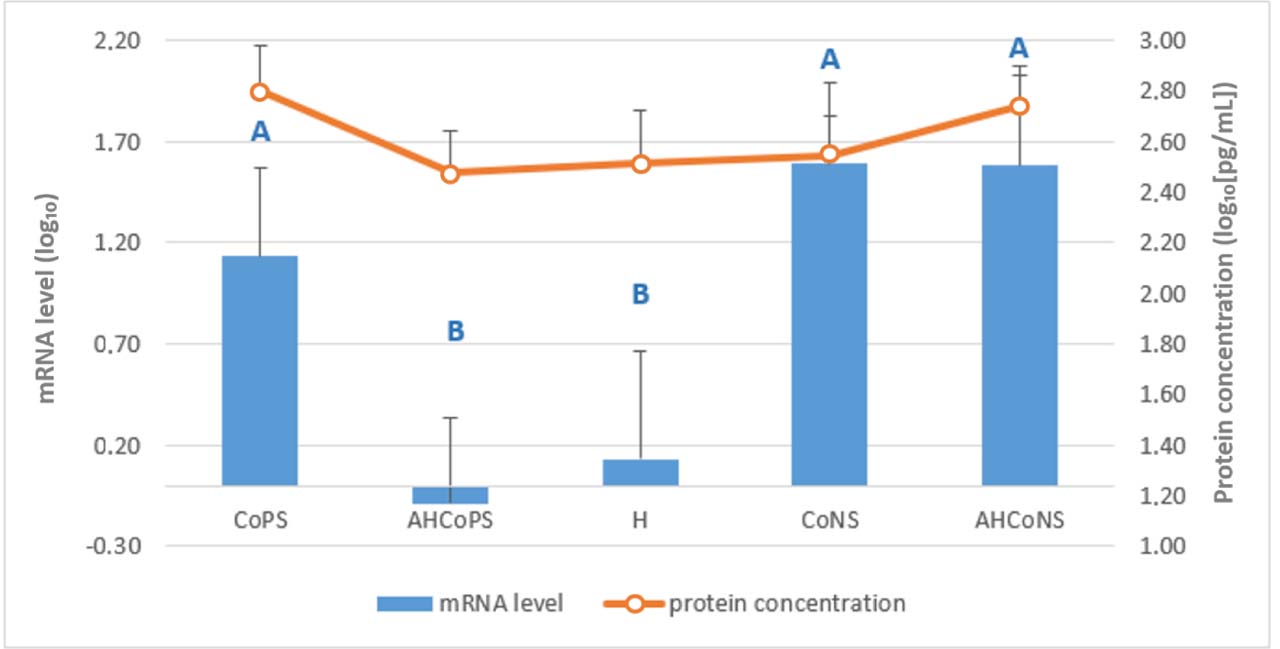
Fig. 3.
Least-squares means estimated from the final linear mixed-effects model for relative mRNA levels of the IL2 gene (bars) and IL-2 protein concentration determined by ELISA (line), both log10-transformed. Tissue was analysed which had been sampled post slaughter from Polish Holstein-Friesian cows between the first and fourth lactation. CoPS – quarters infected with coagulase-positive staphylococci; AHCoPS – healthy quarters adjacent to one infected with CoPS; H – quarters taken from udders healthy in all quarters; CoNS – quarters infected with coagulase-negative staphylococci; AHCoNS – healthy quarters adjacent to one infected with CoNS; A and B – different upper-case letters indicate statistically significant differences between groups (P-value ≤ 0.01)
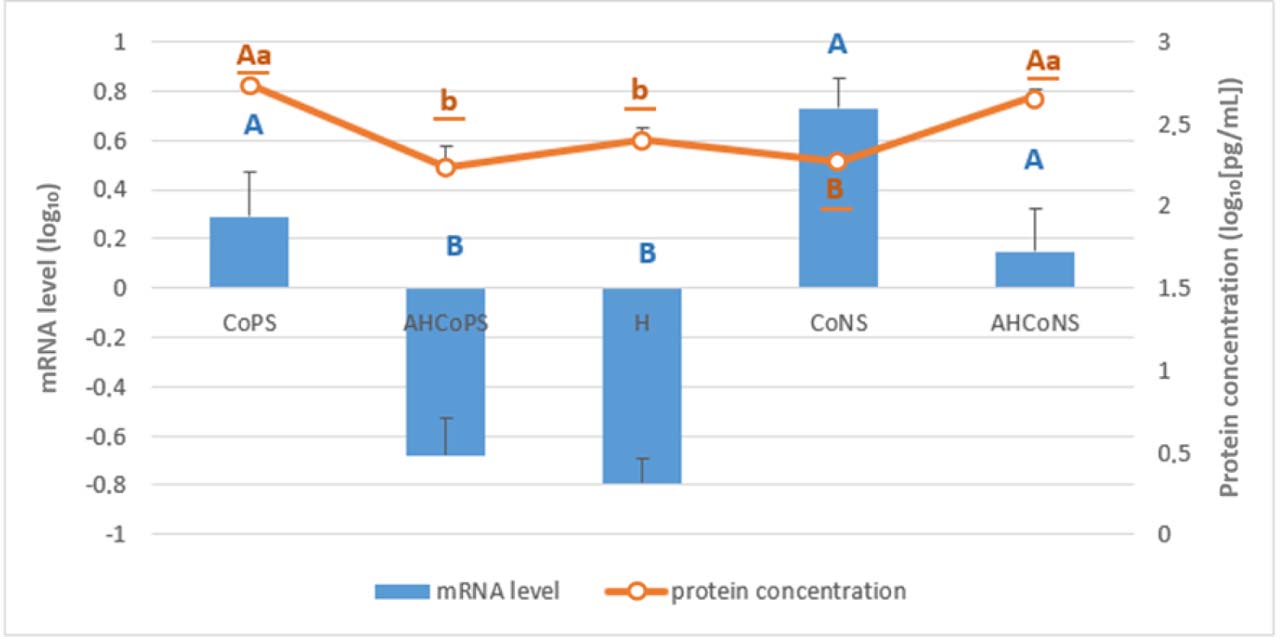
Fig. 4.
Least-squares means estimated from the final linear mixed-effects model for relative mRNA levels of the IL6 gene (bars) and IL-6 protein concentration determined by ELISA (line), both log10-transformed. Tissue was analysed which had been sampled post slaughter from Polish Holstein-Friesian cows between the first and fourth lactation. CoPS – quarters infected with coagulase-positive staphylococci; AHCoPS – healthy quarters adjacent to one infected with CoPS; H – quarters taken from udders healthy in all quarters; CoNS – quarters infected with coagulase-negative staphylococci; AHCoNS – healthy quarters adjacent to one infected with CoNS; A and B – different upper-case letters indicate statistically significant differences between groups (P-value ≤ 0.01); a and b – different lower-case letters indicate statistically significant differences between groups (P-value ≤ 0.05); non-underlined letters – mRNA-level differences; underlined letters – protein-concentration differences
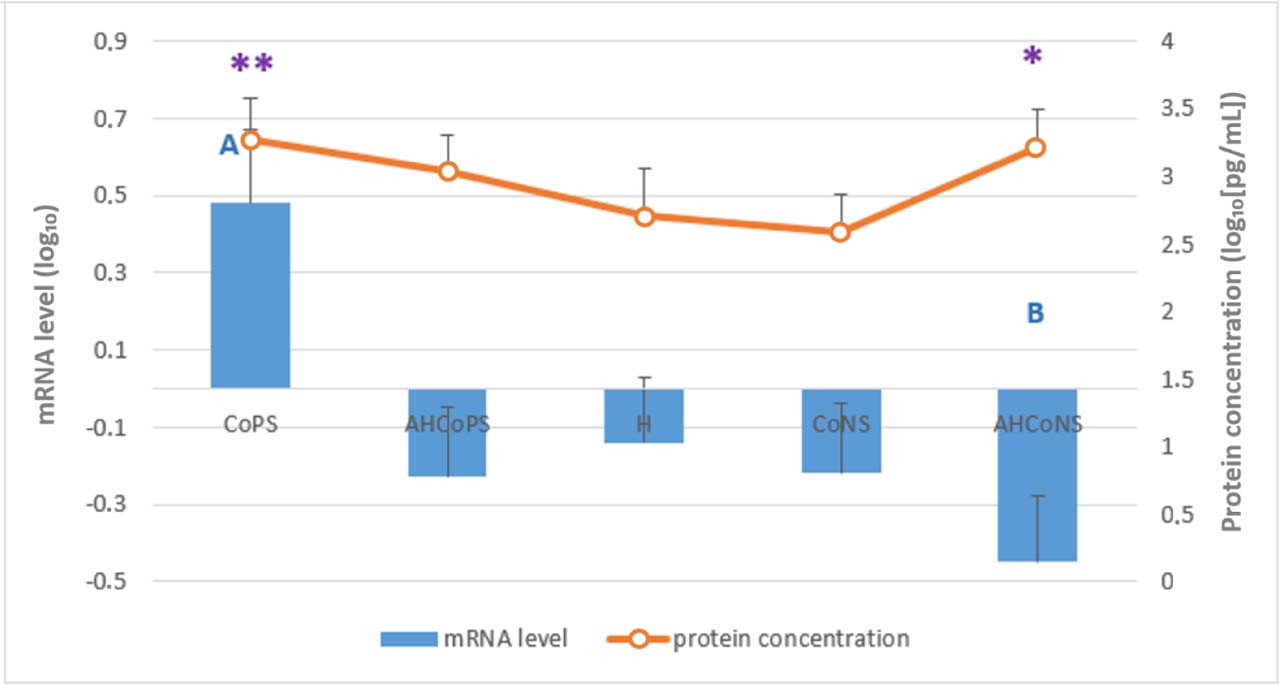
Fig. 5.
Least-squares means estimated from the final linear mixed-effects model for relative mRNA levels of the IL8 gene (bars) and IL-8 protein concentration determined by ELISA (line), both log10-transformed. Tissue was analysed which had been sampled post slaughter from Polish Holstein-Friesian cows between the first and fourth lactation. CoPS – quarters infected with coagulase-positive staphylococci; AHCoPS – healthy quarters adjacent to one infected with CoPS; H – quarters taken from udders healthy in all quarters; CoNS – quarters infected with coagulase-negative staphylococci; AHCoNS – healthy quarters adjacent to one infected with CoNS; * and ** – statistically significant within-group correlation between mRNA and protein levels (Spearman’s rank correlation, P-value ≤ 0.05 (*) or ≤ 0.01 (**)); A and B – different upper-case letters indicate statistically significant differences between groups (P-value ≤ 0.01)
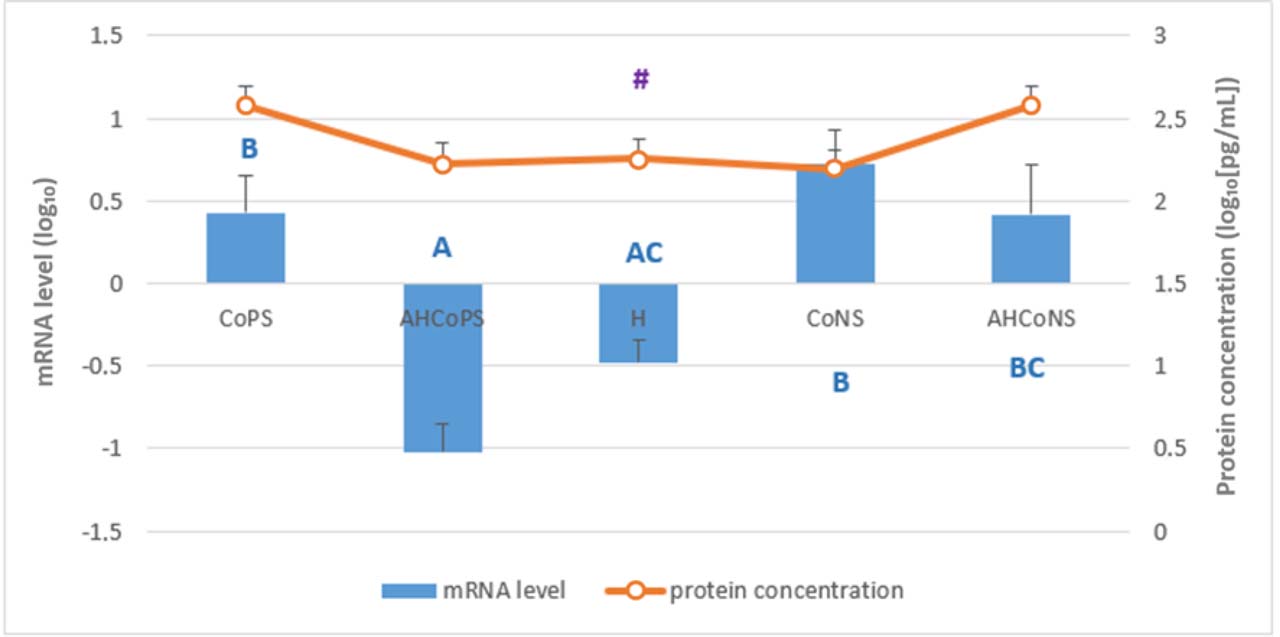
Fig. 6.
Least-squares means estimated from the final linear mixed-effects model for relative mRNA levels of the IL12A gene (bars) and IL-12α protein concentration determined by ELISA (line), both log10-transformed. Tissue was analysed which had been sampled post slaughter from Polish Holstein-Friesian cows between the first and fourth lactation. CoPS – quarters infected with coagulase-positive staphylococci; AHCoPS – healthy quarters adjacent to one infected with CoPS; H – quarters taken from udders healthy in all quarters; CoNS – quarters infected with coagulase-negative staphylococci; AHCoNS – healthy quarters adjacent to one infected with CoNS; # – statistically significant within-group correlation between mRNA and protein levels (Spearman’s rank correlation, P-value ≤ 0.10); A, B and C – different upper-case letters indicate statistically significant differences between groups (P-value ≤ 0.01)
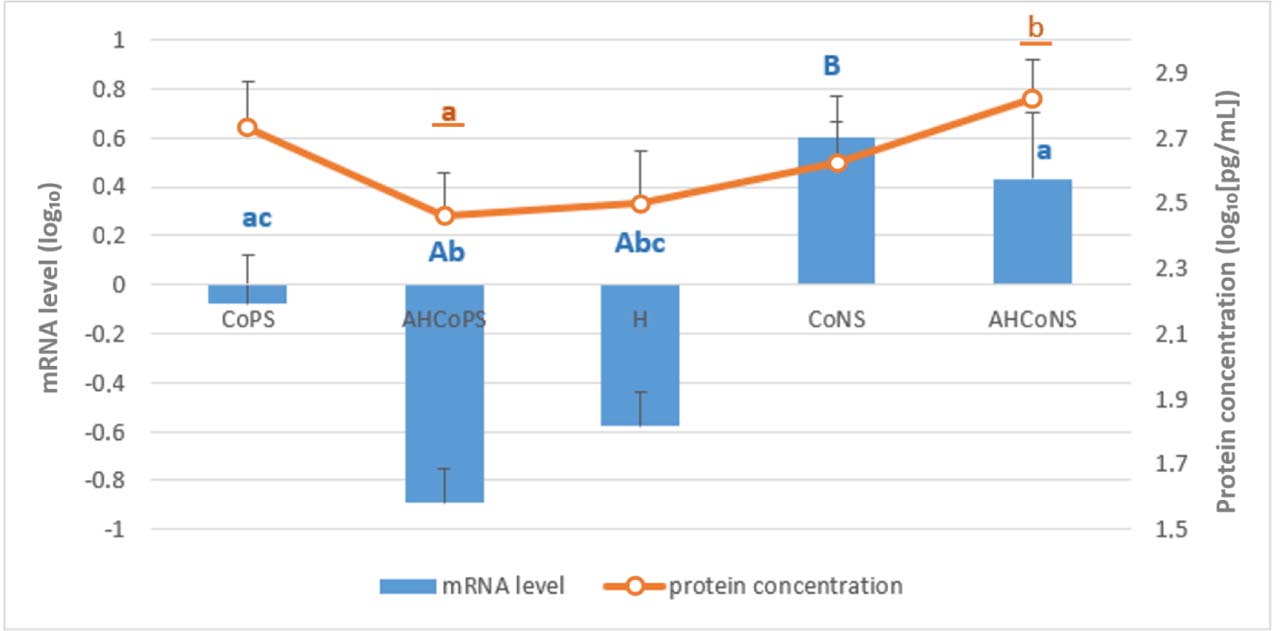
Fig. 7.
Least-squares means estimated from the final linear mixed-effects model for relative mRNA levels of the IL12B gene (bars) and IL-12β protein concentration determined by ELISA (line), both log10-transformed. Tissue was analysed which had been sampled post slaughter from Polish Holstein-Friesian cows between the first and fourth lactation. CoPS – quarters infected with coagulase-positive staphylococci; AHCoPS – healthy quarters adjacent to one infected with CoPS; H – quarters taken from udders healthy in all quarters; CoNS – quarters infected with coagulase-negative staphylococci; AHCoNS – healthy quarters adjacent to one infected with CoNS; A, B and C – different upper-case letters indicate statistically significant differences between groups (P-value ≤ 0.01); a, b and c – different lower-case letters indicate statistically significant differences between groups (P-value ≤ 0.05); non-underlined letters – mRNA-level differences; underlined letters – protein-concentration differences
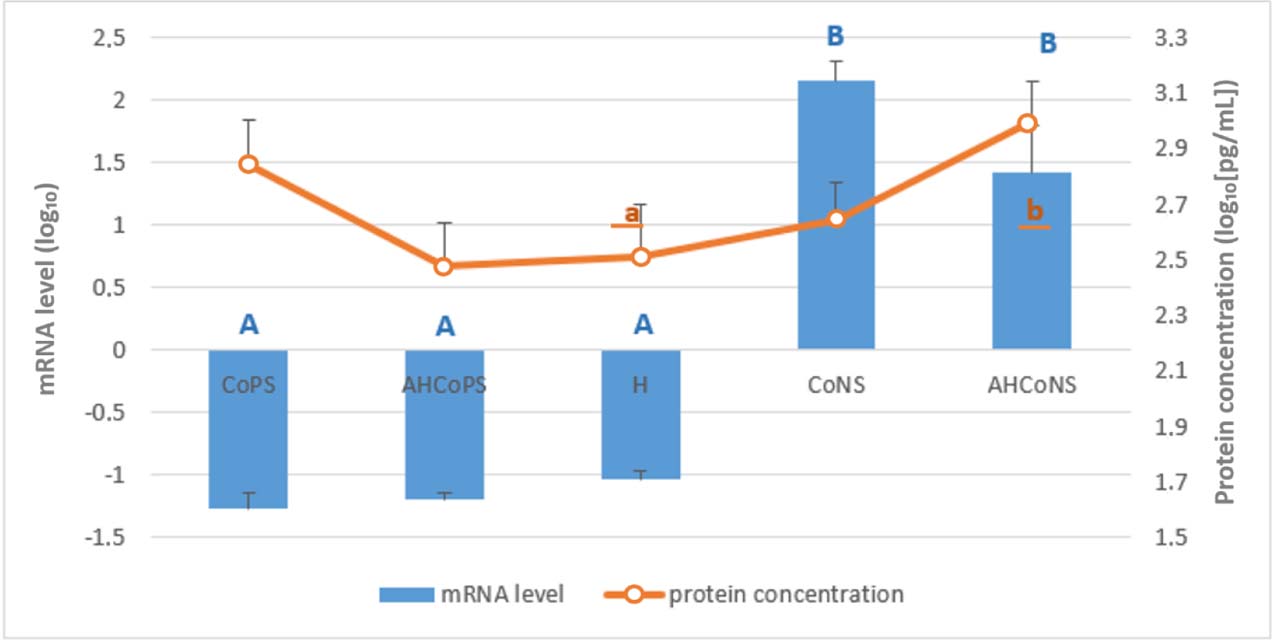
Fig. 8.
Least-squares means estimated from the final linear mixed-effects model for relative mRNA levels of the IL18 gene (bars) and IL-18 protein concentration determined by ELISA (line), both log10-transformed. Tissue was analysed which had been sampled post slaughter from Polish Holstein-Friesian cows between the first and fourth lactation. CoPS – quarters infected with coagulase-positive staphylococci; AHCoPS – healthy quarters adjacent to one infected with CoPS; H – quarters taken from udders healthy in all quarters; CoNS – quarters infected with coagulase-negative staphylococci; AHCoNS – healthy quarters adjacent to one infected with CoNS; A and B – different upper-case letters indicate statistically significant differences between groups (P-value ≤ 0.01); a and b – different lower-case letters indicate statistically significant differences between groups (P-value ≤ 0.05); non-underlined letters – mRNA-level differences; underlined letters – protein-concentration differences
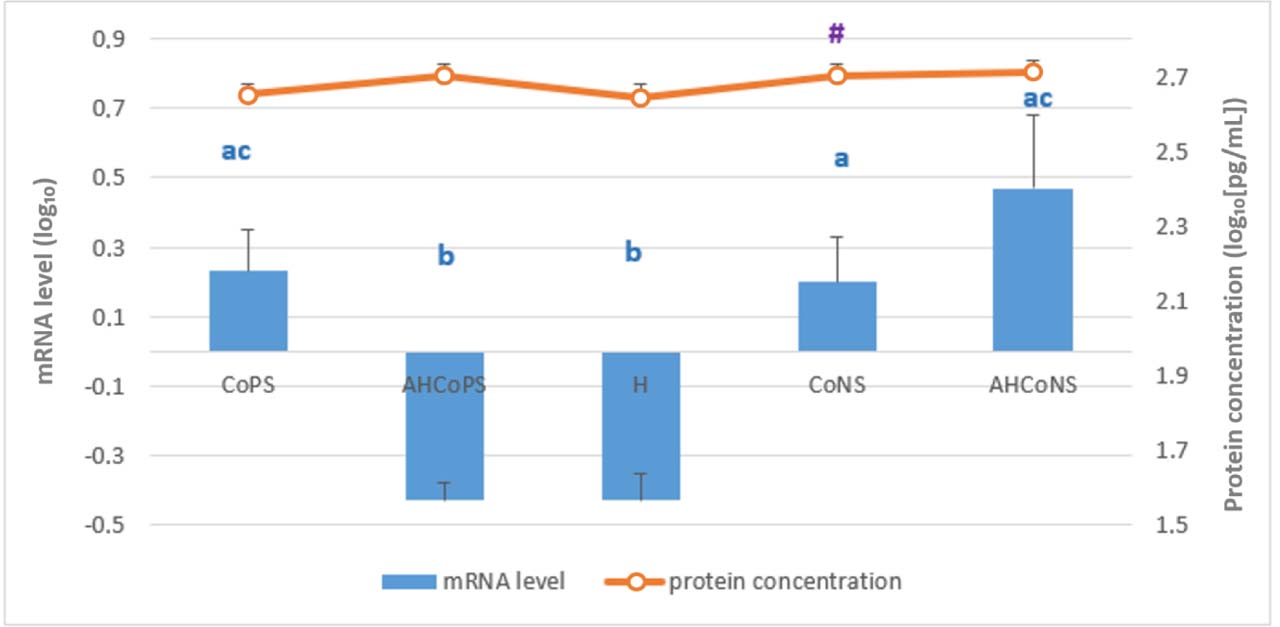
Fig. 9.
Least-squares means estimated from the final linear mixed-effects model for relative mRNA levels of the TNF gene (bars) and TNF-α protein concentration determined by ELISA (line), both log10-transformed. Tissue was analysed which had been sampled post slaughter from Polish Holstein-Friesian cows between the first and fourth lactation. CoPS – quarters infected with coagulase-positive staphylococci; AHCoPS – healthy quarters adjacent to one infected with CoPS; H – quarters taken from udders healthy in all quarters; CoNS – quarters infected with coagulase-negative staphylococci; AHCoNS – healthy quarters adjacent to one infected with CoNS; # – statistically significant within-group correlation between mRNA and protein levels (Spearman’s rank correlation, P-value ≤ 0.10); a, b and c – different lower-case letters indicate statistically significant difference (P-value ≤ 0.05)
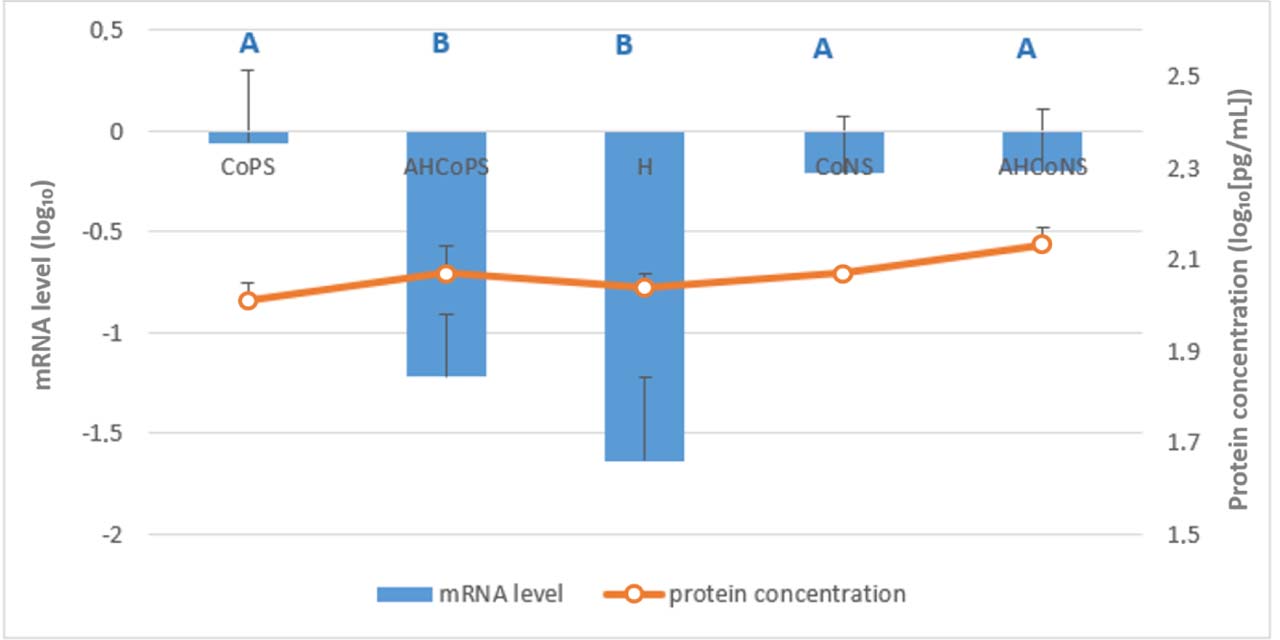
Fig. 10.
Least-squares means estimated from the final linear mixed-effects model for relative mRNA levels of the C-X-C motif chemokine ligand 5 (CXCL5) gene (bars) and CXCL5 protein concentration determined by ELISA (line), both log10-transformed. Tissue was analysed which had been sampled post slaughter from Polish Holstein-Friesian cows between the first and fourth lactation. CoPS – quarters infected with coagulase-positive staphylococci; AHCoPS – healthy quarters adjacent to one infected with CoPS; H – quarters taken from udders healthy in all quarters; CoNS – quarters infected with coagulase-negative staphylococci; AHCoNS – healthy quarters adjacent to one infected with CoNS; A and B – different upper-case letters indicate statistically significant differences between groups (P-value ≤ 0.01)
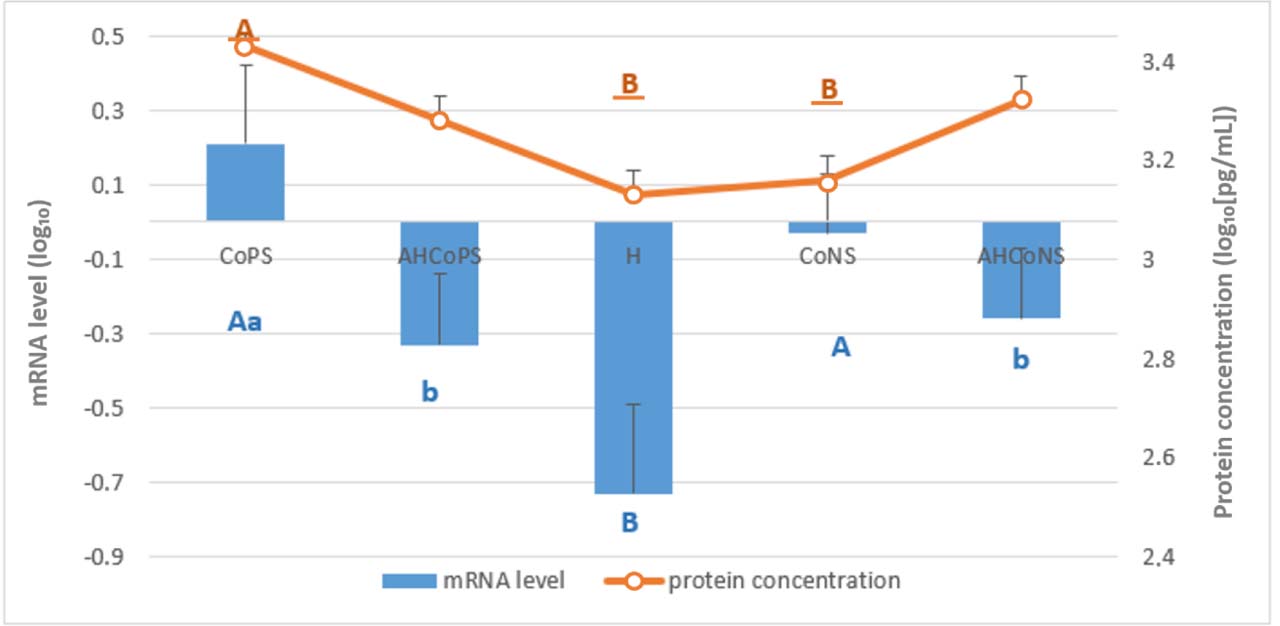
Fig. 11.
Least-squares means estimated from the final linear mixed-effects model for relative mRNA levels of the chemokine growth-regulated oncogene α protein (CXCL1/GROα) gene (bars) and CXCL1 protein concentration determined by ELISA (line), both log10-transformed. Tissue was analysed which had been sampled post slaughter from Polish Holstein-Friesian cows between the first and fourth lactation. CoPS – quarters infected with coagulase-positive staphylococci; AHCoPS – healthy quarters adjacent to one infected with CoPS; H – quarters taken from udders healthy in all quarters; CoNS – quarters infected with coagulase-negative staphylococci; AHCoNS – healthy quarters adjacent to one infected with CoNS; A and B – different upper-case letters indicate statistically significant differences between groups (P-value ≤ 0.01); a and b – different lower-case letters indicate statistically significant differences between groups (P-value ≤ 0.05); non-underlined letters – mRNA-level differences; underlined letters – protein-concentration differences
The AHCoPS group exhibited lower mRNA levels than the CoPS group of all genes except IL18 (Supplementary Table S2). Regarding protein concentrations, the AHCoPS group showed only lower levels of IL-6 (2.24 ± 0.12 vs 2.74 ± 0.02; P-value < 0.05) than CoPS. Except IL1B, IL8, IL12A and CXCL1, the genes exhibited higher mRNA levels in the AHCoNS group than in the H group. Furthermore, all genes except IL8 showed greater expression in the CoNS group than in the H group. However, protein analysis via ELISA revealed a distinct pattern: AHCoNS quarters displayed significantly higher concentrations of IL-1β (2.53 ± 0.07 vs 2.17 ± 0.07, P-value < 0.01) and IL-6 (2.67 ± 0.04 vs 2.27 ± 0.03, P-value < 0.01) than CoNS quarters. Moreover, protein concentrations were also elevated in the AHCoNS group relative to the H group for IL-6 (2.67 ± 0.04 vs 2.40 ± 0.08, P-value < 0.05) and IL-18 (3.00 ± 0.14 vs 2.51 ± 0.19, P-value < 0.05).
Compared with the AHCoPS group, the AHCoNS group demonstrated higher mRNA levels of IL12A, IL12B, IL18, TNF and CXCL5. Similarly, the AHCoNS group showed higher levels of IL-6 (2.67 ± 0.04 vs 2.24 ± 0.12, P-value < 0.005) and IL-18 (3.00 ± 0.14 vs 2.48 ± 0.15, P-value < 0.01) proteins than the AHCoPS group. The CoNS group exhibited higher IL-12β (0.60 ± 0.17 vs −0.08 ± 0.20, P-value < 0.01) and IL-18 (2.15 ± 0.16 vs −1.27 ± 0.12, P-value < 0.01) expression levels, and in contrast less IL-1β (2.17 ± 0.07 vs 2.55 ± 0.07, P-value < 0.01), IL-6 (2.27 ± 0.03 vs 2.74 ± 0.02, P-value < 0.01) and GROα (3.16 ± 0.05 vs 3.43 ± 0.05, P-value < 0.01) protein levels than the CoPS group. Relatively to the H group, the CoPS group had higher mRNA levels for almost all genes (except for IL8) and higher concentrations of IL-6 (2.74 ± 0.02 vs 2.40 ± 0.08, P-value < 0.05), and CXCL1 (3.43 ± 0.05 vs 3.13 ± 0.05, P-value < 0.01).
Spearman’s correlation analysis identified only three significant associations between mRNA and protein levels (Supplementary Table S2). Specifically, correlations were found for IL1A with IL-1α in the H group (−0.79, P-value = 0.036), for IL8 with IL-8 in the CoPS (1.00, P-value ≤ 0.0001) and AHCoNS (−0.90, P-value = 0.037) groups. Except for IL8 with IL-8 in the CoPS group, all significant correlations were negative.
Linear regression analysis confirmed the limited relationship between mRNA and protein levels. Statistically significant regression relationships were identified only for selected gene–cytokine pairs, and none were observed in the AHCoPS group. Detailed results, presenting only the statistically significant regression coefficients (P-value < 0.01 or P-value < 0.05), are presented in Supplementary Table S3. Overall, mRNA expression and protein concentrations showed largely distinct response patterns across the experimental groups, indicating that these two molecular levels provide complementary rather than interchangeable information regarding the local immune response.
Discussion
Our findings indicate that subclinical CoPS infection upregulated IL1A and IL1B without compromising the immune status of AHCoPS quarters. In contrast, CoNS infection increased IL1A and IL1B expression in AHCoNS quarters, while protein concentrations in the infected quarters remained comparable to those in H quarters. These results partially diverge from those reported by Whelehan et al. (65), who observed a slight decrease in IL1B gene expression in the ductal part of tissue from quarters with subclinical inflammation induced by S. aureus in Holstein-Friesian cows. It is important to note that their model relied on an experimentally induced infection using a single, low-virulence strain of S. aureus, and evaluated multiple distinct anatomical regions of the udder parenchyma, which may account for these tissue-specific transcriptional differences compared to our natural, long-term infection field data. While IL-1α is typically not secreted in healthy tissues, it may be released from damaged or necrotic cells (6, 17). A direct comparison of our results with existing literature is challenging, as there is a lack of studies investigating IL1 expression specifically in quarters adjacent to the site of infection.
The IL2 mRNA expression observed in our study likely reflects the activation of both humoral and cellular responses to staphylococcal infection alongside damaged cell clearance (2, 35). Notably, this response was evident even in AHCoNS quarters. However, protein levels remained uniform across groups. In contrast, Riollet et al. (52) did not detect IL-2 even within infected quarters. Furthermore, following experimental infection (32 h) with S. aureus, IL2 mRNA levels were reported to decrease and SCCs to dramatically increase by in excess of 6 × 10⁶ (2). However, they evaluated only pre-infection baselines and restricted neighbouring quarter analysis to SCC, which rose six-fold (up to 1.36 × 10⁵) within 24 h. While Shaheen et al. (56) reported elevated IL-2 concentrations during clinical mastitis, our findings regarding subclinical states present a different pattern. These discrepancies stem from experimental designs. Alluwaimi et al. (2) used an acute, short-term (7–32 h) artificial inoculation model, whereas our data reflect a stabilised, natural chronic subclinical state. Additionally, Riollet et al. (52) analysed isolated milk somatic cells during chronic S. aureus mastitis, rather than the deep mammary parenchyma evaluated here, demonstrating how the sampled cellular population dictates cytokine profiles. Direct comparison is challenging because of the scarcity of studies with a similar experimental design, specifically those analysing both mRNA and protein expression in quarters adjacent to the infection site relative to quarters from entirely healthy udders.
Consistently, Riollet et al. (52) detected both IL6 mRNA and IL-6 protein in milk-derived cells from cows with chronic S. aureus mastitis, but not in healthy controls. Similarly, Whelehan et al. (65) reported a significant IL6 upregulation in the alveolar gland cistern and ductal regions during experimental infection with a low-virulence strain of S. aureus. In contrast, Alluwaimi et al. (2) observed fluctuating mRNA levels after S. aureus inoculation, which dropped at 7 and 32 h but peaked sharply at 24 h post infection compared to the baseline. Furthermore, Vitenberga-Verza et al. (64) presented relatively stable percentages of immunoreactive cells over a 3-d observation of infected herd cows. Interestingly, we found higher IL-6 protein concentrations in AHCoNS than in the directly infected CoNS quarters, suggesting that immune activation may extend beyond the primary site of infection.
Interleukin 8 is secreted by leukocytes, epithelial cells, and fibroblasts. Previously, our research group (30) reported higher IL-8 protein concentration in CoPS than H, despite no mRNA differences. Unlike that study, which analysed only infected-quarter tissue and tissue from udders healthy in all quarters, the present work included clinically healthy quarters adjacent to infected ones. In the present research, no IL8 mRNA expression or IL-8 protein concentration differences were observed among the CoPS, H and AHCoPS groups. While several studies using different S. aureus strains have reported low or undetectable IL8 expression during intramammary infection (6), others have observed different patterns. For instance, Whelehan et al. (65) noted a robust IL8 increase in alveolar tissue and a moderate elevation in the gland cistern during induced CoPS-induced subclinical mastitis.
Our findings regarding the elevated expression of IL12A in the CoPS group and of both IL12 subunits in the CoNS group relative to their expressions in the H group are consistent with the results reported by Riollet et al. (52). These data also partially align with the study by Alluwaimi et al. (2), who observed elevated mRNA levels at 24 h post infection, followed by a sharp decline at 32 h. It should be noted, however, that their study was based on an acute mastitis model, which may account for these temporal differences. In contrast to our current results, the previous study by Kawecka-Grochocka et al. (30) found no differences in mRNA levels between CoPS and H, nor between CoNS and H. Furthermore, they reported IL-18 protein levels to be below the detection limit. These discrepancies may stem from methodological differences; specifically, the prior work employed diagnostic kits from different manufacturers, omitted sample sonication and did not include clinically healthy quarters. As reported by Culshaw et al. (14), IL-18 production in response to S. aureus-induced mastitis may be associated with increased mortality in affected animals. Our findings regarding the presence of TNF-α in animals with chronic intramammary inflammation are consistent with those of Riollet et al. (52). In contrast, Whelehan et al. (65) did not observe significant differences in TNF expression across any of the four analysed udder tissue regions in a subclinical S. aureus mastitis model. These findings are partly consistent with our previous study (30), in which it was also reported that no differences were observable in TNF mRNA levels in the parenchyma between infected and healthy quarters. Notably, in that study, TNF-α protein remained undetectable across all groups. Furthermore, Alluwaimi et al. (2) observed a fluctuating mRNA level of this gene, which decreased at 7 and 32 h post-infection but was at the baseline at 24 h.
Interestingly, our data indicate that CXCL5 expression was upregulated and CXCL5 secretion increased in the CoPS group, and that the gene’s expression was upregulated in CoNS and AHCoNS groups compared to H. The CoPS group’s higher gene expression and protein secretion contrasted with the findings of our previous study (30). The comparability of the CXCL5 mRNA levels in the CoNS and AHCoNS groups suggests a consistent inflammatory response extending to adjacent quarters. Notably, such a reaction was absent in the coagulase-positive staphylococci-infected and healthy adjacent tissue pair, where mRNA levels in AHCoPS remained similar to those in H despite the CoPS upregulation.
Our findings regarding the expression of the CXCL1 (GROα) gene are consistent with those of Rainard et al. (48), who demonstrated that lipoteichoic acid infusion increases milk CXCL1 concentration during the initial hours of the inflammatory response.
Coagulase-negative staphylococcal agents, such as S. epidermidis and S. chromogenes, are generally less virulent than S. aureus and lack many of its aggressive toxins. However, CoNS can persist within the mammary gland by forming biofilms and evading immune surveillance (41). While CoNS infections typically elicit a milder inflammatory response in the primary infected quarter (47), our findings suggest that they may simultaneously immunologically prime neighbouring uninfected quarters. Nevertheless, the contrasting immune patterns characterised by an intense, localised reaction during CoPS infection versus a milder but more dispersed response during CoNS infection may reflect fundamental differences in bacterial virulence strategies and mediation of the host’s ability to compartmentalise inflammation within the udder by the specific agent. Our results show reduced expression of some cytokine genes in AHCoPS relative to H, possibly due to a trade-off in cytokine production favouring the infected CoPS quarter. Conversely, CoNS infection had a stronger impact on the adjacent quarter, potentiating secretion of several cytokines in AHCoNS. This reinforces the theory that mastitis in one quarter influences the immune landscape of its neighbours, challenging the notion of the udder as four independent units. Therefore, using neighbouring uninfected quarters as internal controls may introduce substantial experimental error. Further research is necessary to confirm these observations.
Several studies have shown that mRNA expression of a particular gene often correlates poorly with the concentration of the associated protein, because protein synthesis is regulated at multiple post-transcriptional, translational and post-translational levels (4, 11, 25, 29, 40, 51, 53, 58, 66). Therefore, transcriptomic and proteomic analyses should be regarded as complementary rather than interchangeable approaches. Post-translational modifications and regulatory mechanisms also play a critical role in determining final protein abundance (37, 40, 57). Consequently, transcriptomic profiles alone do not reliably predict the functional proteomic landscape of staphylococcal mastitis, necessitating integrated multi-omics approaches for an accurate assessment of the local immune response (19, 36).
The observed discrepancy between a cytokine gene’s mRNA abundance and its respective protein concentration highlights a complex decoupling of transcriptional and translational processes during staphylococcal mastitis. Unlike the acute response to Gram-negative pathogens, a subclinical state is the frequent result of staphylococcal colonisation, characterised by attenuated inflammatory signalling. This pathogen-specific modulation suggests that staphylococci may actively exploit host post-transcriptional buffering. This decoupling may be driven by the induction of specific microRNAs, such as bta-mir-223 and bta-mir-21-3p (19), which post-transcriptionally repress host immune mediators, preventing their translation despite high steady-state mRNA levels. Therefore, evaluating both molecular levels provides vital complementary datasets rather than redundant information.
The regression analyses also demonstrated differences between the mRNA expression and protein abundance levels. Specifically, only a single cytokine exhibited a significant relationship between mRNA abundance and protein concentration, regardless of which was treated as the independent or dependent variable. These findings further support that mRNA expression and protein concentrations provide complementary rather than interchangeable information regarding the local immune response. Future studies integrating transcriptomic, proteomic and miRNA analyses may help explain these relationships.
Notably, few studies have examined the precise concentrations and expression profiles of cytokines in subclinical and chronic mastitis. Most research focused on cytokine levels in milk during clinical cases, whereas data from the udder parenchyma, i.e. the primary site of inflammation and cytokine synthesis, remain scarce. This limits the scope for direct comparisons with our findings. A key advantage of the present study is the inclusion of clinically healthy quarters adjacent to infected ones. Our analyses revealed that subclinical staphylococcal infection affects not only the directly infected quarters but also the neighbouring clinically healthy tissues, indicating that these tissues are not immunologically equivalent to quarters originating from entirely healthy udders.
Nevertheless, further research is warranted to confirm our findings and to determine whether the immunological alterations observed in adjacent clinically healthy quarters represent a general feature of subclinical mastitis. Such investigations should include studies of a broader range of immune-related genes and proteins to provide a more comprehensive characterisation of the local immune response. Furthermore, greater attention should be given to infections caused by CoNS, which, in our study, appeared to have a broader impact on the immune status of the entire udder, including adjacent clinically healthy quarters. Comprehensive characterisation of the immune response in bovine mastitis requires integration of transcriptomic and proteomic data, as these approaches provide complementary information. Such integrated analyses may improve our understanding of immune activation not only in infected quarters but also in adjacent clinically healthy mammary glands.
Conclusion
Our findings suggest that mammary gland quarters in PHF cows are not fully independent, and that using adjacent quarters as research negative controls may therefore be unsuitable, depending on the objectives. This systemic-like distribution of immune signalling within the organ may be associated with the diffusion of cytokines or chemotactic factors across the connective-tissue barriers that separate individual quarters. Similar immune response patterns were observed following both CoPS and CoNS infections, although more pronounced cytokine responses occurred in quarters adjacent to the CoNS-infected ones. The combined assessment of cytokine gene expression and protein concentrations provided complementary information on the local immune response, emphasising the value of integrating both molecular levels in future studies. Future research should integrate transcriptomic and proteomic analyses to further characterise immune responses within the entire udder. Ultimately, a holistic shift towards understanding udder-wide physiological processes is essential for improving milk safety and mitigating mastitis-related risks to both animal welfare and public health.
Notes
[3] Conflict of Interests Statement:
The authors declare that there is no conflict of interests regarding the publication of this article.
[4] Financial Disclosure Statement:
The study was financed by the National Science Centre, Poland, PRELUDIUM BIS 2 Grant, No.: NCN, 2020/39/O/NZ9/02519. Most reagents and laboratory materials were funded under this grant. The funder had no role in the design of the study in the collection, analysis, or interpretation of the data or in the manuscript preparation.
[5] Animal Rights Statement:
Ethical approval was not required for this study, as the collection of tissue samples was performed post-mortem from animals slaughtered for commercial purposes, not for experimental use. The sampling was conducted with the permission of the slaughterhouse owner/carcass owner in accordance with relevant regulations and ethical standards (according to Directive 2010/63/EU).
[6] CRediT Authorship Contribution Statement:
Adrianna Szprynca: collection and assembly of data, data analysis and interpretation, writing the article, final approval of the article. Magdalena Zalewska: critical revision of the article. Magdalena Rzewuska: data analysis and interpretation, critical revision of the article. Tomasz Sakowski: critical revision of the article. Emilia Bagnicka: research concept and design, collection and assembly of data, data analysis and interpretation, critical revision of the article, final approval of the article.