
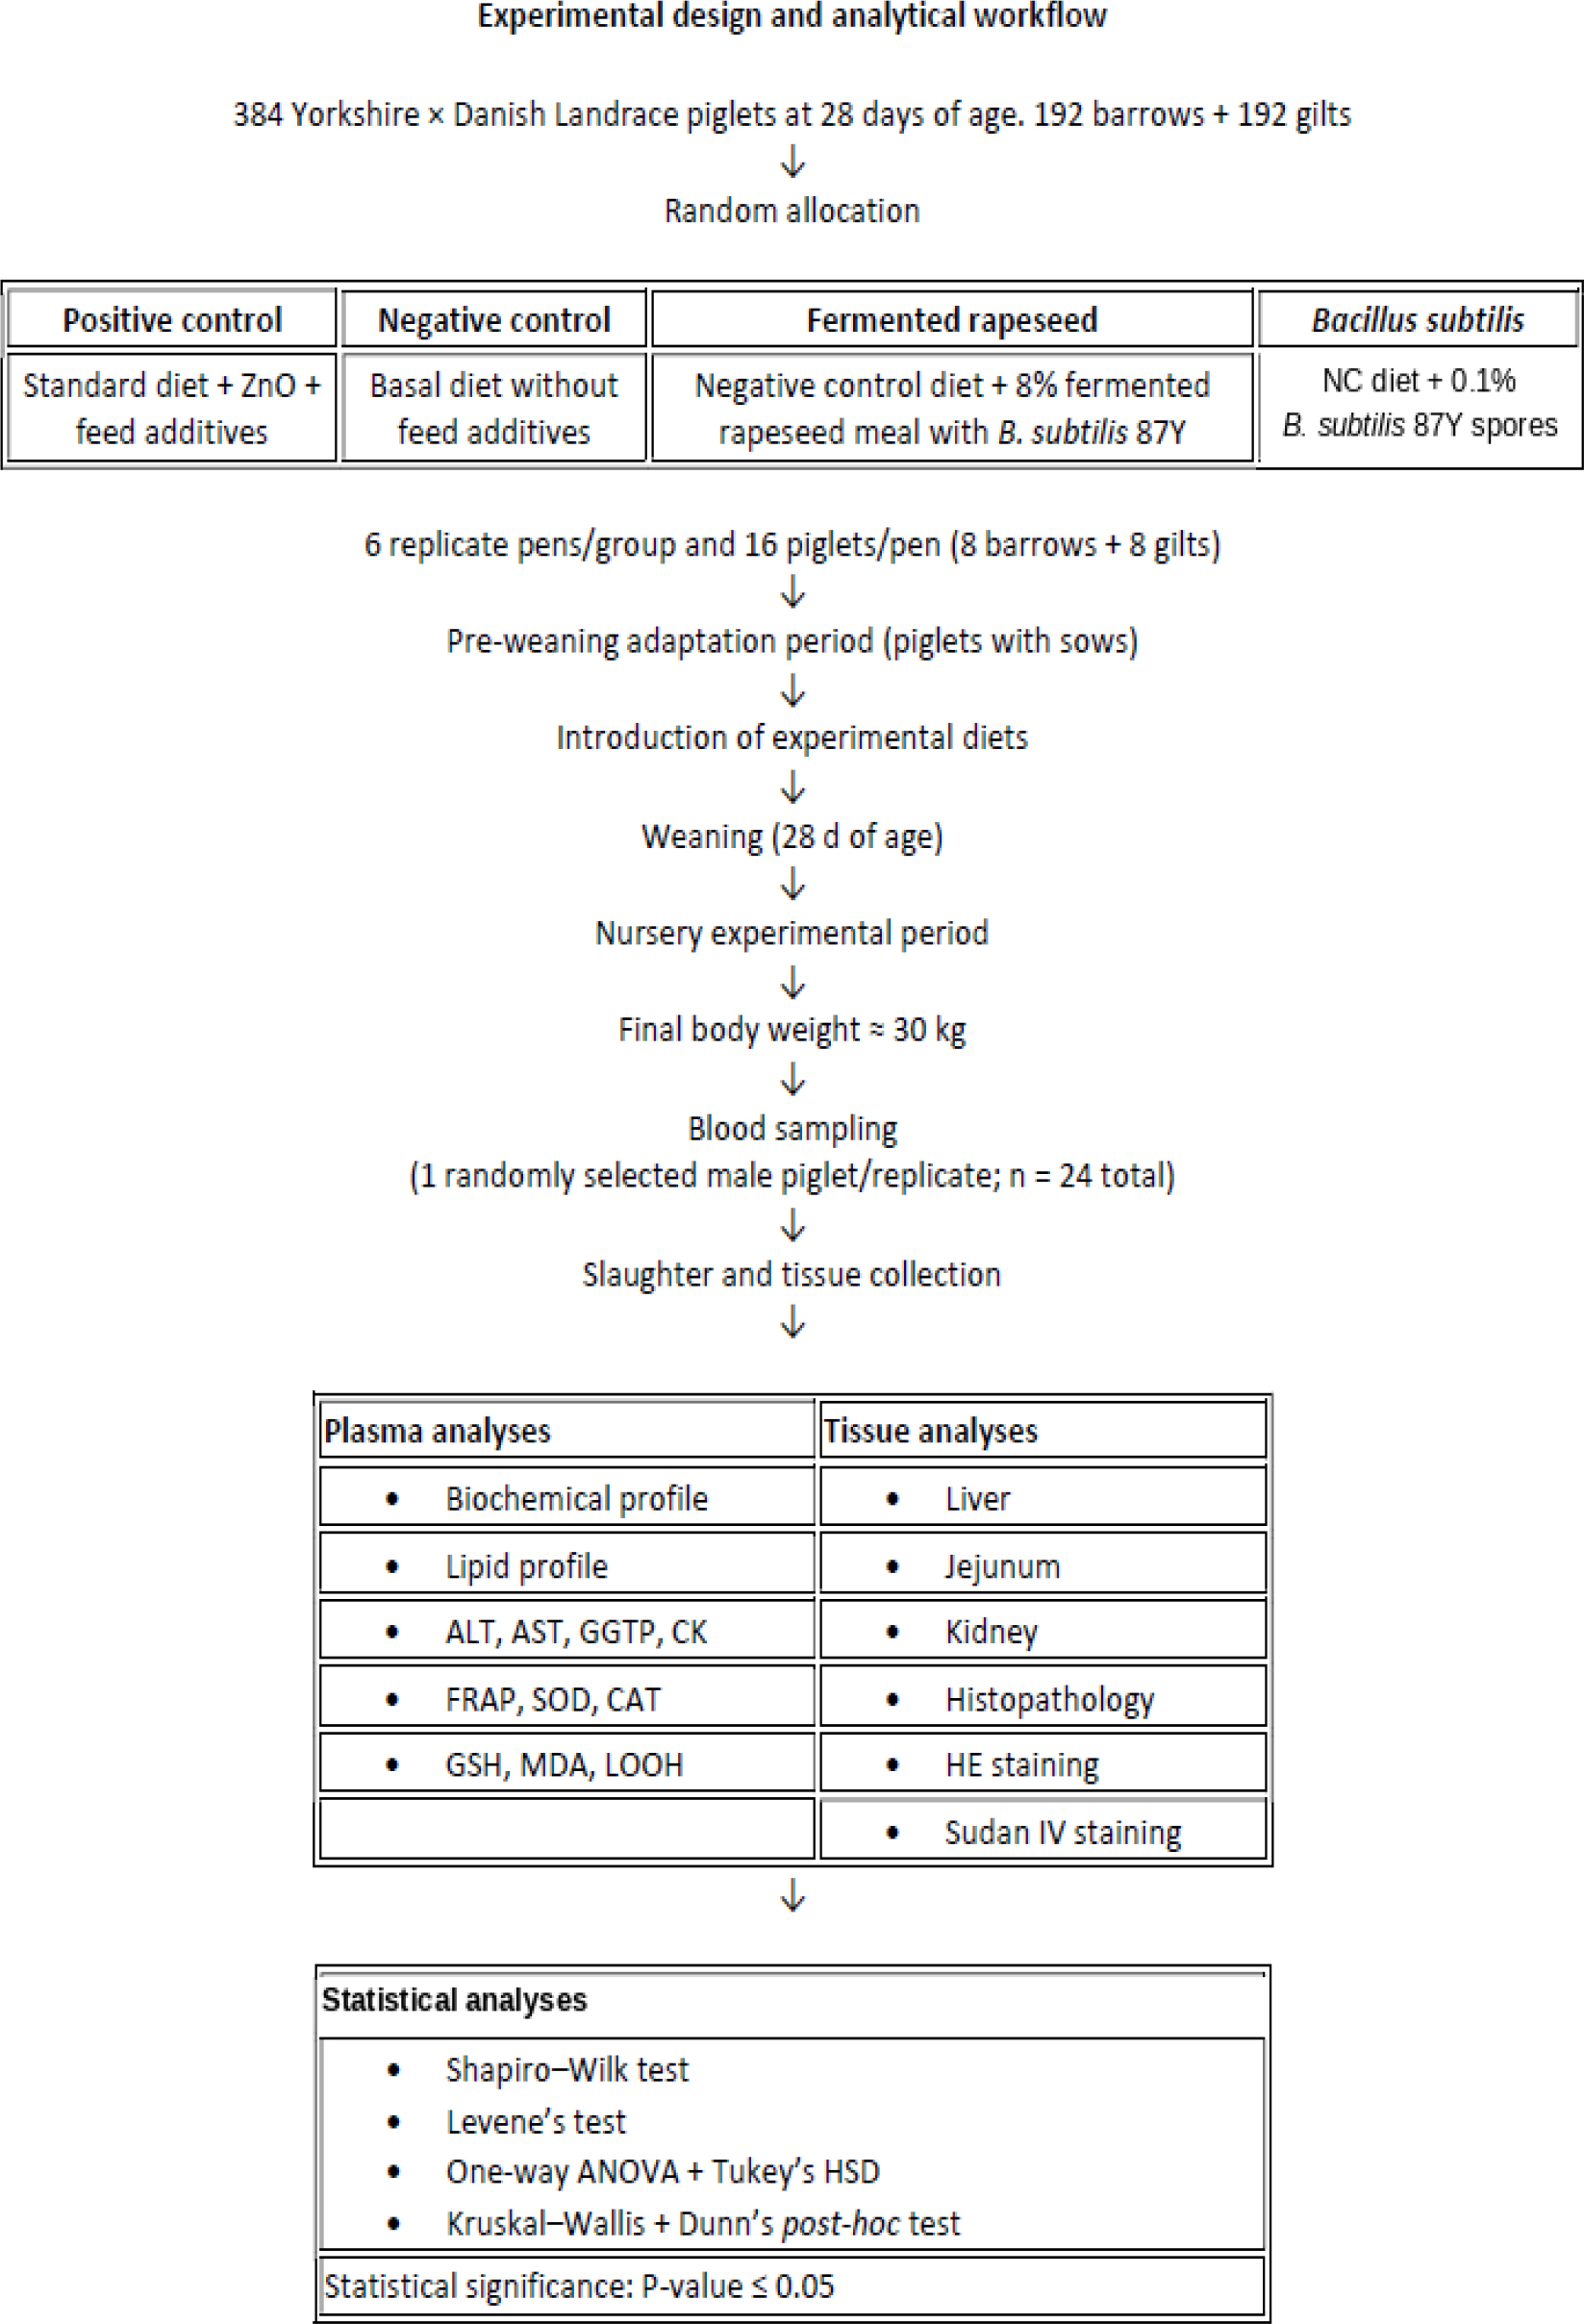
Fig. 1.
Schematic overview of the experimental design, dietary treatments, sampling procedures and analytical workflow used to evaluate the effects of Bacillus subtilis 87Y administered in different delivery forms in peri-weaning piglets. ZnO – zinc oxide; NC – negative control; B. subtilis – Bacillus subtilis; ALT – alanine aminotransferase; AST – aspartate aminotransferase; GGTP – γ-glutamyltransferase; CK – creatine kinase; FRAP – ferric-reducing antioxidant power; SOD – superoxide dismutase; CAT – catalase; GSH – glutathione; MDA – malondialdehyde; LOOH – lipid hydroperoxides; HE – haematoxylin and eosin; ANOVA – analysis of variance; HSD – honestly significant difference
Table 1.
Concentrations of antioxidant and pro-oxidant markers in plasma and hepatic and intestinal tissues of piglets
| Marker | Positive control group | Negative control group | Fermented rapeseed meal group | Bacillus subtilis group | P-value | SEM |
|---|---|---|---|---|---|---|
| Plasma SOD (U/mL) | 8.82 ± 0.537ab | 6.10 ± 0.821c | 8.51 ± 0.746bc | 9.72 ± 0.255a | < 0.001 | 0.304 |
| Plasma CAT (U/mL) | 18.65 ± 1.87b | 20.90 ± 0.926b | 25.60 ± 1.78a | 23.53 ± 0.710a | <0.001 | 0.611 |
| Plasma FRAP (μmol/L) | 10.66 ± 1.51a | 8.21 ± 1.59b | 11.10 ± 2.39a | 10.81 ± 1.99a | <0.001 | 0.862 |
| Plasma GSH (μmol/L) | 0.640 ± 0.084b | 0.679 ± 0.083b | 0.709 ± 0.078ab | 0.826 ± 0.060a | 0.003 | 0.021 |
| Plasma MDA (μmol/L) | 3.65 ± 0.213b | 4.66 ± 0.408a | 2.27 ± 0.187c | 2.16 ± 0.251c | <0.001 | 0.223 |
| Plasma LOOH (μmol/L) | 1.89 ± 0.064a | 1.83 ± 0.093ab | 1.75 ± 0.058b | 1.74 ± 0.060b | 0.001 | 0.019 |
| Liver SOD (U/g) | 74.15 ± 0.837b | 78.55 ± 1.55a | 79.18 ± 0.604a | 77.06 ± 1.47a | <0.001 | 0.567 |
| Liver CAT (U/g) | 271.3 ± 34.79bc | 259.5 ± 25.94c | 323.4 ± 23.91ab | 340.4 ± 21.71a | 0.003 | 10.67 |
| Liver GSH (μmol/g) | 1.15 ± 0.076b | 1.07 ± 0.097b | 1.15 ± 0.097b | 1.45 ± 0.068a | <0.001 | 0.042 |
| Liver MDA (μmol/g) | 3.74 ± 0.286b | 4.40 ± 0.176a | 3.31 ± 0.157c | 3.21 ± 0.168c | <0.001 | 0.129 |
| Liver LOOH (μmol/g) | 1.33 ± 0.045ab | 1.34 ± 0.017a | 1.26 ± 0.040b | 1.29 ± 0.021ab | 0.027 | 0.011 |
| Jejunum SOD (U/g) | 61.66 ± 6.35a | 56.91 ± 3.82ab | 64.63 ± 4.15a | 51.79 ± 4.55b | 0.009 | 1.53 |
| Jejunum CAT (U/g) | 117.7 ± 11.39b | 116.7 ± 30.85b | 154.5 ± 38.89b | 209.8 ± 27.10a | 0.001 | 10.35 |
| Jejunum GSH (μmol/g) | 3.82 ± 0.358a | 3.04 ± 0.164b | 1.25 ± 0.065c | 2.72 ± 0.157b | <0.001 | 0.237 |
| Jejunum MDA (μmol/g) | 1.41 ± 0.021a | 1.35 ± 0.037b | 1.30 ± 0.026c | 1.28 ± 0.015c | <0.001 | 0.014 |
| Jejunum LOOH (μmol/g) | 1.94 ± 0.204a | 1.23 ± 0.120c | 1.56 ± 0.235bc | 1.82 ± 0.198ab | <0.001 | 0.075 |
Positive control group – weaned piglets receiving a standard diet with feed additives and ZnO; negative control group – weaned piglets receiving the same diet as the positive control group but without feed additives or ZnO–fermented rapeseed meal group – weaned piglets receiving the same diet as the negative control group but with 8% content of this meal and Bacillus subtilis 87Y; Bacillus subtilis group – weaned piglets receiving the same diet as the negative control group with 0.1% Bacillus subtilis 87Y; SOD – superoxide dismutase; CAT – catalase; FRAP – ferric-reducing ability of plasma; GSH – glutathione; MDA – malondialdehyde; LOOH – lipid hydroperoxides;
Table 2.
Biochemical and enzymatic parameters in piglet plasma
| Biomarker/enzyme | Positive control group | Negative control group | Fermented rapeseed meal group | Bacillus subtilis group | P-value | SEM |
|---|---|---|---|---|---|---|
| Glu (mmol/L) | 5.58 ± 0.291a | 5.47 ± 0.260a | 5.35 ± 0.257a | 4.61 ± 0.286b | <0.001 | 0.095 |
| TP (g/L) | 64.02 ± 3.10b | 63.13 ± 6.09b | 72.08 ± 2.26a | 73.93 ± 2.70a | <0.001 | 1.24 |
| ALB (g/L) | 29.52 ± 3.07 | 29.85 ± 3.60 | 32.70 ± 2.33 | 34.08 ± 3.59 | 0.060 | 0.728 |
| GLOB (g/L) | 34.50 ± 2.69b | 33.28 ± 5.73b | 39.38 ± 2.25a | 39.85 ± 5.78a | 0.047 | 1.04 |
| ALB/GLOB | 0.863 ± 0.146 | 0.919 ± 0.191 | 0.834 ± 0.094 | 0.877 ± 0.189 | 0.831 | 0.031 |
| Urea (mmol/L) | 5.11 ± 0.653a | 3.61 ± 0.087b | 3.55 ± 0.190b | 5.16 ± 0.717a | <0.001 | 0.188 |
| CREAT (μmol/L) | 74.26 ± 6.87b | 85.16 ± 7.04a | 69.69 ± 4.35b | 75.73 ± 6.91ab | 0.004 | 1.69 |
| BIL (μmol/L) | 2.88 ± 0.768 | 2.59 ± 0.070 | 2.62 ± 0.140 | 2.59 ± 0.070 | 0.539 | 0.079 |
| CHOL (mmol/L) | 1.87 ± 0.100 | 1.89 ± 0.076 | 1.85 ± 0.097 | 1.78 ± 0.151 | 0.348 | 0.023 |
| HDL (mmol/L) | 1.15 ± 0.102b | 1.15 ± 0.072b | 1.31 ± 0.090a | 1.24 ± 0.132ab | 0.037 | 0.024 |
| LDL (mmol/L) | 0.571 ± 0.082a | 0.582 ± 0.091a | 0.408 ± 0.098b | 0.415 ± 0.035b | 0.001 | 0.023 |
| % HDL | 61.42 ± 3.79b | 60.68 ± 3.80b | 70.72 ± 3.89a | 69.60 ± 2.61a | <0.001 | 1.171 |
| HDL:CHOL | 0.614 ± 0.038b | 0.607 ± 0.022b | 0.707 ± 0.027a | 0.696 ± 0.026a | <0.001 | 0.012 |
| TG (mmol/L) | 0.332 ± 0.047ab | 0.355 ± 0.058a | 0.294 ± 0.048ab | 0.273 ± 0.034b | 0.030 | 0.011 |
| ALT (U/L) | 28.58 ± 2.96b | 41.03 ± 1.88a | 37.78 ± 1.16a | 41.10 ± 1.80a | <0.001 | 1.14 |
| AST (U/L) | 46.27 ± 2.32bc | 44.32 ± 3.15c | 49.73 ± 1.81ab | 51.17 ± 3.59a | 0.001 | 0.778 |
| LDH (U/L) | 649.8 ± 64.80 | 687.3 ± 83.60 | 727.2 ± 54.35 | 680.3 ± 57.61 | 0.275 | 13.83 |
| CK (U/L) | 1,253.3 ± 101.6b | 1,589.0 ± 140.07a | 528.2 ± 50.87d | 708.2 ± 52.52c | <0.001 | 90.09 |
| GGTP (U/L) | 18.44 ± 1.35b | 33.33 ± 3.31a | 29.64 ± 3.42a | 32.24 ± 2.41a | <0.001 | 1.34 |
Positive control group – weaned piglets receiving a standard diet with feed additives and ZnO; negative control group – weaned piglets receiving the same diet as the positive control group but without feed additives or ZnO – fermented rapeseed meal group – weaned piglets receiving the same diet as the negative control group but with 8% content of this meal and Bacillus subtilis 87Y; Bacillus subtilis group – weaned piglets receiving the same diet as the negative control group with 0.1% Bacillus subtilis 87Y; Glu – glucose; TP – total protein; ALB – albumin; GLOB – globulins; CREAT – creatinine; BIL – bilirubin; CHOL – total cholesterol; HDL – high-density lipoprotein cholesterol; LDL – low-density lipoprotein cholesterol; TG – triacylglycerols; ALT – alanine aminotransferase; AST – aspartate aminotransferase; LDH – lactate dehydrogenase; CK – creatine kinase; GGTP – gamma-glutamyltransferase;
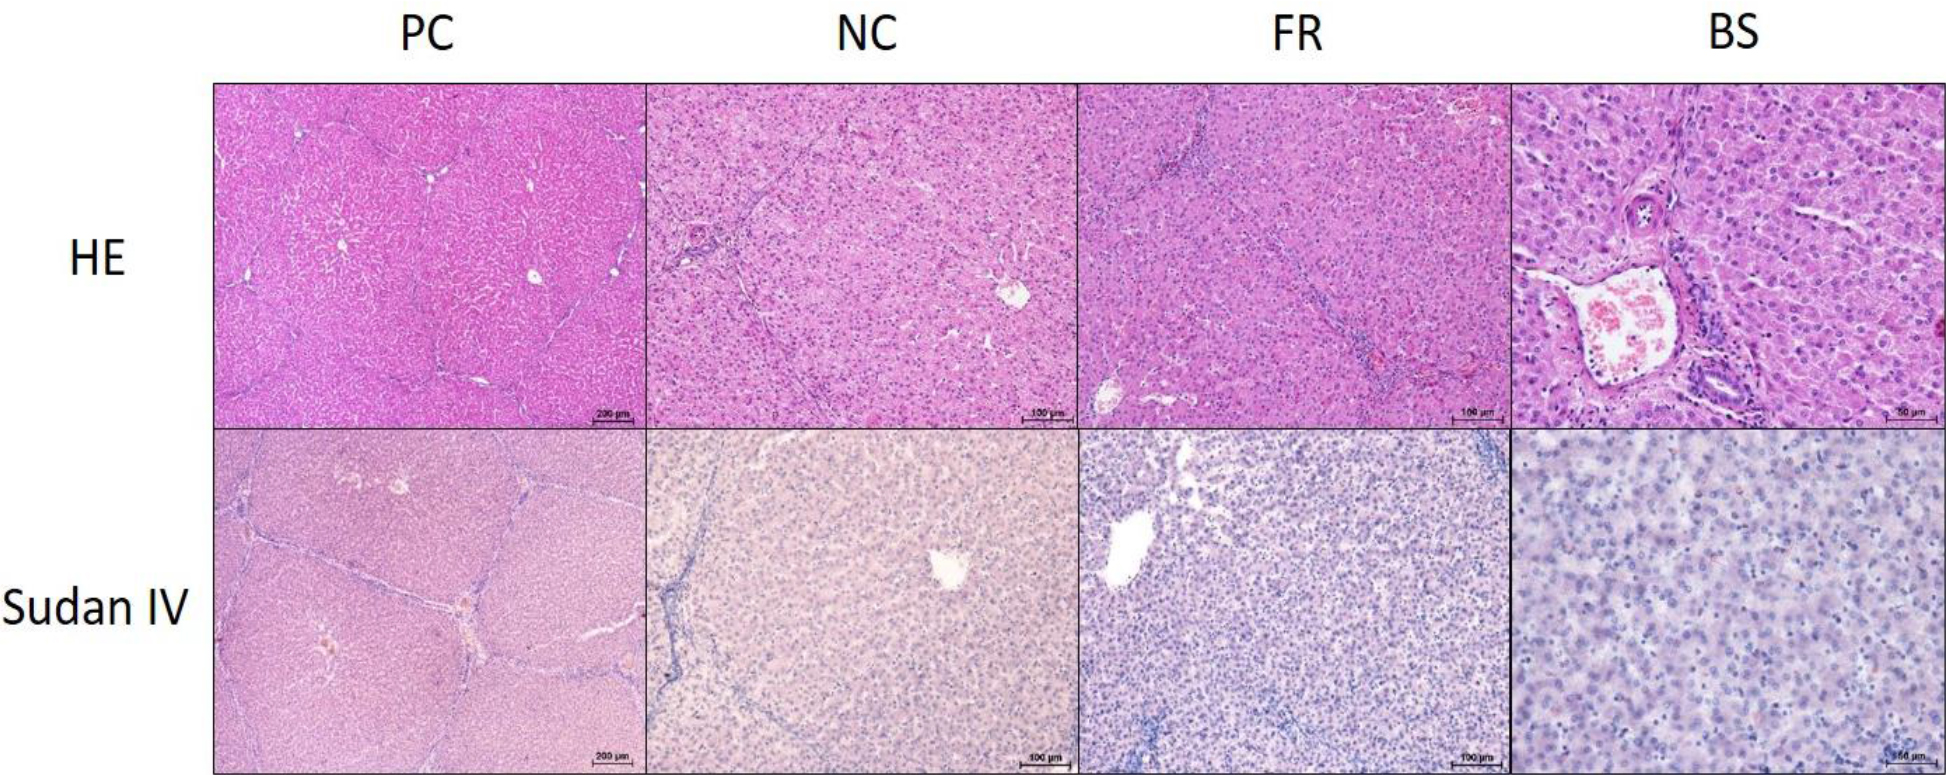
Fig. 2.
Representative histological images of liver tissue from piglets in the PC, NC, FR and BS groups. Staining with HE shows liver parenchyma divided into hepatic lobules with visible central veins and portal triads separated by thin bands of connective tissue. Staining with Sudan IV dye shows very weak histochemical staining for neutral lipids, visible as small orange lipid vacuoles in the cytoplasm of individual hepatocytes. PC – positive control group of weaned piglets receiving a standard diet with feed additives and ZnO; NC – negative control group of weaned piglets receiving the same diet as the positive control group but without feed additives or ZnO; FR – fermented rapeseed meal group of weaned piglets receiving the same diet as the negative control group but with 8% content of this meal and Bacillus subtilis 87Y; BS – Bacillus subtilis 87Y group of weaned piglets receiving the same diet as the negative control group with 0.1% Bacillus subtilis 87Y
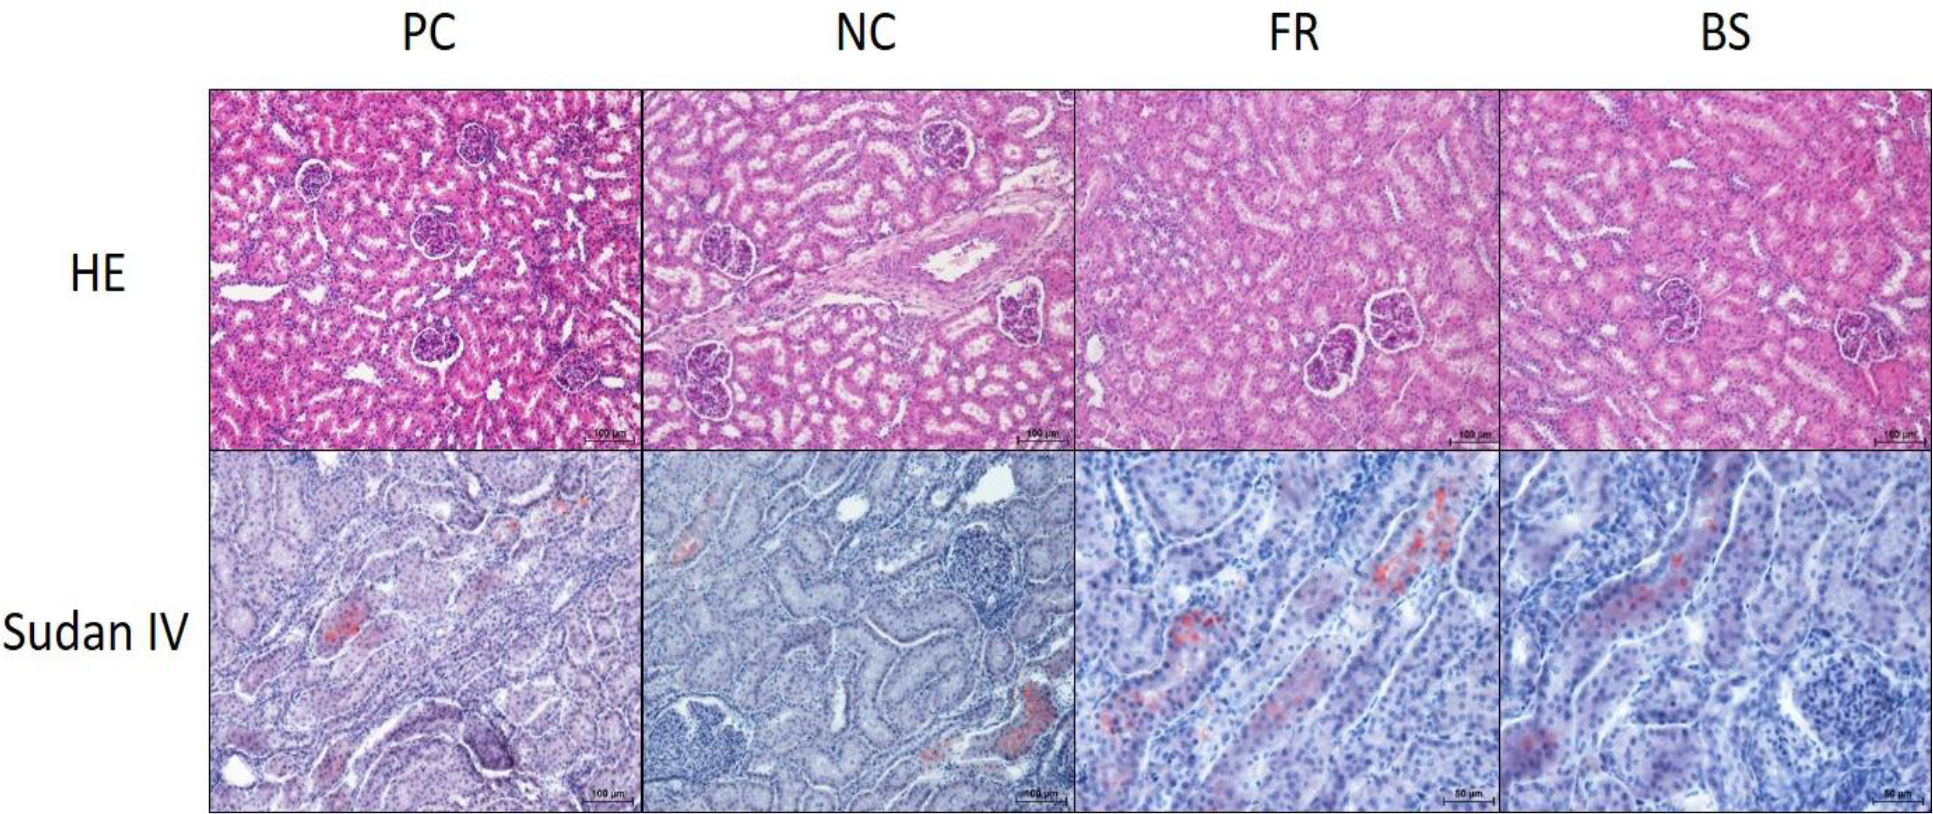
Fig. 3.
Representative histological images of kidney tissue from piglets in the PC, NC, FR and BS groups. Staining with HE shows glomeruli with preserved filtration spaces and adjacent proximal and distal convoluted tubules lined with simple cuboidal epithelium. Staining with Sudan IV dye shows scattered, tiny lipid vacuoles in the cytoplasm of the renal tubular epithelium. PC – positive control group of weaned piglets receiving a standard diet with feed additives and ZnO; NC – negative control group of weaned piglets receiving the same diet as in the positive control group but without feed additives or ZnO; FR – fermented rapeseed meal group of weaned piglets receiving a diet with 8% content of this meal and Bacillus subtilis 87Y without feed additives or ZnO; BS – Bacillus subtilis 87Y group of weaned piglets receiving a diet with 0.1% Bacillus subtilis 87Y without feed additives or ZnO