
Introduction
Honey, one of the oldest natural food products, has long been valued for its nutritional and medicinal properties. Its complex chemical composition contains a wide range of bioactive compounds, including vitamins, minerals, and enzymes. In recent years, increasing consumer awareness of food safety and health risks has intensified research into undesirable substances in honey (1). Among them, pyrrolizidine alkaloids (PAs) have attracted particular concern.
Pyrrolizidine alkaloids are natural plant-derived toxins produced by approximately 6,000 species, or around 3% of all flowering plants (9). They are considered the most widespread group of naturally occurring plant toxins, and pose potential risks to both human and animal health. Plants which produce PAs occur across diverse climates, with major sources belonging to the families Boraginaceae, Asteraceae, Fabaceae and Apocynaceae (11, 21, 23). In Poland, common representatives include groundsel (Senecio vulgaris), ragwort (Senecio jacobaea), comfrey (Symphytum officinale), viper’s bugloss (Echium vulgare) and borage (Borago officinalis). Often regarded as invasive weeds, these plants are abundant in meadows, pastures, wastelands and cultivated fields, thereby posing a risk of food and feed contamination (2).
The biosynthesis of PAs varies by species, but they are typically produced in roots and transported throughout the plant. Inflorescences generally contain the highest concentrations, followed by leaves and then stems (20). Alkaloid levels may range from trace amounts to several percent of the plant’s dry mass, with composition and concentration influenced by environmental conditions, climate and developmental stage (9). To date, around 700 PA structures have been identified, and the number continues to grow (8). They occur as tertiary bases (free bases) and N-oxides, both of which exhibit toxic properties (9, 8, 18).
Pyrrolizidine alkaloids act as pro-toxins, becoming toxic only after metabolic activation in the liver. Their transformation into reactive metabolites leads to DNA adduct formation and subsequent cell and tissue damage, primarily affecting the liver and lungs. This process is associated with mutagenesis, carcinogenesis, and, in severe cases, liver failure (4, 12, 24). Although toxic potency varies among compounds, the European Food Safety Authority (EFSA) has concluded that all 1,2-unsaturated PAs follow the same metabolic pathway, producing genotoxic and carcinogenic pyrroles (9). Even single low-dose exposures can be harmful, and the International Agency for Research on Cancer (IARC) has classified several PAs as “possibly carcinogenic to humans” (Group 2B) (9, 10). Documented cases of poisoning by PA-contaminated food, some fatal, highlight the risks to human health (11).
Honey is particularly vulnerable to PA contamination. Bees foraging on PA-producing plants collect nectar and pollen containing these toxins, which are subsequently introduced into honey (15). Because bees are not selective in nectar sources, PA contamination often goes undetected by standard quality control testing (11). Apiaries located near PA-rich vegetation are therefore at higher risk of producing contaminated honey.
Given the health risks, risk management strategies have been introduced by international authorities. In 2020, the European Union established maximum permissible PA levels in certain products, including pollen, pollen-based foods and supplements, for which 500 μg/kg was set (7). Although specific regulations concerning PAs in honey are still lacking, increasing awareness of the risks has led to greater attention being paid to monitoring of these substances in a broader range of bee products. Levels of PA contamination in honey depend on multiple factors, such as hive location, production season, the flowering period of PA-containing plants and weather conditions. Regular monitoring of honey is therefore essential to ensure consumer safety.
The aim of this study was to assess the occurrence of 42 PAs in Polish honey using liquid chromatography-tandem mass spectrometry (LC-MS/MS), with the goal of evaluating potential risks to consumer health and supporting future regulatory efforts.
Material and Methods
Chemicals and reagents
Ethyl acetate of gaschromatography grade was purchased from Merck (Darmstadt, Germany). Sulphuric acid (95%) and ammonia in 25% solution was from POCH (now Avantor Performance Materials, Gliwice, Poland). Ammonium carbonate was obtained from Sigma-Aldrich (St. Louis, MO, USA). Acetonitrile and methanol were ordered from J.T. Baker (now Avantor Performance Materials, Deventer, the Netherlands). Water came from Milli-Q water purification system (Millipore Sigma, Burlington, MA, USA). Mixed mode Oasis MCX cation exchange cartridges for solid-phase extraction (SPE) of 500 mg bed weight and 6 mL volume were provided by Waters (Milford, MA, USA). Pyrrolizidine alkaloid standards were purchased from LGC Standards (Teddington, UK) as a mix of europine, europine N-oxide, intermedine, intermedine N-oxide, lycopsamine, lycopsamine N-oxide, heliotrine, heliotrine N-oxide, retrorsine, retrorsine N-oxide, seneciphylline, seneciphylline N-oxide, senecivernine, senecivernine N-oxide, senecionine, senecionine N-oxide, echimidine, echimidine N-oxide, senkirkine, lasiocarpine and lasiocarpine N-oxide. Additionally, individual standards of monocrotaline, erucifoline, erucifoline N-oxide, jacobine, jacobine N-oxide, jaconine, jaconine N-oxide, trichodesmine, rinderine, rinderine N-oxide, echinatine, echinatine N-oxide, indicine, indicine N-oxide, integerrimine, integerrimine N-oxide, heliosupine, heliosupine N-oxide, usaramine, usaramine N-oxide and spartioidine were purchased from Phytolab (Vestenbergsgreuth, Germany).
Standard solutions
Standard stock solutions of the individual compounds were prepared in methanol at a concentration of 1,000 μg/mL. The 21-PA mix was purchased at the concentration of 100 μg/mL and used unchanged. Mixed working standard solutions at a concentration of 10 μg/mL were prepared by adding an appropriate amount of each single stock solution and the 21-PA mix. The mixed solution was further diluted with methanol to obtain concentrations of 1 μg/mL and 0.1 μg/mL. All solutions were stored <–18°C and were stable for 12 months.
Honey samples
These were collected as regular veterinary inspection procedures or sent directly by apiarists for privately commissioned testing. In total 65 honey samples were analysed. The analysed honeys were of Polish origin, and at least one sample was taken from each of the 16 voivodeships: 5 multifloral or rapeseed samples were from Dolnośląskie; 1 acacia sample was from Kujawsko-Pomorskie; 15 multifloral, rapeseed or acacia samples were from Lubelskie; 4 multifloral or rapeseed samples were from Lubuskie; 3 multifloral samples were from Łódzkie; 4 multifloral, honeydew or forest honey samples were from Małopolskie; 5 multifloral, rapeseed, acacia or linden samples were from Mazowieckie; 9 forest, multifloral or rapeseed samples were from Opolskie; 1 multifloral sample was from Podkarpackie; 4 multifloral or rapeseed samples were from Podlaskie; 2 rapeseed samples were from Pomorskie; 2 multifloral samples were from Śląskie; 3 multifloral or rapeseed samples were from Świętokrzyskie; 1 sample of unknown type was from Warmińsko-Mazurskie; 3 rapeseed samples were from Wielkopolskie; and 3 rapeseed samples were from Zachodniopomorskie.
Sample preparation
If necessary, honey samples were heated in a water bath at 40–45°C and homogenised. From each sample, 10 g of honey was weighed into a 50 mL polypropylene tube and diluted with 20 mL of 0.05 M sulfuric acid. All samples were shaken on a horizontal shaker until completely dissolved. Subsequently, the samples were subjected to centrifugation for 10 min at 4,000 × g. The resulting extracts were subjected to SPE using Oasis MCX mixed-mode cation exchange cartridges (Waters). The cartridges were preconditioned with 6 mL of methanol followed by 6 mL of 0.05 M H2SO4. After conditioning, 10 mL of the extract was loaded onto the cartridges. The washing step included sequential rinsing with 9 mL of purified water and 9 mL of methanol, followed by vacuum drying for 2 min. Alkaloids were eluted using 10 mL of a solvent mixture composed of ethyl acetate, methanol, acetonitrile, ammonia solution and triethylamine in a ratio of 8:1:1:0.5:0.1 (v/v). After evaporation under a stream of nitrogen, the residues were reconstituted in 0.4 mL of purified water and 0.4 mL of methanol. The solutions were then filtered through a 0.2 μm polyvinylidene fluoride filter and analysed.
Instrumental analysis
Chromatographic separation was achieved on an ExionLC Series UHPLC system (Sciex, Framingham, MA, USA) equipped with a Gemini NX-C18 column, 3 μm, 100 × 3 mm (Phenomenex, Torrance, CA, USA). The mobile phase consisted of 5 mM ammonium carbonate in water (solvent A) and a mixture of acetonitrile and methanol (2:1, v/v) (solvent B). Detection of all of the analytes was accomplished using a Triple Quad 5500+ triple-quadrupole mass spectrometer (Sciex) operated in multiple reaction monitoring mode. A Turbo V (Sciex) source was used with an electrospray ionization probe in positive polarity, and the parameters were optimised for optimal sensitivity. The ion source temperature and the ion spray voltage were set to 550°C and 4,500 V, respectively. Ion source gases 1 and 2 were both set to 50 psi. Nitrogen was used as the collision gas and the curtain gas at pressures of 9 psi and 30 psi, respectively. All other detection settings (precursor ions (m/z), product ions (m/z), declustering potential, entrance potential, collision energy and collision cell exit potential) are presented in Table 1. Analyst software (Sciex) was used for data acquisition, and the data was processed with Sciex OS software.
Table 1.
Optimised parameters of ion source
| Compound | Q1 mass (Da) | Q3 mass (Da) | DP (V) | EP (V) | CE (V) | CXP (V) |
|---|---|---|---|---|---|---|
| Echimidine | 398.2 | 120.1*/220.1/238.1 | 121 | 10 | 33/25/43 | 14/12/12 |
| Echimidine N-oxide | 414.2 | 254.2*/352.2/220.2 | 126 | 10 | 43/35/55 | 14/18/11 |
| Echinatine | 300.7 | 138.2*/156.2/120.2 | 104 | 10 | 31/37/39 | 18/8/18 |
| Echinatine N-oxide | 316.3 | 172.2*/111.2/94.2 | 110 | 10 | 39/51/53 | 8/14/16 |
| Erucifoline | 350.2 | 120.3*/138.1/220.1 | 152 | 10 | 38/38/45 | 14/16/12 |
| Erucifoline N-oxide | 366.2 | 118.0*/94.0/120.2 | 150 | 10 | 58/40/40 | 11/15/15 |
| Europine | 330.2 | 138.2*/254.1/156.3 | 127 | 10 | 30/27/40 | 16/13/10 |
| Europine N-oxide | 346.2 | 172.1*/256.3/111.2 | 60 | 10 | 42/35/57 | 21/12/12 |
| Heliosupine | 398.0 | 120.2*/220.2/336.2 | 101 | 10 | 37/29/27 | 16/12/16 |
| Heliosupine N-oxide | 414.0 | 254.3*/94.2/120.2 | 122 | 10 | 41/61/45 | 14/12/18 |
| Heliotrine | 314.1 | 138.2*/156.2/94.2 | 114 | 10 | 29/37/45 | 18/20/16 |
| Heliotrine N-oxide | 330.2 | 172.0*/138.1/94.1 | 158 | 10 | 37/38/54 | 21/16/12 |
| Indicine | 300.4 | 94.2*/156.3/138.0 | 130 | 10 | 35/38/28 | 11/15/16 |
| Indicine N-oxide | 316.4 | 172.3*/138.2/94.2 | 120 | 10 | 37/37/53 | 8/18/18 |
| Intermedine | 300.3 | 94.3*/156.2/138.3 | 135 | 10 | 35/38/27 | 11/17/12 |
| Intermedine N-oxide | 316.2 | 172.2*/94.0/111.3 | 130 | 10 | 38/51/53 | 15/11/13 |
| Integerrimine | 336.2 | 120.1*/94.0/308.0 | 150 | 10 | 38/42/36 | 15/11/16 |
| Integerrimine N-oxide | 352.2 | 118.1*/94.1/136.2 | 149 | 10 | 60/39/42 | 11/14/12 |
| Jacobine | 352.2 | 120.1*/280.1/155.2 | 136 | 10 | 33/39/39 | 14/14/8 |
| Jacobine N-oxide | 368.2 | 296.2*/120.3/94.0 | 137 | 10 | 46/34/56 | 15/15/11 |
| Jaconine | 388.1 | 352.2*/94.1/120.0 | 66 | 10 | 41/49/49 | 18/12/18 |
| Jaconine N-oxide | 404.0 | 118.1*/94.2 | 100 | 10 | 43/69 | 16/18 |
| Lasiocarpine | 412.2 | 120.2*/220.3/336.2 | 81 | 10 | 35/27/27 | 16/12/18 |
| Lasiocarpine N-oxide | 428.1 | 254.2*/120.2/94.2 | 130 | 10 | 41/45/57 | 12/18/12 |
| Lycopsamine | 300.3 | 94.2*/156.1/138.1 | 135 | 10 | 36/38/29 | 11/16/16 |
| Lycopsamine N-oxide | 316.2 | 172.3*/94.2/111.2 | 142 | 10 | 56/38/51 | 11/15/13 |
| Monocrotaline | 326.2 | 120.2*/121.1/237.1 | 151 | 10 | 45/39/33 | 14/14/12 |
| Retrorsine | 352.2 | 120.2*/138.4/324.0 | 150 | 10 | 39/39/38 | 7/6/16 |
| Retrorsine N-oxide | 368.2 | 94.1*/120.0/136.0 | 124 | 10 | 62/42/43 | 11/15/18 |
| Rinderine | 300.4 | 138.2*/156.3/94.2 | 156 | 10 | 31/37/45 | 18/8/16 |
| Rinderine N-oxide | 316.4 | 172.3*/111.1/94.2 | 110 | 10 | 39/51/53 | 8/20/14 |
| Seneciphylline | 334.2 | 120.1*/306.3/94.1 | 146 | 10 | 37/35/41 | 14/16/14 |
| Seneciphylline N-oxide | 350.2 | 94.1*/118.1/136.3 | 140 | 10 | 57/40/42 | 11/14/15 |
| Senecionine | 336.2 | 120.1*/308.2/138.1 | 151 | 10 | 39/37/39 | 12/16/16 |
| Senecionine N-oxide | 352.1 | 118.0*/94.3/136.1 | 131 | 10 | 40/61/45 | 14/11/16 |
| Senceivernine | 336.2 | 308.2*/120.1/138.2 | 161 | 10 | 37/39/41 | 16/14/6 |
| Senecivernine N-oxide | 352.1 | 94.1*/120.2/136.0 | 155 | 10 | 58/45/43 | 11/14/14 |
| Senkirkine | 366.2 | 168.2*/150.2/122.2 | 126 | 10 | 39/37/43 | 8/8/16 |
| Spartioidine | 334.2 | 120.1*/94.2/138.3 | 142 | 10 | 36/43/39 | 14/11/12 |
| Trichodesmine | 354.3 | 222.4*/120.1/138.1 | 150 | 10 | 38/46/46 | 11/6/18 |
| Usaramine | 352.2 | 120.0*/94.0/138.0 | 151 | 10 | 38/44/39 | 19/16/16 |
| Usaramine N-oxide | 368.2 | 94.0*/120.0/136.2 | 150 | 10 | 63/42/43 | 16/19/17 |
Method validation
The method was subjected to validation according to the “Analytical quality control and method validation procedures for pesticide residues analysis in food and feed” in SANTE 11312/2021 (5). During the validation process, the parameters assessed included linearity, recovery, repeatability, reproducibility, matrix effect, selectivity, limit of detection (LOD), limit of quantification (LOQ) and uncertainty.
Honey samples with no detectable levels of the monitored PAs were utilised as blank samples for preparing fortified samples used in validation. The method's linearity was evaluated through the analysis of matrix calibration curves and the determination of the R2 coefficient. Blank honey samples were spiked at concentrations of 1, 2.5, 5, 10, 20, 50 and 100 μg/kg prior to the extraction process. Linearity was confirmed if the coefficient of determination (R2) exceeded 0.98. An additional criterion for assessing linearity was the precision of back-calculated concentrations, which had to fall within a 20% margin of error. To evaluate the selectivity of the method, a series of blank honey samples was analysed to identify any potential interferences from endogenous matrix components at the retention times of the monitored alkaloids. For assessment of the matrix effect, blank honey samples were spiked with standard solutions after the SPE cleanup, while corresponding standard solutions were also prepared in pure solvents at the same concentrations. The matrix effect (%) was calculated as the ratio of the analyte peak area in the matrix-matched standard to the peak area in the solvent-based standard, multiplied by 100. The limit of detection was determined based on a signal-to-noise ratio of 3. The lowest validation level for which parameters such as precision and accuracy were determined was chosen as the limit of quantification. Recovery, repeatability and within-laboratory reproducibility were assessed by analysing three replicate blank samples spiked at each of three concentration levels: 1, 10 and 100 μg kg−1. Recovery (%) was calculated using the formula:
Repeatability was assessed by calculating the coefficient of variation (CV%) at each tested concentration level. Within-laboratory reproducibility was evaluated by analysing two additional sets of spiked blank honey samples – prepared at the same concentration levels used for repeatability – on different days using the same analytical instrument. The CV% values obtained from these measurements were used to assess reproducibility. Measurement uncertainty was estimated by identifying and quantifying all relevant sources of uncertainty throughout the entire analytical procedure, in accordance with guidelines from Eurachem and the Co-Operation on International Traceability in Analytical Chemistry (CITAC) (6). The expanded uncertainty was reported as a percentage, using a coverage probability of 95% (P-value = 0.05) and a coverage factor of k = 2.
Results
The sample preparation procedure was adapted from the previous studies on PAs in honey, with a slight modification of the SPE elution mixture to enhance the recoveries of all N-oxide forms (16, 17). In the present study, the concentration of ammonia was increased fivefold compared to the previously applied method. Good chromatographic separation of most of the isomers was achieved thanks to application of 5 mM ammonia carbonate and mixture of methanol and acetonitrile (2:1, v/v) as the mobile phases.
The presented method was validated in house. Among the assessed parameters were linearity in the concentration range 1–100 μg/kg, matrix effect, selectivity, recovery, repeatability, reproducibility, LOD, LOQ and uncertainty. All validation results are presented in Tables 2 and 3.
Table 2.
Validation results of recovery, repeatability and reproducibility
| Compound | Recovery (1 μg kg−1 spike) (%) | Recovery (10 μg kg−1 spike) (%) | Recovery (100 μg kg−1 spike) (%) | Repeat ability (1 μg kg−1 spike) (CV, %) | Repeat ability (10 μg kg−1 spike) (CV, %) | Repeat ability (100 μg kg−1 spike) (CV, %) | Reproducibility (1 μg kg−1 spike) (CV, %) | Reproducibility (10 μg kg−1 spike) (CV, %) | Reproducibility (100 μg kg−1 spike) (CV, %) |
|---|---|---|---|---|---|---|---|---|---|
| Echimidine | 106.7 | 110.0 | 99.0 | 3.6 | 2.0 | 5.2 | 14.4 | 2.9 | 4.9 |
| Echimidine N-oxide | 105.2 | 107.9 | 97.1 | 5.4 | 3.1 | 1.2 | 19.0 | 8.6 | 7.5 |
| Erucifoline | 103.1 | 117.6 | 104.1 | 2.0 | 1.4 | 2.0 | 19.2 | 5.4 | 7.2 |
| Erucifoline N-oxide | 111.2 | 109.7 | 97.8 | 3.8 | 5.6 | 2.7 | 13.7 | 16.3 | 9.1 |
| Europine | 109.8 | 108.6 | 93.9 | 3.2 | 2.3 | 5.7 | 10.7 | 3.9 | 6.0 |
| Europine N-oxide | 103.1 | 110.2 | 91.3 | 5.5 | 6.0 | 2.9 | 18.0 | 11.8 | 10.5 |
| Heliosupine | 118.1 | 112.3 | 97.2 | 2.8 | 1.8 | 2.3 | 14.9 | 2.9 | 5.1 |
| Heliosupine N-oxide | 105.5 | 108.2 | 95.9 | 3.1 | 3.2 | 4.8 | 13.9 | 6.4 | 5.2 |
| Heliotrine | 105.4 | 111.4 | 98.9 | 4.2 | 2.4 | 5.6 | 17.8 | 4.2 | 5.4 |
| Heliotrine N-oxide | 106.6 | 107.9 | 94.8 | 4.1 | 1.8 | 5.5 | 16.2 | 7.4 | 6.7 |
| Intermedine | 106.5 | 110.6 | 98.8 | 3.6 | 2.7 | 4.5 | 14.2 | 4.9 | 4.0 |
| Intermedine N-oxide | 110.3 | 111.1 | 93.1 | 4.1 | 2.1 | 4.8 | 10.5 | 7.3 | 7.0 |
| Integerrimine | 101.0 | 116.0 | 103.8 | 4.7 | 3.9 | 3.3 | 19.9 | 4.3 | 6.3 |
| Integerrimine N-oxide | 107.8 | 107.3 | 95.4 | 3.9 | 4.0 | 2.9 | 13.5 | 9.7 | 4.7 |
| Jacobine | 102.9 | 118.2 | 103.6 | 5.1 | 2.7 | 2.9 | 19.6 | 6.6 | 8.9 |
| Jacobine N-oxide | 106.1 | 107.4 | 92.9 | 8.7 | 5.4 | 6.1 | 13.3 | 8.9 | 6.4 |
| Jaconine | 95.8 | 118.3 | 109.4 | 5.6 | 4.4 | 4.3 | 19.3 | 7.0 | 8.7 |
| Jaconine N-oxide | 101.6 | 109.7 | 99.5 | 4.0 | 11.6 | 3.5 | 19.8 | 11.2 | 6.3 |
| Lasiocarpine | 105.7 | 112.8 | 90.4 | 7.3 | 4.4 | 2.5 | 18.4 | 6.8 | 5.8 |
| Lasiocarpine N-oxide | 107.2 | 111.2 | 94.2 | 2.8 | 1.9 | 4.1 | 16.8 | 6.6 | 7.2 |
| Lycopsamine | 103.3 | 116.6 | 99.8 | 5.0 | 4.5 | 3.0 | 19.8 | 4.1 | 4.4 |
| Lycopsamine N-oxide | 107.3 | 109.5 | 92.2 | 8.7 | 3.9 | 3.4 | 13.6 | 13.5 | 7.6 |
| Monocrotaline | 98.3 | 116.4 | 105.5 | 8.3 | 2.6 | 3.2 | 18.5 | 3.2 | 6.6 |
| Retrorsine | 103.6 | 110.1 | 96.4 | 4.2 | 3.7 | 3.3 | 14.9 | 3.2 | 4.2 |
| Retrorsine N-oxide | 105.6 | 106.6 | 92.8 | 5.9 | 3.8 | 2.5 | 16.8 | 9.8 | 7.7 |
| Rinderine | 105.5 | 114.7 | 101.8 | 2.4 | 2.8 | 2.0 | 17.1 | 4.3 | 4.2 |
| Rinderine N-oxide | 107.9 | 110.6 | 93.6 | 6.2 | 3.3 | 5.1 | 14.9 | 6.3 | 6.2 |
| Seneciphylline | 104.6 | 114.3 | 97.8 | 4.1 | 3.2 | 3.3 | 19.1 | 5.3 | 6.0 |
| Seneciphylline N-oxide | 105.1 | 107.9 | 96.1 | 1.6 | 2.8 | 2.5 | 18.7 | 11.2 | 7.7 |
| Senecionine | 102.8 | 112.9 | 100.8 | 3.6 | 1.7 | 1.9 | 19.4 | 4.0 | 6.5 |
| Senecionine N-oxide | 111.1 | 106.4 | 93.0 | 2.9 | 1.7 | 0.8 | 12.5 | 10.5 | 6.9 |
| Senceivernine | 103.8 | 114.6 | 99.6 | 6.5 | 2.6 | 2.5 | 13.4 | 4.5 | 6.4 |
| Senecivernine N-oxide | 106.5 | 106.9 | 95.4 | 5.6 | 6.2 | 4.1 | 15.1 | 10.6 | 8.1 |
| Senkirkine | 100.6 | 110.9 | 100.5 | 7.4 | 4.6 | 3.7 | 13.4 | 6.2 | 6.3 |
| Spartioidine | 106.1 | 117.1 | 100.4 | 5.0 | 4.1 | 2.6 | 20.0 | 4.9 | 6.8 |
| Trichodesmine | 100.2 | 115.0 | 107.6 | 10.3 | 1.6 | 2.5 | 17.1 | 3.5 | 6.4 |
| Usaramine | 105.6 | 114.8 | 98.9 | 4.4 | 4.3 | 3.0 | 17.8 | 5.4 | 6.3 |
| Usaramine N-oxide | 108.1 | 106.0 | 94.6 | 11.1 | 3.0 | 3.5 | 16.0 | 8.6 | 6.8 |
Table 3.
Validation results of linearity, matrix effect, uncertainty and limit of detection (LOD)
| Compound | Linearity (R2) | Matrix effect (%) | Uncertainty (%) | LOD (μg kg−1) |
|---|---|---|---|---|
| Echimidine | 0.993 | 106.4 | 32.5 | 0.01 |
| Echimidine N-oxide | 0.995 | 97.0 | 40.5 | 0.01 |
| Erucifoline | 0.990 | 109.6 | 40.0 | 0.03 |
| Erucifoline N-oxide | 0.994 | 113.8 | 38.7 | 0.04 |
| Europine | 0.995 | 106.9 | 29.5 | 0.01 |
| Europine N-oxide | 0.990 | 127.3 | 37.5 | 0.02 |
| Heliosupine | 0.997 | 97.8 | 33.9 | 0.01 |
| Heliosupine N-oxide | 0.996 | 105.7 | 30.7 | 0.03 |
| Heliotrine | 0.995 | 110.7 | 38.3 | 0.01 |
| Heliotrine N-oxide | 0.994 | 99.5 | 35.9 | 0.01 |
| Intermedine | 0.994 | 107.5 | 32.0 | 0.01 |
| Intermedine N-oxide | 0.992 | 94.7 | 29.8 | 0.02 |
| Integerrimine | 0.996 | 102.8 | 40.1 | 0.02 |
| Integerrimine N-oxide | 0.997 | 96.9 | 31.7 | 0.06 |
| Jacobine | 0.997 | 104.8 | 40.7 | 0.08 |
| Jacobine N-oxide | 0.997 | 93.9 | 29.9 | 0.01 |
| Jaconine | 0.996 | 104.9 | 38.4 | 0.02 |
| Jaconine N-oxide | 0.994 | 110.1 | 40.9 | 0.02 |
| Lasiocarpine | 0.996 | 105.0 | 39.5 | 0.01 |
| Lasiocarpine N-oxide | 0.992 | 102.3 | 37.4 | 0.01 |
| Lycopsamine | 0.994 | 109.2 | 39.9 | 0.01 |
| Lycopsamine N-oxide | 0.990 | 119.8 | 31.6 | 0.01 |
| Monocrotaline | 0.996 | 108.2 | 38.3 | 0.01 |
| Retrorsine | 0.995 | 99.0 | 31.5 | 0.03 |
| Retrorsine N-oxide | 0.990 | 96.6 | 36.4 | 0.03 |
| Rinderine | 0.996 | 101.4 | 36.9 | 0.01 |
| Rinderine N-oxide | 0.993 | 100.9 | 34.5 | 0.02 |
| Seneciphylline | 0.995 | 102.0 | 38.5 | 0.01 |
| Seneciphylline N-oxide | 0.994 | 99.7 | 39.8 | 0.01 |
| Senecionine | 0.995 | 104.0 | 39.2 | 0.03 |
| Senecionine N-oxide | 0.995 | 97.8 | 34.0 | 0.04 |
| Senceivernine | 0.994 | 100.0 | 30.7 | 0.03 |
| Senecivernine N-oxide | 0.994 | 97.1 | 33.7 | 0.03 |
| Senkirkine | 0.997 | 98.2 | 27.5 | 0.01 |
| Spartioidine | 0.994 | 101.3 | 40.2 | 0.02 |
| Trichodesmine | 0.998 | 114.9 | 35.1 | 0.01 |
| Usaramine | 0.996 | 99.3 | 38.4 | 0.06 |
| Usaramine N-oxide | 0.995 | 104.9 | 36.6 | 0.07 |
The recoveries ranged from 90.4% to 118.3%, depending on the compound and validation level. The CV for repeatability ranged from 0.8% to 11.6%, and the CV for reproducibility from 2.9% to 20.0%. Regarding linearity, the calibration curves for all compounds had a coefficient of determination (R2) greater than 0.98. Additionally, back-calculated concentrations did not deviate by more than ±20%. The matrix effect was mainly observed as ion enhancement, ranging from 93.9% to 127.3%, with the highest value recorded for europine N-oxide. The limit of detection, defined as a signal-to-noise ratio of 3, ranged from 0.01 to 0.08 μg/kg, depending on the compound. The lowest validation level, 1 μg/kg, was adopted as the LOQ for all analysed compounds. Table 3 presents the highest uncertainty values obtained for each compound, regardless of the validation level.
Out of the 65 honey samples tested, 39 contained at least one of the analysed compounds. However, in most cases, the concentrations were very low, falling below the method’s LOQ (<1 μg/kg). In 23 samples, more than one of the monitored compounds was detected. The most commonly found alkaloids were spartioidine and seneciphylline, both belonging to the group of macrocyclic diesters. Other frequently detected alkaloids included open-chain monoester compounds from the intermedine group: rinderine/echinatine, intermedine and lycopsamine/indicine, as well as their N-oxide forms. The presence of macrocyclic diester senecionine and senecivernine, along with open-chain diester echimidine and heliosupine and their oxides was also observed.
Only 10 samples (15.4%) contained alkaloids at concentrations above the method’s LOQ. The measured concentrations, expressed as the sum of the detected alkaloids, ranged from 1.0 to 46.9 μg/kg. The highest concentration among all the compounds was of seneciphylline at 21.3 μg/kg, followed by those of heliosupine N-oxide at 18.9 μg/kg, heliosupine at 13.2 μg/kg, rinderine/echinatine at 12.5 μg/kg and echimidine at 9.1 μg/kg (Tables 4 and 5). Most of the quantified levels, however, were low, very often in the range from 1.0 to 2.0 μg/kg. The mean content of PAs was calculated as 12.7 μg/kg, and the median was evaluated as 7.8 μg/kg.
Table 4.
Concentrations of open-chain pyrrolizidine alkaloids (PAs) in μg/kg in positive samples of honey
| Voiv. | Echimidine | Heliosupine | Echimidine N-oxide | Heliosupine N-oxide | Intermedine | Lycopsamine/indicine | Rinderine / echinatine | Intermedine N-oxide | Lycopsamine N-oxide/indicine N-oxide | Rinderine N-oxide / echinatine N-oxide |
|---|---|---|---|---|---|---|---|---|---|---|
| LU | ||||||||||
| LU | ||||||||||
| LU | < LOQ | < LOQ | < LOQ | |||||||
| LU | 9.1 | < LOQ | ||||||||
| LU | ||||||||||
| LU | ||||||||||
| LU | ||||||||||
| LU | ||||||||||
| LU | 1.3 | 1.2 | 12.5 | 2.8 | ||||||
| LU | < LOQ | < LOQ | ||||||||
| LU | < LOQ | < LOQ | ||||||||
| LU | ||||||||||
| LU | < LOQ | |||||||||
| DS | ||||||||||
| MP | ||||||||||
| MP | < LOQ | |||||||||
| MP | < LOQ | |||||||||
| MP | < LOQ | < LOQ | ||||||||
| OP | ||||||||||
| OP | < LOQ | |||||||||
| OP | ||||||||||
| OP | < LOQ | |||||||||
| ZP | ||||||||||
| ZP | < LOQ | |||||||||
| ZP | < LOQ | < LOQ | < LOQ | < LOQ | ||||||
| WM | < LOQ | < LOQ | ||||||||
| WP | < LOQ | < LOQ | < LOQ | |||||||
| WP | ||||||||||
| ŁD | < LOQ | |||||||||
| SL | < LOQ | |||||||||
| SL | < LOQ | |||||||||
| LS | < LOQ | |||||||||
| LS | ||||||||||
| PL | < LOQ | |||||||||
| MZ | < LOQ | < LOQ | ||||||||
| MZ | 2.1 | < LOQ | < LOQ | < LOQ | < LOQ | < LOQ | < LOQ | |||
| MZ | 4.2 | 13.2 | < LOQ | < LOQ | < LOQ | |||||
| MZ | 3.6 | 7.5 | 7.1 | 18.9 | < LOQ | 1.3 | < LOQ | 6.0 | 2.5 | |
| PL | < LOQ |
Table 5.
Concentrations of macrocyclic pyrrolizidine alkaloids (PAs) in μg/kg in positive samples of honey and the total PA content in μg/kg representing the sum of open-chain and macrocyclic PAs
| Voivodeship | Seneciphylline | Spartioidine | Seneciphylline N-oxide | Senecionine | Senecivernine | Total PA content |
|---|---|---|---|---|---|---|
| LU | < LOQ | 0.0 | ||||
| LU | < LOQ | 0.0 | ||||
| LU | 1.0 | 1.0 | ||||
| LU | 1.7 | 1.0 | 1.0 | 12.8 | ||
| LU | < LOQ | 0.0 | ||||
| LU | < LOQ | 0.0 | ||||
| LU | < LOQ | 0.0 | ||||
| LU | < LOQ | 0.0 | ||||
| LU | < LOQ | 17.8 | ||||
| LU | < LOQ | < LOQ | 0.0 | |||
| LU | < LOQ | 0.0 | ||||
| LU | < LOQ | 0.0 | ||||
| LU | < LOQ | 0.0 | ||||
| DS | < LOQ | 0.0 | ||||
| MP | < LOQ | 0.0 | ||||
| MP | < LOQ | 0.0 | ||||
| MP | 21.3 | 2.3 | 23.6 | |||
| MP | < LOQ | < LOQ | 0.0 | |||
| OP | < LOQ | 0.0 | ||||
| OP | < LOQ | < LOQ | 0.0 | |||
| OP | < LOQ | 0.0 | ||||
| OP | < LOQ | 0.0 | ||||
| ZP | < LOQ | 0.0 | ||||
| ZP | < LOQ | 0.0 | ||||
| ZP | < LOQ | 0.0 | ||||
| WM | < LOQ | 1.1 | 1.1 | |||
| WP | < LOQ | 0.0 | ||||
| WP | < LOQ | < LOQ | 0.0 | |||
| ŁD | < LOQ | 0.0 | ||||
| SL | < LOQ | 0.0 | ||||
| SL | 0.0 | |||||
| LS | < LOQ | 1.8 | 1.1 | 2.9 | ||
| LS | < LOQ | 0.0 | ||||
| PL | < LOQ | 0.0 | ||||
| MZ | 1.5 | 1.5 | ||||
| MZ | 2.1 | |||||
| MZ | < LOQ | < LOQ | < LOQ | < LOQ | 17.4 | |
| MZ | 46.9 | |||||
| PL | 0.0 |
Discussion
Pyrrolizidine alkaloids are toxins that have received increasing attention in recent years. Numerous analytical methods have been published in the literature; however, none of them have so far achieved complete separation of all the compounds listed in Regulation (EU) 2020/2040 (7). The most challenging group of isomers includes intermedine, lycopsamine, indicine, rinderine, echinatine and their corresponding N-oxides. In the present study, it was possible to achieve separation of intermedine, lycopsamine and rinderine. However, indicine coeluted with lycopsamine, and echinatine could not be separated from rinderine. The same separation pattern was observed for the corresponding N-oxides. For this reason, indicine, echinatine and their N-oxides were excluded from the standard mix and acquisition method, and their potential presence was quantified as lycopsamine and rinderine, respectively. A similar approach was used for the corresponding N-oxides. Other challenging isomers, including senecionine, senecivernine and integerrimine, were successfully separated in both their free-base forms and as the corresponding N-oxides (Fig. 1). All remaining isomers were either fully resolved or only partially co-eluting; in the latter case, sufficient chromatographic resolution was achieved to allow reliable quantification as distinct peaks.
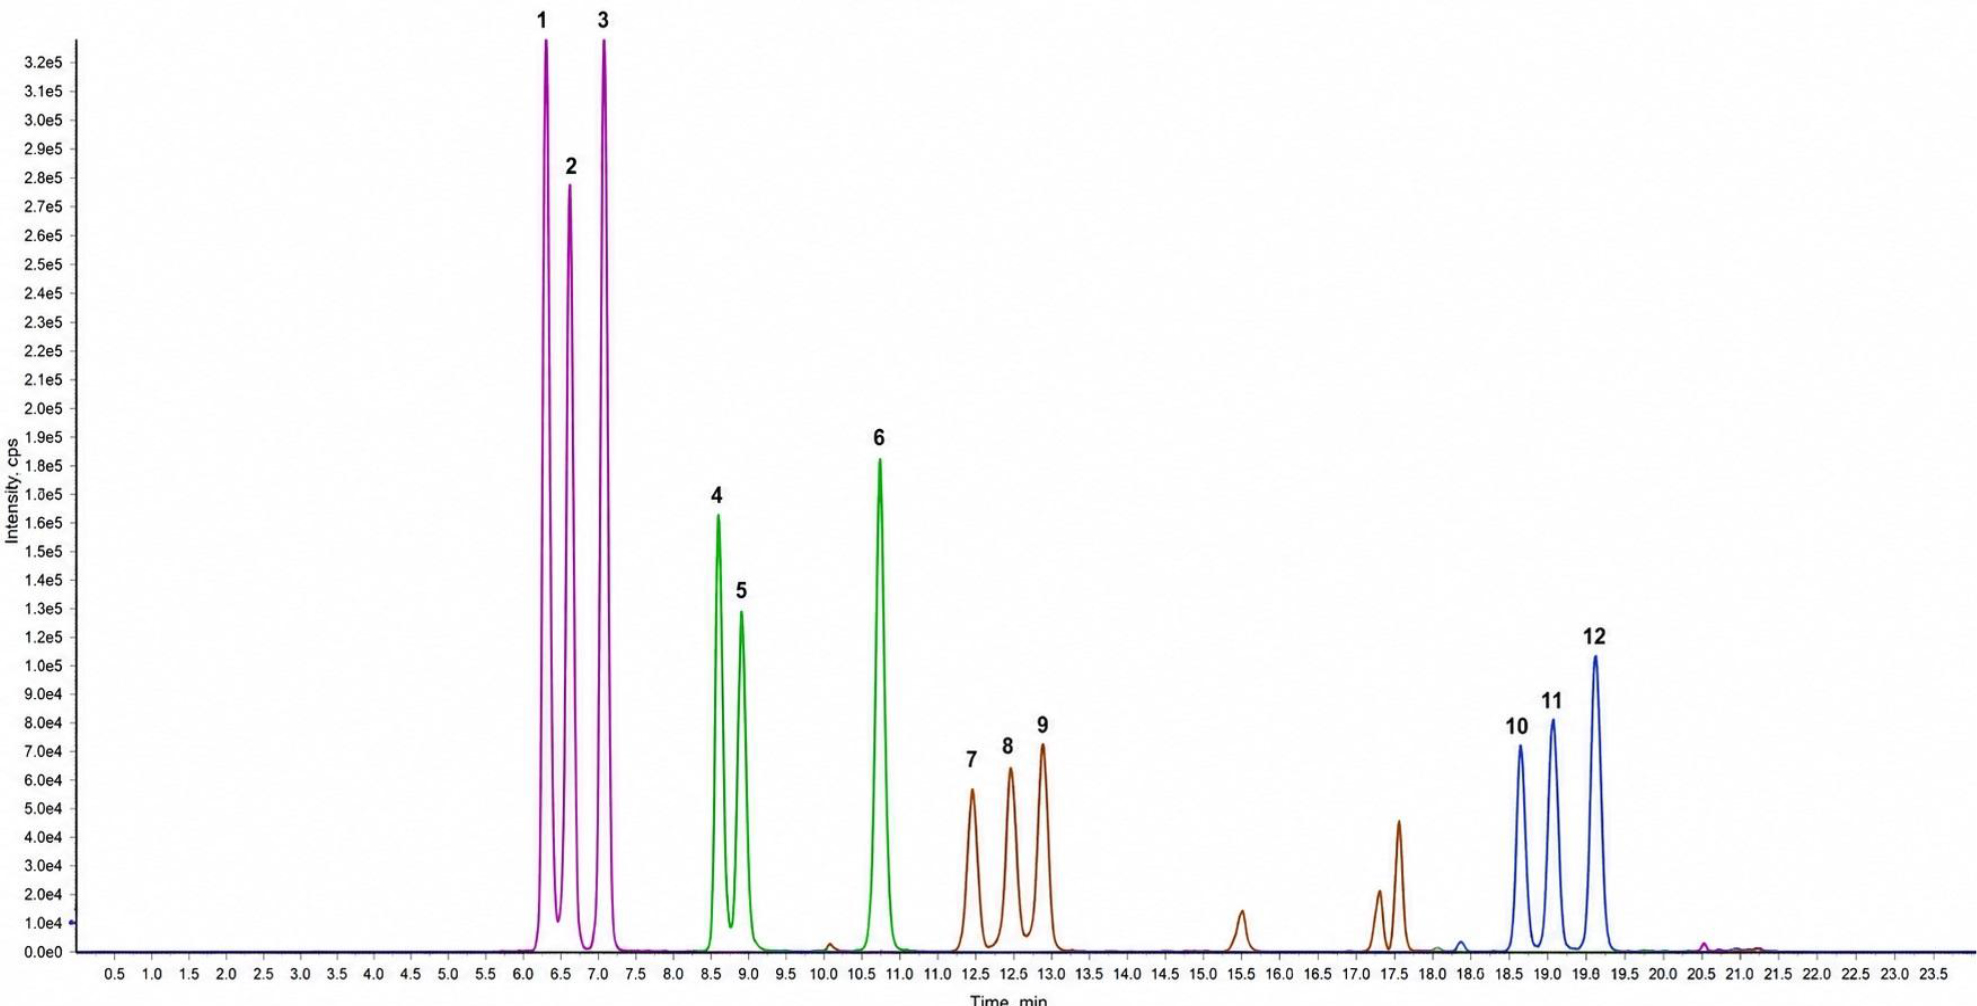
Fig. 1.
Extracted ion chromatogram of: 1 – intermedine N-oxide; 2 – lycopsamine N-oxide/indicine N-oxide; 3 – rinderine N-oxide/echinatine N-oxide; 4 – intermedine; 5 – lycopsamine/indicine; 6 – rinderine/echinatine; 7 – integerrimine N-oxide; 8 – senecionine N-oxide; 9 – senecivernine N-oxide; 10 – integerrimine; 11 – senecionine; and 12 – senecivernine
The sample preparation procedure was adapted from previously reported methods for PA analysis in honey (16, 17). However, because the earlier method included an N-oxide reduction step, the recoveries of N-oxides required optimisation in the present method. Increasing the ammonia volume in the SPE elution mixture proved to be a key factor, significantly improving N-oxide recoveries compared with the previous eluent composition while maintaining good recoveries of the basic PAs.
The expanded number of compounds covered in the current method and the modification of the SPE elution mixture recommended that the method was subjected to validation. Recoveries for all compounds were within the range of 80–120%. Repeatability and reproducibility values were ≤20%. The matrix effect, except for one compound, also fell within the acceptable range of 80–120%. The coefficients of determination exceeded the required threshold of 0.98, and back-calculation results were within ±20%, proving the linearity of the method. The lowest validation level of 1 μg/kg was taken as the LOQ for all PAs included in the method, as it provided established values for both accuracy and precision. Overall, all validation parameters fulfilled the SANTE document criteria (5).
The study results indicate the presence of PAs in various honeys. Of the 65 honey samples tested, 39 contained at least one of the analysed compounds, representing 60% of all samples. This suggests that PAs are common in honey, although in most cases, their concentrations were at very low levels dropping below the method’s LOQ (<1 μg/kg). As required by European Commission Regulations 2020/2040 and 2023/915, it is assumed that all values below the LOQ are zero (7, 8). Therefore, officially only 10 out of the 65 tested honeys should be considered positive samples. In these cases, concentrations expressed as the sum of detected PAs ranged from 1.0 to 46.9 μg/kg.
The honey with the highest content of PAs, amounting to 46.9 μg/kg, originated from the Mazowieckie voivodeship and was declared to be linden honey. In this case, alkaloids from the echimidine group were the main contributors to the contamination. These alkaloids are mainly produced by the plant Echium vulgare (commonly known as viper’s bugloss), and considering the profile of the detected compounds, Echium vulgare was the most probable source of the contamination (3). Another honey sample containing an elevated alkaloid concentration (23.6 μg/kg) originated from the Małopolskie region and was described as honey from forested areas. Seneciphylline was identified as the main PA in the contamination. In contrast, in the case of cultivated honeys, such as the tested rapeseed honey, PAs were mostly not detected above the method’s LOQ. Therefore, it can be inferred that the location of beehives may play an important role in the contamination of honey with pyrrolizidine alkaloids.
The remaining eight honey samples with quantified content contained relatively low alkaloid concentrations, ranging from 1.0 to 17.8 μg/kg, and originated in three cases from the Lubelskie, in two cases from the Mazowieckie, and in one case each from the Warmińsko-Mazurskie and Lubuskie voivodeships.
When assessing the individual compounds, the highest concentration was observed for seneciphylline (21.3 μg/kg). Quantifiable concentrations were also determined for heliosupine N-oxide (18.9 μg/kg), heliosupine (13.2 μg/kg), rinderine/echinatine (12.5 μg/kg) and echimidine (9.1 μg/kg). In contrast, the majority of detected compounds were present only at lower levels, typically ranging from 1.0 to 2.0 μg/kg.
The most frequently detected alkaloids were spartioidine and seneciphylline, which belong to the group of macrocyclic diesters. These alkaloids are known for their toxic properties, which may raise concerns among consumers regarding the safety of honey consumption if detected at elevated levels. However, the detected levels of macrocyclic diesters should not pose any risk to consumers as they were very low and mostly below the LOQ. The presence of other compounds, such as those from the intermedine group, might also be an important point of analysis, as they are open-chain monoesters, consumption of which may also have health consequences, even though it is well known that the open-chain monoesters are less toxic then the macrocyclic structures. It is worth noting that among the identified alkaloids, a significant portion occurred in the form of free bases rather than N-oxide forms, which is likely related to the breakdown of N-oxides due to the action of enzymes present in honey (13).
The findings of this study are consistent with previous reports on PA contamination in Polish honey. Earlier studies documented total PA concentrations ranging from 1.4 to 52.4 μg/kg, with mean and median values of 8.6 and 4.1 μg/kg, respectively (16). More recent data from 2022 reported concentrations of 2.2–31.6 μg/kg, with mean and median values of 11.0 and 9.0 μg/kg, respectively (17). In the present study, the honey samples showed PA concentrations ranging from 1.0 to 46.9 μg/kg, with mean and median values of 12.7 and 7.9 μg/kg. These results indicate that PA contamination in Polish honey has remained relatively stable over time, with low variability across different years of collection. The concentration levels of PAs in Polish honey were also comparable with other reported contamination levels in honey of European origin (14, 19).
Regarding the individual alkaloids in the overall contamination, previous studies most frequently detected echimidine, lycopsamine, intermedine and senecionine (16, 17). Similarly, in the present study, alkaloids from the intermedine, echimidine and senecionine groups were commonly quantified. Alkaloids from the seneciphylline group were also present in many samples, although their concentrations were below the LOQ. This may explain some of the differences observed compared to a 2018 study, as the analytical method used previously had higher LOD and LOQ, potentially missing compounds present at very low concentrations (16).
The contamination profile of the alkaloids is also similar to that reported by Roncada et al. (22). Similarly, another study on Italian honey presented detected profiles and concentrations of PAs comparable to the presented results (19). A similar alkaloids profile was also determined in other European honeys, where echimidine, lycopsamine, intermedine and senecionine-type PAs were the most often detected (14).
To assess consumer risk, the proposed 237 μg/kg body weight (bw) per day benchmark dose lower confidence level for a 10% response, defined as the lower bound of the 95% confidence interval for the dose associated with a 10% increase in cancer risk, was used as a reference point (8). To establish a daily intake limit of PAs that would not pose a health concern, a margin of exposure of 10,000 was applied. Based on this approach, the maximum allowable intake of PAs should not exceed 0.0237 μg/kg bw per day (2). Assuming an average honey consumption of 20 g per day (approximately one tablespoon), along with an average adult body weight of 60 kg and a child’s average body weight of 20 kg, the corresponding “safe” PA concentration in honey would be 71.1 μg/kg for adults and 24.2 μg/kg for children.
Considering the results obtained for PA content in honey from Poland, it can be seen that only one honey sample contained PA concentrations higher than those considered safe, but that consumption of such honey could pose a risk of adverse health effects, especially on children. The remaining honey samples should not carry a risk of adverse health effects and can be considered safe despite containing PAs.
Conclusion
A method for the determination of 42 PAs was developed and validated in house. All validation parameters complied with the requirements of SANTE/11312/2021, demonstrating the robustness and utility of the method.
Sixty-five honey samples collected across Poland were analysed with the method. Detected PA concentrations were relatively low. The most common alkaloids were spartioidine and seneciphylline, followed by intermedine and echimidine. The analytical scope was broader than that of earlier studies, but neither the levels nor the qualitative composition of PAs in Polish honeys changed substantially. From a consumer risk perspective, the intake of PAs from nearly all the tested honeys would not cause adverse health effects. Only one sample indicated intoxicating potential, and all other honeys, could be considered safe for consumption although they contained measurable amounts of PAs.
Notes
[5] Conflicts of interest Conflict of Interests Statement: The author declares that there is no conflict of interests regarding the publication of this article.
[6] Financial disclosure Financial Disclosure Statement: The study was funded by the Agency for Restructuring and Modernisation of Agriculture under intervention I.6.6 – Intervention in the beekeeping sector – scientific and research support in the beekeeping year 2024, covered by the Strategic Plan for the Common Agricultural Policy for 2023–2027 (00001.BWI03.61835.1.3.2024).
[7] Animal Rights Statement: None required.
[8] CRediT Authorship Contribution Statement: Ewelina Kowalczyk: research concept and design, collection and assembly of data, data analysis and interpretation, writing the article, critical revision of the article, final approval of the article.