
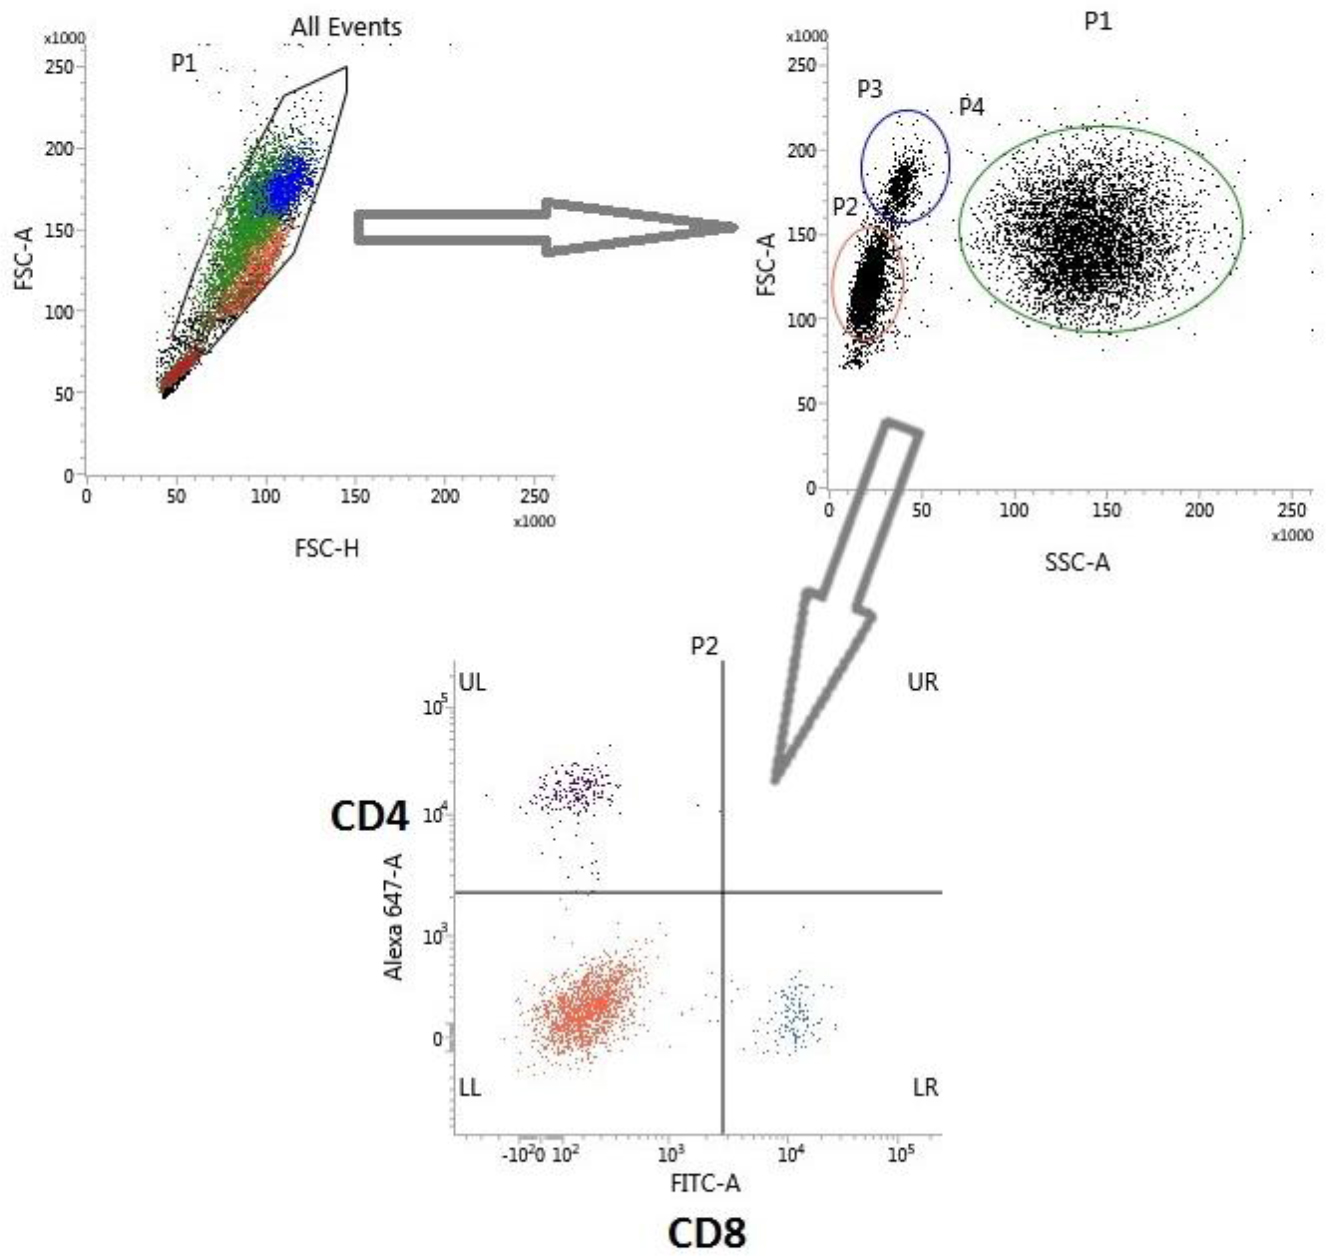
Fig. 1.
Gating strategy for bovine lymphocyte immunophenotyping. Single cells were selected in a forward-scatter (FSC) pulse area (A) vs FSC pulse height (H) plot. Lymphocytes were identified/gated in an FSC-A vs side-scatter (SSC)-A plot based on their size and granularity, and their fluorescences were gated in SSC-A to fluorescence histograms
Table 1.
Results of biochemical and haematological tests on cows and calves
| Parameter | Reference range (19) | Normocupraemic cows, subgroup Ia | Normocupraemic calves, subgroup Ib | Hypocupraemic cows, subgroup IIa | Hypocupraemic calves, subgroup IIb |
|---|---|---|---|---|---|
| Cu (μmol/L) | 12–20 | 13.35 ± 1.50a | 13.45 ± 0.66a | 10.25 ± 1.18b | 11.83 ± 1.68ab |
| Fe (μmol/L) | 21.5–35.8 | 27.50 ± 1.33a | 23.70 ± 1.66b | 31.90 ± 3.98a | 25.25 ± 4.33ab |
| WBC ×109/L | 6.25–9.5 | 9.50 ± 3.89a | 10.03 ± 1.34a | 6.60 ± 1.61b | 9.70 ± 3.97a |
| GP (%) | 0–2 | 3.00 ± 1.00 | 1.50 ± 0.71 | 3.67 ± 3.79 | 2.00 ± 0.00 |
| GS (%) | 23–37 | 44.50 ± 15.80 | 31.50 ± 15.59 | 39.50 ± 10.85 | 35.67 ± 24.54 |
| L (%) | 53–67 | 49.00 ± 13.34 | 64.00 ± 15.01 | 52.25 ± 9.64 | 60.67 ± 21.46 |
| M (%) | 0–4 | 2.00 ± 0.00 | 2.00 ± 0.00 | 0.00 ± 0.00 | 0.00 ± 0.00 |
| RBC (×1012/L) | 5.0–7.0 | 7.23 ± 0.46a | 9.24 ± 0.93b | 7.08 ± 0.57a | 8.50 ± 1.91ab |
| HGB (g/L) | 105–140 | 114 ± 1.83a | 110.00 ± 1.83a | 101.75 ± 8.22b | 101.00 ± 1.84b |
| HCT (L/L) | 0.3–0.4 | 0.35 ± 0.01a | 0.31 ± 0.02ab | 0.29 ± 0.02b | 0.29 ± 0.07b |
| MCV (fL) | 40–60 | 48.75 ± 2.99a | 36.00 ± 3.46ab | 46.00 ± 6.98ab | 36.00 ± 1.73b |
| MCH (fmol/L) | 0.9–1.5 | 0.98 ± 0.06a | 0.71 ± 0.05b | 0.87 ± 0.10c | 0.70 ± 0.03b |
| MCHC (mmol/L) | 16–21 | 20.06 ± 0.31 | 19.81 ± 0.62 | 19.40 ± 0.22 | 19.59 ± 0.57 |
| PLT (×109/L) | 200–800 | 635 ± 164.04a | 807.25 ± 253.80b | 856.00 ± 83.63b | 815.00 ± 145.66b |
Table 2.
Lymphocyte immunophenotypes in cow and calf serum
| Normocupraemic cows, subgroup Ia | Normocupraemic calves, subgroup Ib | Hypocupraemic cows, subgroup IIa | Hypocupraemic calves, subgroup IIb | |
|---|---|---|---|---|
| TCD8% | 8.99 ± 0.72a | 7.45 ± 0.12a | 13.35 ± 2.61b | 13.18 ± 4.73b |
| TCD4% | 23.19 ± 2.85a | 16.12 ± 1.54b | 27.60 ± 5.03ac | 19.31 ± 3.91b |
| CD4+:CD8+ ratio | 2.58 ± 0.23a | 2.16 ± 0.17a | 2.14 ± 0.56a | 1.54 ± 0.36b |
| BCD21% | 26.35 ± 2.04a | 26.5 ± 4.72a | 24.88 ± 6.27a | 17.01 ± 14.30b |
| MHC II% | 45.12 ± 4.38a | 45.35 ± 16.99a | 36.15 ± 5.87b | 29.74 ± 16.20b |
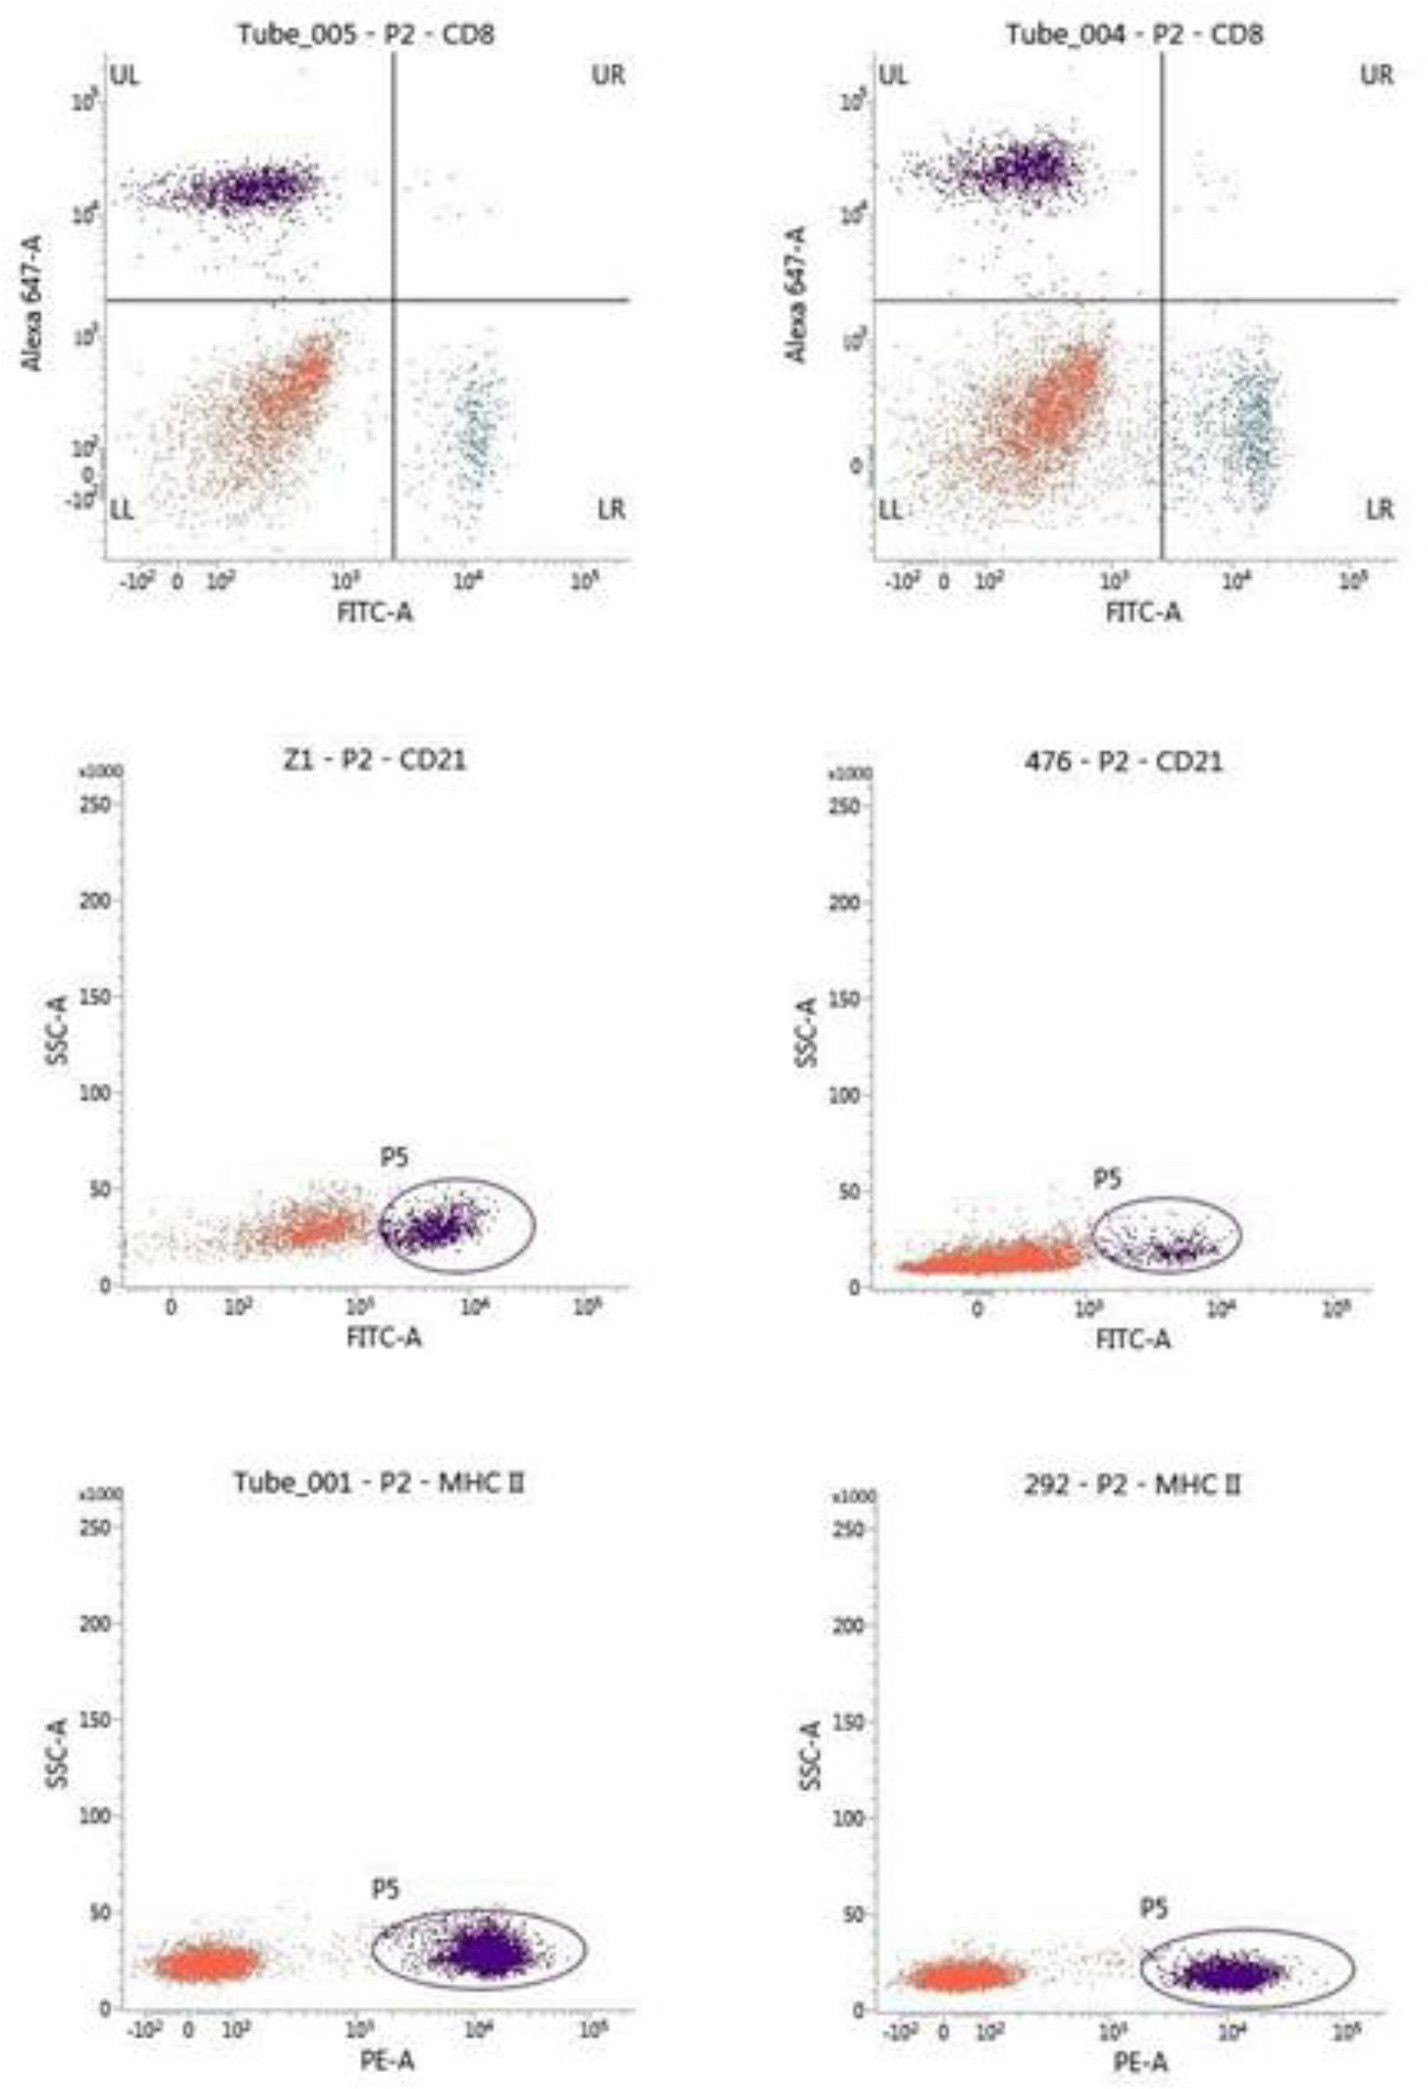
Fig. 2.
Representative flow cytometric dot plots of peripheral blood lymphocytes in cows with hypocupraemia and healthy control animals. A – healthy cows; B – cows with hypocupraemia. SSC – side scatter; A – pulse area; MHC II – major histocompatibility complex class II; PE – phycoerythrin